UNITED STATES
SECURITIES AND EXCHANGE COMMISSION
Washington, D.C. 20549
_______________________________
FORM 10-K
_______________________________
ANNUAL REPORT PURSUANT TO SECTION 13 OR 15(d) OF THE SECURITIES EXCHANGE ACT OF 1934 | ||||||||
For the fiscal year ended December 31 , 2020
or
TRANSITION REPORT PURSUANT TO SECTION 13 OR 15(d) OF THE SECURITIES EXCHANGE ACT OF 1934 | ||||||||
For the transition period from to
Commission file number 1-10934
_______________________________

(Exact Name of Registrant as Specified in Its Charter)
_______________________________
(State or Other Jurisdiction of Incorporation or Organization) | (I.R.S. Employer Identification No.) | |||||||
(Address of Principal Executive Offices) (Zip Code)
Registrant’s telephone number, including area code (403 ) 231-3900
_______________________________
Securities registered pursuant to Section 12(b) of the Act:
| Title of each class | Trading Symbol(s) | Name of each exchange on which registered | ||||||
Securities registered pursuant to Section 12(g) of the Act: None
_______________________________
Indicate by check mark if the registrant is a well-known seasoned issuer, as defined in Rule 405 of the Securities Act. Yes ☒ No ☐
Indicate by check mark if the registrant is not required to file reports pursuant to Section 13 or Section 15(d) of the Act. Yes ☐ No ☒
Indicate by check mark whether the registrant (1) has filed all reports required to be filed by Section 13 or 15(d) of the Securities Exchange Act of 1934 during the preceding 12 months (or for such shorter period that the registrant was required to file such reports), and (2) has been subject to such filing requirements for the past 90 days. Yes ☒ No ☐
Indicate by check mark whether the registrant has submitted electronically every Interactive Data File required to be submitted pursuant to Rule 405 of Regulation S-T (§232.405 of this chapter) during the preceding 12 months (or for such shorter period that the registrant was required to submit such files). Yes ☒ No ☐
Indicate by check mark whether the registrant is a large accelerated filer, an accelerated filer, a non-accelerated filer, or a smaller reporting company. See the definitions of “large accelerated filer,” “accelerated filer”, “smaller reporting company” and "emerging growth company" in Rule 12b-2 of the Exchange Act.
| ☒ | Accelerated Filer | ☐ | ||||||||||||
| Non-Accelerated Filer | ☐ | Smaller reporting company | ||||||||||||
| Emerging growth company | ||||||||||||||
If an emerging growth company, indicate by check mark if the registrant has elected not to use the extended transition period for complying with any new or revised financial accounting standards provided pursuant to Section 13(a) of the Exchange Act. ☐
Indicate by check mark whether the registrant is a shell company (as defined in Rule 12b-2 of the Exchange Act). Yes ☐ No ☒
Indicate by check mark whether the registrant has filed a report on and attestation to its management's assessment of the effectiveness of its internal control over financial reporting under Section 404(b) of the Sarbanes-Oxley Act (15 U.S.C. 7262(b)) by the registered public accounting firm that prepared or issued its audit report. Yes ☒ No ☐
The aggregate market value of the registrant’s common shares held by non-affiliates computed by reference to the price at which the common equity was last sold on June 30, 2020, was approximately US$59.2 billion.
As at February 5, 2021, the registrant had 2,025,495,603 common shares outstanding.
DOCUMENTS INCORPORATED BY REFERENCE:
Not applicable.
EXPLANATORY NOTE
Enbridge Inc., a corporation existing under the Canada Business Corporations Act, qualifies as a foreign private issuer in the United States of America (US) for purposes of the Securities Exchange Act of 1934, as amended (the Exchange Act). Although, as a foreign private issuer, Enbridge Inc. is not required to do so, Enbridge Inc. currently files annual reports on Form 10-K, quarterly reports on Form 10-Q, and current reports on Form 8-K with the Securities and Exchange Commission (SEC) instead of filing the reporting forms available to foreign private issuers.
Enbridge Inc. intends to prepare and file a management proxy circular and related material under Canadian requirements. As Enbridge Inc.’s management proxy circular is not filed pursuant to Regulation 14A, Enbridge Inc. may not incorporate by reference information required by Part III of this Form 10-K from its management proxy circular. Accordingly, in reliance upon and as permitted by Instruction G(3) to Form 10-K, Enbridge Inc. will be filing an amendment to this Form 10-K containing the Part III information no later than 120 days after the end of the fiscal year covered by this Form 10-K.
2
| Page | ||||||||
| PART I | ||||||||
| Item 1. | ||||||||
| Item 1A. | ||||||||
| Item 1B. | ||||||||
| Item 2. | ||||||||
| Item 3. | ||||||||
| Item 4. | ||||||||
| PART II | ||||||||
| Item 5. | ||||||||
| Item 6. | ||||||||
| Item 7. | ||||||||
| Item 7A. | ||||||||
| Item 8. | ||||||||
| Item 9. | ||||||||
| Item 9A. | ||||||||
| Item 9B. | ||||||||
| PART III | ||||||||
| Item 10. | ||||||||
| Item 11. | ||||||||
| Item 12. | ||||||||
| Item 13. | ||||||||
| Item 14. | ||||||||
| PART IV | ||||||||
| Item 15. | ||||||||
| Item 16. | ||||||||
Signatures | ||||||||
3
GLOSSARY
| AFUDC | Allowance for funds used during construction | |||||||
| AOCI | Accumulated other comprehensive income/(loss) | |||||||
| ARO | Asset retirement obligations | |||||||
| ASU | Accounting Standards Update | |||||||
| BC | British Columbia | |||||||
| bcf/d | Billion cubic feet per day | |||||||
| bpd | Barrels per day | |||||||
| CER | Canada Energy Regulator, created by the Canadian Energy Regulator Act which also repealed the National Energy Board Act, on August 28, 2019 | |||||||
| CPP Investments | Canada Pension Plan Investment Board | |||||||
| CTS | Competitive Toll Settlement | |||||||
| DAPL | Dakota Access Pipeline | |||||||
| Dawn | An extensive network of underground storage pools at the Tecumseh Gas Storage facility and Dawn Hub | |||||||
| DCP Midstream | DCP Midstream, LLC | |||||||
| EBITDA | Earnings before interest, income taxes and depreciation and amortization | |||||||
| EEM | Enbridge Energy Management, L.L.C. | |||||||
| EEP | Enbridge Energy Partners, L.P. | |||||||
| EGD | Enbridge Gas Distribution Inc. | |||||||
| EIS | Environmental Impact Statement | |||||||
| Enbridge | Enbridge Inc. | |||||||
| Enbridge Gas | Enbridge Gas Inc. | |||||||
| ENF | Enbridge Income Fund Holdings Inc. | |||||||
| ESG | Environment, Social and Governance | |||||||
| FERC | Federal Energy Regulatory Commission | |||||||
| Flanagan South | Flanagan South Pipeline | |||||||
| GHG | Greenhouse gas | |||||||
| ISO | Incentive Stock Options | |||||||
| kbpd | Thousand barrels per day | |||||||
| LIBOR | London Interbank Offered Rate | |||||||
| LMCI | Land Matters Consultation Initiative | |||||||
| LNG | Liquefied natural gas | |||||||
| MATL | Montana-Alberta Tie-Line | |||||||
| MD&A | Management’s Discussion and Analysis | |||||||
| Merger Transaction | Combination of Enbridge and Spectra Energy through a stock-for-stock merger transaction which closed on February 27, 2017 | |||||||
| MNPUC | Minnesota Public Utilities Commission | |||||||
| MOLP | Midcoast Operating, L.P. and its subsidiaries | |||||||
4
| MW | Megawatts | |||||||
| NGL | Natural gas liquids | |||||||
| Noverco | Noverco Inc. | |||||||
| NYSE | New York Stock Exchange | |||||||
| OCI | Other comprehensive income/(loss) | |||||||
| OEB | Ontario Energy Board | |||||||
| OPEB | Other postretirement benefit obligations | |||||||
| PHMSA | Pipeline and Hazardous Materials Safety Administration | |||||||
| RSU | Restricted Stock Units | |||||||
| Sabal Trail | Sabal Trail Transmission, LLC | |||||||
| Seaway Pipeline | Seaway Crude Pipeline System | |||||||
| SEP | Spectra Energy Partners, LP | |||||||
| Spectra Energy | Spectra Energy Corp | |||||||
| Sponsored Vehicles buy-in | In the fourth quarter of 2018, Enbridge Inc. completed the buy-ins of our sponsored vehicles: Spectra Energy Partners, LP (SEP), Enbridge Energy Partners, L.P. (EEP), Enbridge Energy Management, L.L.C. (EEM) and Enbridge Income Fund Holdings Inc. (ENF), (collectively, the Sponsored Vehicles), where we acquired, in separate combination transactions, all of the outstanding equity securities of those Sponsored Vehicles not beneficially owned by us. | |||||||
| Texas Eastern | Texas Eastern Transmission, L.P. | |||||||
| TSX | Toronto Stock Exchange | |||||||
| Union Gas | Union Gas Limited | |||||||
| US | United States of America | |||||||
| US GAAP | Generally accepted accounting principles in the United States of America | |||||||
| US L3R Program | United States portion of the Line 3 Replacement Program | |||||||
| Vector | Vector Pipeline L.P. | |||||||
| VIE | Variable interest entities | |||||||
| WCSB | Western Canadian Sedimentary Basin | |||||||
| Westcoast | Westcoast Energy Inc. | |||||||
5
CONVENTIONS
The terms "we", "our", "us" and "Enbridge" as used in this report refer collectively to Enbridge Inc. and its subsidiaries unless the context suggests otherwise. These terms are used for convenience only and are not intended as a precise description of any separate legal entity within Enbridge.
Unless otherwise specified, all dollar amounts are expressed in Canadian dollars, all references to “dollars” or “$” are to Canadian dollars and all references to “US$” are to US dollars. All amounts are provided on a before tax basis, unless otherwise stated.
FORWARD-LOOKING INFORMATION
Forward-looking information, or forward-looking statements, have been included in this Annual Report on Form 10-K to provide information about us and our subsidiaries and affiliates, including management’s assessment of our and our subsidiaries’ future plans and operations. This information may not be appropriate for other purposes. Forward-looking statements are typically identified by words such as ‘‘anticipate”, “believe”, “estimate”, “expect”, “forecast”, “intend”, “likely”, “plan”, “project”, “target” and similar words suggesting future outcomes or statements regarding an outlook. Forward-looking information or statements included or incorporated by reference in this document include, but are not limited to, statements with respect to the following: our corporate vision and strategy, including strategic priorities and enablers; the COVID-19 pandemic and the duration and impact thereof; energy intensity and emissions reduction targets and related ESG matters; diversity and inclusion goals; expected supply of, demand for, and prices of crude oil, natural gas, natural gas liquids (NGL), liquified natural gas and renewable energy; energy transition; anticipated utilization of our existing assets; expected earnings before interest, income taxes and depreciation and amortization (EBITDA); expected earnings/(loss); expected future cash flows and distributable cash flow; dividend growth and payout policy; financial strength and flexibility; expectations on sources of liquidity and sufficiency of financial resources; expected strategic priorities and performance of the Liquids Pipelines, Gas Transmission and Midstream, Gas Distribution and Storage, Renewable Power Generation and Energy Services businesses; expected costs related to announced projects and projects under construction and for maintenance; expected in-service dates for announced projects and projects under construction; expected capital expenditures, investment capacity and capital allocation priorities; expected equity funding requirements for our commercially secured growth program; expected future growth and expansion opportunities; expectations about our joint venture partners’ ability to complete and finance projects under construction; expected closing of acquisitions and dispositions and the timing thereof; expected benefits of transactions, including the realization of efficiencies, synergies and cost savings; expected future actions of regulators and courts; toll and rate cases discussions and filings, including Mainline System Contracting; anticipated competition; United States Line 3 Replacement Program (US L3R Program), including anticipated in-service dates and capital costs; and Line 5 dual pipelines and related litigation and other matters.
Although we believe these forward-looking statements are reasonable based on the information available on the date such statements are made and processes used to prepare the information, such statements are not guarantees of future performance and readers are cautioned against placing undue reliance on forward-looking statements. By their nature, these statements involve a variety of assumptions, known and unknown risks and uncertainties and other factors, which may cause actual results, levels of activity and achievements to differ materially from those expressed or implied by such statements. Material assumptions include assumptions about the following: the COVID-19 pandemic and the duration and impact thereof; the expected supply of and demand for crude oil, natural gas, NGL and renewable energy; prices of crude oil, natural gas, NGL and renewable energy; anticipated utilization of assets; exchange rates; inflation; interest rates; availability and price of labor and construction materials; operational reliability; customer and regulatory approvals; maintenance of support and regulatory approvals for our projects; anticipated in-service dates; weather; the timing and closing of acquisitions and dispositions; the realization of anticipated benefits and synergies of transactions; governmental legislation; litigation; estimated future dividends and impact of our dividend policy on our future cash flows; our credit ratings; capital project funding; hedging program; expected EBITDA; expected earnings/(loss); expected future cash flows; and expected distributable cash flow. Assumptions regarding the expected supply of and demand for crude oil, natural gas, NGL and renewable energy, and the prices of these commodities, are material to and underlie all forward-looking statements, as they may impact current and future levels of demand for our services. Similarly, exchange rates, inflation, interest rates and the COVID-19 pandemic impact the economies and business environments in which we operate and may impact levels of demand for our services and cost of inputs, and are therefore inherent in all forward-looking statements. Due to the interdependencies and correlation of these macroeconomic factors, the impact of any one assumption on a forward-looking statement cannot be determined with certainty, particularly with respect to expected EBITDA, expected
6
earnings/(loss), expected future cash flows, expected distributable cash flow or estimated future dividends. The most relevant assumptions associated with forward-looking statements regarding announced projects and projects under construction, including estimated completion dates and expected capital expenditures, include the following: the availability and price of labor and construction materials; the effects of inflation and foreign exchange rates on labor and material costs; the effects of interest rates on borrowing costs; the impact of weather, customer, government, court and regulatory approvals on construction and in-service schedules and cost recovery regimes; and the COVID-19 pandemic and the duration and impact thereof.
Our forward-looking statements are subject to risks and uncertainties pertaining to the successful execution of our strategic priorities, operating performance, legislative and regulatory parameters; litigation, including with respect to the Dakota Access Pipeline (DAPL) and the Line 5 dual pipelines; acquisitions, dispositions and other transactions and the realization of anticipated benefits therefrom; our dividend policy; project approval and support; renewals of rights-of-way; weather; economic and competitive conditions; public opinion; changes in tax laws and tax rates; exchange rates; interest rates; commodity prices; political decisions; the supply of, demand for and prices of commodities; and the COVID-19 pandemic, including but not limited to those risks and uncertainties discussed in this Annual Report on Form 10-K and in our other filings with Canadian and US securities regulators. The impact of any one risk, uncertainty or factor on a particular forward-looking statement is not determinable with certainty as these are interdependent and our future course of action depends on management’s assessment of all information available at the relevant time. Except to the extent required by applicable law, Enbridge assumes no obligation to publicly update or revise any forward-looking statement made in this Annual Report on Form 10-K or otherwise, whether as a result of new information, future events or otherwise. All forward-looking statements, whether written or oral, attributable to us or persons acting on our behalf, are expressly qualified in their entirety by these cautionary statements.
7
PART I
ITEM 1. BUSINESS
We are a leading North American energy infrastructure company. We safely and reliably deliver the energy people need and want to fuel quality of life. Our core businesses include Liquids Pipelines, which transports approximately 25% of the crude oil produced in North America; Gas Transmission and Midstream, which transports approximately 20% of the natural gas consumed in the US; Gas Distribution and Storage, which serves approximately 75% of Ontario residents via approximately 3.8 million meter connections; and Renewable Power Generation, which generates approximately 1,750 megawatts (MW) of net renewable power in North America and Europe. Our common shares trade on the Toronto Stock Exchange (TSX) and New York Stock Exchange (NYSE) under the symbol ENB. We were incorporated on April 13, 1970 under the Companies Ordinance of the Northwest Territories and were continued under the Canada Business Corporations Act on December 15, 1987.
A more detailed description of each of our businesses and underlying assets is provided below under Business Segments.
CORPORATE VISION AND STRATEGY
VISION
Our vision is to be the leading energy infrastructure company in North America. In pursuing this vision, we play a critical role in enabling the economic well-being of North Americans who depend on access to affordable and reliable energy. Our unparalleled infrastructure franchises transport, distribute and generate energy, and our primary purpose is to fuel quality of life by delivering the energy North Americans need and want, in the safest and most responsible way possible.
Our investor value proposition is founded on our ability to deliver predictable cash flows and a growing stream of dividends year-over-year through investment in and efficient operation of, energy infrastructure assets that are strategically positioned between key supply basins and strong demand-pull markets. Our assets are underpinned by long-term contracts, regulated cost-of-service tolling frameworks and other low-risk commercial arrangements. Among our peers, we strive to be a leader in several key areas that create sustainable comparative advantage and value for shareholders including: worker and public safety; Environment, Social and Governance (ESG); stakeholder relations; customer service; community investment; and employee satisfaction.
STRATEGY
An in-depth understanding of energy supply and demand fundamentals coupled with disciplined capital allocation principles has helped us become an industry leader supported by a diverse set of assets across the energy system. These assets have reliably generated resilient cash flows amid many commodity and economic cycles, including the COVID-19 pandemic and ensuing economic and energy market disruption whereby we exceeded the mid-point of our 2020 financial guidance range. Given its success, this comprehensive approach will continue to underpin our investment decisions moving forward.
8
In addition to resiliency, sustainable growth is a hallmark of our investor value proposition. We see a 5-7% growth rate through 2023 underpinned by opportunities to generate returns in our base business and grow the business through disciplined capital deployment. Our diversified footprint allows for selective investment in not only our core businesses, but new emerging platforms driven by the on-going energy transition such as carbon capture, sequestration and storage, hydrogen and renewable natural gas (RNG). We have successfully implemented this diversified approach and have seen opportunity in transition throughout our history, as evidenced by the emergence of our Gas Transmission and Midstream and Renewable Power Generation businesses over time.
ESG leadership is an important element of our strategy. Our commitment to reducing our carbon footprint, building lasting relationships in the communities we serve and promoting equality, inclusiveness and transparency play a role in our ability to operate our assets and thus generate cashflow over the long term. Our ESG performance is consistently ranked in the top tier of our sector.
In 2020, we progressed several of our strategic priorities. For example:
•Our Liquids Pipelines team secured all remaining permits for the Line 3 Replacement Program and began construction on the final Minnesota leg required to restore the original line capacity of 760 thousand barrels per day (kbpd);
•Our Gas Transmission and Midstream business successfully completed three rate settlements that will contribute an additional $160 million of annual EBITDA together with modernization enhancements that increased the longevity of the system;
•Our Gas Distribution and Storage utility added 43 thousand new customers, completed $500 million of growth capital projects and progressed investments in RNG and hydrogen infrastructure;
•Our Renewable Power Generation business continued to grow its European offshore wind sector as evidenced by the start of construction of the 480 MW Saint Nazaire project and the 500 MW Fécamp project;
•We committed to environmental goals that include a 35% reduction in greenhouse gas (GHG) emissions intensity from our operations by 2030 and net zero GHG emissions by 2050. We also set goals to increase representation of diverse groups within our workforce by 2025, including the acceleration of existing goals; and
•We sold $400 million of assets, further strengthening our Balance Sheet and financial flexibility. We also reduced operating costs by $300 million, increasing our profitability and competitiveness.
These achievements are discussed in further detail in Part II. Item 7. Management’s Discussion and Analysis of Financial Condition and Results of Operations.
Looking ahead, our near-term strategic priorities remain similar to years past. As always, proactively advancing the safety of communities, and protecting the environment, will always be our top priority. We are focused on enhancing the value of our existing assets in Liquids Pipelines, Gas Transmission and Midstream, Gas Distribution and Storage and Renewable Power Generation and executing on our secured capital program.
We will continue to capitalize on our liquids and natural gas pipeline infrastructure toward export-driven opportunities and focus on in-franchise growth in our gas utility as well as low carbon opportunities. Our Renewable Power Generation business, anchored by investments in contracted offshore wind power, compliments our low risk business model and supports our increasing focus on the energy transition. We will continue to invest in renewable power generation where we can achieve attractive risk adjusted returns.
Our key strategic priorities are summarized below:
9
Ensure Safe Reliable Operations
Safety and operational reliability remain the foundation of our strategy. Our commitment to safety and operational reliability means achieving and maintaining industry leadership in safety (process, public and personal) and ensuring the reliability and integrity of the systems we operate, in order to generate, transport and deliver energy while protecting people and the environment.
Enhance Returns from our Base Businesses
A key priority is to drive growth through an ongoing focus on optimization, productivity and efficiency across all our businesses. Examples include throughput enhancements on our liquids system from the application of drag-reducing agents and improvements in scheduling logistics at our terminals, revenue optimization through negotiated toll settlements or rate cases, ongoing synergy capture following our utility merger and, more generally, creating sustainable cost savings across the organization through process improvement and/or system enhancements.
Execute the Capital Program and Grow Core Business
Successful project execution is integral to our financial performance and to the strategic positioning of our business over the long-term. Our ongoing objective is to deliver our slate of secured projects (currently $16 billion) at the lowest practical cost while maintaining the highest standards for safety, quality, customer satisfaction and environmental and regulatory compliance. For a discussion of our current portfolio of capital projects, refer to Part II. Item 7. Management's Discussion and Analysis of Financial Condition and Results of Operations - Growth Projects - Commercially Secured Projects.
In seeking to extend growth, we expect to have sufficient self-funding capacity, post completion of our secured capital program, to invest $5 to $6 billion per year in new organic growth capital without issuing any additional common equity and maintaining key credit metrics within planning parameters and targets established with credit rating agencies. We will remain disciplined and deploy capital towards the best uses, prioritizing balance sheet strength, investment in low capital intensity growth and regulated utility or utility-like projects. We will carefully deploy our remaining investable capacity to the most value enhancing opportunities including further organic growth and potential for share buybacks.
Looking ahead, we see strong utilization of our existing network and opportunities for future growth within each of our four core businesses. For example:
•Our liquids pipelines infrastructure will remain a vital connection between key supply basins and demand-pull markets, while a growing export market represents an opportunity to expand US Gulf Coast presence;
•Our natural gas pipelines business will seek extension and expansion opportunities driven by new load demand from gas-fired power generation, industrial growth and coastal liquefaction plants;
•Our gas distribution utility will continue to grow through customer additions, expansion of existing facilities and storage, reducing operating costs and blending hydrogen and RNG into its gas supply mix; and
•Our growing capabilities in the offshore wind sector positions us well for continued growth, while self-powering of existing pipeline compressor stations represents a large opportunity.
Maintain Financial Strength and Flexibility
The maintenance of our financial strength is critical to our strategy. Our financing strategies are designed to retain strong, investment-grade credit ratings to ensure that we have the financial capacity to meet our capital funding needs and the flexibility to manage capital market disruptions and respond to opportunities as they arise. Our current secured capital program, which extends to 2023, can be readily financed through internally generated cash flow and available balance sheet capacity without issuance of additional common equity and we will seek to secure new growth using this “self-funded” equity model. For further discussion on our financing strategies, refer to Part II. Item 7. Management's Discussion and Analysis of Financial Condition and Results of Operations - Liquidity and Capital Resources.
10
Disciplined Capital Allocation
We assess the latest fundamental trends, monitor the business landscape and proactively conduct business development activities with the goal of identifying an industry-leading opportunity set for capital deployment. Opportunities are screened, analyzed and assessed using a disciplined investment framework with the objective of ensuring effective deployment of capital to achieve attractive risk-adjusted returns while maintaining our low-risk “utility-like” business model.
All projects are evaluated based on their potential to advance our strategy, contain risk and create additional financial flexibility. Our primary emphasis in the near-term is on low capital intensity projects, modernization of our systems and utility rate-based investments. Execution risk remains high for large scale, long-duration development projects and, therefore, our focus will be on projects where we can carefully manage at-risk capital during the permitting and construction phases.
In evaluating typical investment opportunities, we also consider other potential capital allocation choices that may add value. Other potential choices for capital deployment will depend on our current outlook and the size of our existing capital project backlog and could include dividend increases, further debt reduction or share re-purchases.
Adapt to Energy Transition Over Time
As the global population grows and standards of living continue to improve around the world, more energy will be needed. At the same time, our society increasingly recognizes the impacts of energy consumption on the world’s climate. Accordingly, energy systems are being reshaped as industry participants, regulators and consumers seek to balance competing objectives. As a diversified energy infrastructure company, we are well positioned to play a key role in the transition to a low-carbon economy while at the same time working to reduce our own emissions intensity.
We believe that diversification and innovation will play a significant role in the transition to a low carbon future. To date, we have made large investments in natural gas infrastructure and continue to see significant opportunity in renewable energy, particularly offshore wind. Furthermore, we have tested our existing assets for various energy transition scenarios and concluded that they are highly resilient and can be relied upon for stable cash flow generation well into the future.
STRATEGIC ENABLERS
Our success in executing on our strategic priorities is very much enabled by our commitment to ESG issues, the quality and capabilities of our people and the extent to which we embrace technology and encourage innovation as a competitive advantage.
ESG
Sustainability is integral to our ability to safely and reliably deliver the energy people need and want. How well we perform as a steward of our environment, a safe operator of essential energy infrastructure, a diverse and inclusive employer and a responsible corporate citizen is inextricably linked to our ability to achieve our strategic priorities and create long-term value for all stakeholders.
11
Our commitment to strong ESG practices and performance has long been core to how we do business and we are proud to be recognized as a leader amongst our peers. In 2020, we set out ambitious goals including:
•Net zero GHG emissions by 2050 with an interim target to reduce GHG emissions intensity 35% by 2030;
•Increased representation of diverse groups within our workforce by 2025, including representation goals of 40% women and 28% racial and ethnic groups, along with new initiatives to enhance supplier diversity;
•Strengthening diversity on our Board with representation goals of 40% women and 20% racial and ethnic groups by 2025; and
•Annual safety and reliability targets that drive continuous improvement towards our goal of zero incidents, injuries and occupational injuries, and implementation of robust cyber defense programs.
These goals represent the next stage of our progression to ensure we are positioned to grow our company sustainably for many decades to come. Beginning in 2021, we will measure ESG performance when determining incentive compensation. Achieving our goals will put us in a better position to successfully transition to a low carbon, more diverse and inclusive future.
People
Our employees are essential to our long-term success and enhancing the capability of our people to maximize their potential is a key area of focus. We value diversity and have embedded inclusive practices throughout our programs and approach to people management. Furthermore, we strive to maintain industry competitive compensation and retention programs that provide both short-term and long-term performance incentives.
Technology
Given the competitive climate of today’s energy sector, we recognize the vital role technology can play in helping us achieve our strategic objectives. Our two Technology and Innovation labs, located in Calgary and Houston, embody our commitment to technology enabled business solutions. Leveraging the benefits of technology to contribute to safety, reliability and the profitability of assets has become entrenched in our everyday operations.
We provide annual progress updates related to the above initiatives in our annual Sustainability Report which can be found at https://www.enbridge.com/sustainability-reports. Unless otherwise specifically stated, none of the information contained on, or connected to, the Enbridge website is incorporated by reference in, or otherwise part of, this Annual Report on Form 10-K.
BUSINESS SEGMENTS
Our activities are carried out through five business segments: Liquids Pipelines; Gas Transmission and Midstream; Gas Distribution and Storage; Renewable Power Generation; and Energy Services, as discussed below.
12
LIQUIDS PIPELINES
Liquids Pipelines consists of pipelines and terminals in Canada and the US that transport various grades of crude oil and other liquid hydrocarbons.

13
MAINLINE SYSTEM
The Mainline System is comprised of the Canadian Mainline and the Lakehead System. The Canadian Mainline is a common carrier pipeline system which transports various grades of oil and other liquid hydrocarbons within western Canada and from western Canada to the Canada/US border near Gretna, Manitoba and Neche, North Dakota and from the US/Canada border near Port Huron, Michigan and Sarnia, Ontario to eastern Canada and the northeastern US. The Canadian Mainline includes six adjacent pipelines with a combined capacity of approximately 2.9 million barrels per day (bpd) that connect with the Lakehead System at the Canada/US border, as well as five pipelines that deliver crude oil and refined products into eastern Canada and the northeastern US. We have operated, and frequently expanded, the Canadian Mainline since 1949. The Lakehead System is the portion of the Mainline System in the US. It is an interstate common carrier pipeline system regulated by the Federal Energy Regulatory Commission (FERC) and is the primary transporter of crude oil and liquid petroleum from western Canada to the US.
Competitive Toll Settlement
The Competitive Toll Settlement (CTS) is the current framework governing tolls paid for products shipped on the Canadian Mainline, with the exception of Lines 8 and 9 which are tolled on a separate basis. The 10-year settlement was negotiated by representatives of Enbridge, the Canadian Association of Petroleum Producers and other shippers on the Canadian Mainline. It was approved by the National Energy Board (now the Canada Energy Regulator (CER)). The CTS provides for a Canadian Local Toll (CLT) for deliveries within western Canada, as well as an International Joint Tariff (IJT) for crude oil shipments originating in western Canada, on the Canadian Mainline, and delivered into the US, via the Lakehead System, and into eastern Canada. The IJT tolls are denominated in US dollars. The IJT is designed to provide shippers on the Mainline System with a stable and competitive long-term toll, thereby preserving and enhancing throughput on the Mainline System. The CLT and the IJT are adjusted annually, on July 1 of each year, at a rate equal to 75% of the Canadian Gross Domestic Product at Market Price Index published by Statistics Canada.
Although the current CTS has a 10-year term and is in place until June 30, 2021, it does not require shippers to commit to certain volumes. Shippers nominate volumes on a monthly basis and we allocate capacity to maximize the efficiency of the Mainline System.
Local tolls for service on the Lakehead System are not affected by the CTS and continue to be established pursuant to the Lakehead System’s existing toll agreements, as described below. Under the terms of the IJT agreement, the Canadian Mainline’s share of the IJT relating to pipeline transportation of a batch from any western Canada receipt point to the US border is equal to the IJT applicable to that batch’s US delivery point less the Lakehead System’s local toll to that delivery point. This amount is referred to as the Canadian Mainline IJT Residual Benchmark Toll and is denominated in US dollars.
Lakehead System Local Tolls
Transportation rates are governed by the FERC for deliveries from the Canada/US border near Neche, North Dakota, Clearbrook, Minnesota and other points to principal delivery points on the Lakehead System. The Lakehead System periodically adjusts these transportation rates as allowed under the FERC’s index methodology and tariff agreements, the main components of which are index rates and the Facilities Surcharge Mechanism. Index rates, the base portion of the transportation rates for the Lakehead System, are subject to an annual adjustment which cannot exceed established ceiling rates as approved by the FERC. The Facilities Surcharge Mechanism allows the Lakehead System to recover costs associated with certain shipper-requested projects through an incremental surcharge in addition to the existing index rates, and is subject to annual adjustment on April 1 of each year. To the extent that the Lakehead System transportation rates materially under-recover the Lakehead System cost of service, an application can be made with the FERC to seek approval to increase the rates in order to bring recoveries in-line with costs.
14
Mainline System Contracting
On December 19, 2019, we submitted an application to the CER to implement contracting on our Mainline System. The application for contracted and uncommitted service included the associated terms, conditions and tolls of each service, which would be offered in an open season following approval by the CER. The tolls and services would replace the current CTS that is in place until June 30, 2021. If a replacement agreement is not in place by June 30, 2021, the CTS provides for tolls to continue on an interim basis.
For further information, refer to Part II. Item 7. Management's Discussion and Analysis of Financial Condition and Results of Operations - Recent Developments - Mainline System Contracting.
REGIONAL OIL SANDS SYSTEM
The Regional Oil Sands System includes five intra-Alberta long-haul pipelines; the Athabasca Pipeline, Waupisoo Pipeline, Woodland Pipeline, Wood Buffalo Extension/Athabasca Twin pipeline system and the Norlite Pipeline System (Norlite), as well as two large terminals: the Athabasca Terminal located north of Fort McMurray, Alberta and the Cheecham Terminal, located south of Fort McMurray, Alberta. The Regional Oil Sands System also includes numerous laterals and related facilities which currently provide access for oil sands production from twelve producing oil sands projects.
The combined capacity of the intra-Alberta long-haul pipelines is approximately 930 kbpd to Edmonton and 1,370 kbpd into Hardisty, with Norlite providing approximately 218 kbpd of diluent capacity into the Fort McMurray region. We have a 50% interest in the Woodland Pipeline and a 70% interest in Norlite. The Regional Oil Sands System is anchored by long-term agreements with multiple oil sands producers that provide cash flow stability and also include provisions for the recovery of some of the operating costs of this system.
GULF COAST AND MID-CONTINENT
Gulf Coast includes Seaway Crude Pipeline System (Seaway Pipeline), Flanagan South Pipeline (Flanagan South), Spearhead Pipeline and Gray Oak Pipeline, as well as the Mid-Continent System comprised of the Cushing Terminal.
We have a 50% interest in the 1,078-kilometer (670-mile) Seaway Pipeline, including the 805-kilometer (500-mile), 30-inch diameter long-haul system between Cushing, Oklahoma and Freeport, Texas, as well as the Texas City Terminal and Distribution System which serve refineries in the Houston and Texas City areas. Total aggregate capacity on the Seaway Pipeline system is approximately 950 kbpd. Seaway Pipeline also includes 8.8 million barrels of crude oil storage tank capacity on the Texas Gulf Coast.
Flanagan South is a 950-kilometer (590-mile), 36-inch diameter interstate crude oil pipeline that originates at our terminal at Flanagan, Illinois, a delivery point on the Lakehead System, and terminates in Cushing, Oklahoma. Flanagan South has a capacity of approximately 600 kbpd.
Spearhead Pipeline is a long-haul pipeline that delivers crude oil from Flanagan, Illinois, a delivery point on the Lakehead System, to Cushing, Oklahoma. The Spearhead pipeline has a capacity of approximately 193 kbpd.
The Gray Oak pipeline is a 1,368-kilometer (850-mile) crude oil system, which runs from the Permian Basin in West Texas to the US Gulf Coast. The Gray Oak pipeline has an expected average annual capacity of 900 kbpd and transports light crude oil. We have an effective 22.8% interest in the pipeline. Initial in-service for the pipeline commenced in November 2019 with full service achieved in the second quarter of 2020.
15
The Mid-Continent System is comprised of storage terminals at Cushing, Oklahoma (Cushing Terminal), consisting of over 80 individual storage tanks ranging in size from 78 to 570 thousand barrels. Total storage shell capacity of Cushing Terminal is approximately 20 million barrels. A portion of the storage facilities are used for operational purposes, while the remainder are contracted to various crude oil market participants for their term storage requirements. Contract fees include fixed monthly storage fees, throughput fees for receiving and delivering crude to and from connecting pipelines and terminals, as well as blending fees.
OTHER
Other includes Southern Lights Pipeline, Express-Platte System, Bakken System and Feeder Pipelines and Other.
Southern Lights Pipeline is a single stream 180 kbpd 16/18/20-inch diameter pipeline that ships diluent from the Manhattan Terminal near Chicago, Illinois to three western Canadian delivery facilities, located at the Edmonton and Hardisty terminals in Alberta and the Kerrobert terminal in Saskatchewan. Both the Canadian portion of Southern Lights Pipeline and the US portion of Southern Lights Pipeline receive tariff revenues under long-term contracts with committed shippers. Southern Lights Pipeline capacity is 90% contracted with the remaining 10% of the capacity assigned for shippers to ship uncommitted volumes.
The Express-Platte System consists of the Express pipeline and the Platte pipeline, and crude oil storage of approximately 5.6 million barrels. It is an approximate 2,736-kilometer (1,700-mile) long crude oil transportation system, which begins at Hardisty, Alberta, and terminates at Wood River, Illinois. The 310 kbpd Express pipeline carries crude oil to US refining markets in the Rocky Mountains area, including Montana, Wyoming, Colorado and Utah. The 145 to 164 kbpd Platte pipeline, which interconnects with the Express pipeline at Casper, Wyoming, transports crude oil predominantly from the Bakken shale and western Canada to refineries in the midwest. Express pipeline capacity is typically committed under long-term take-or-pay contracts with shippers. A small portion of Express pipeline capacity and all of the Platte pipeline capacity is used by uncommitted shippers who pay only for the pipeline capacity they actually use in a given month.
The Bakken System consists of the North Dakota System and the Bakken Pipeline System. The North Dakota System services the Bakken in North Dakota and is comprised of a crude oil gathering and interstate pipeline transportation system. The gathering system provides delivery to Clearbrook, Minnesota for service on the Lakehead system or a variety of interconnecting pipeline and rail export facilities. The interstate portion of the system has both US and Canadian components that extend from Berthold, North Dakota into Cromer, Manitoba.
Tariffs on the US portion of the North Dakota System are governed by the FERC and include a local tariff. The Canadian portion is categorized as a Group 2 pipeline, and as such, its tolls are regulated by the CER on a complaint basis. Tolls on the interstate pipeline system are based on long-term take-or-pay agreements with anchor shippers.
We have an effective 27.6% interest in the Bakken Pipeline System, which connects the Bakken formation in North Dakota to markets in eastern PADD II and the US Gulf Coast. The Bakken Pipeline System consists of the DAPL from the Bakken area in North Dakota to Patoka, Illinois, and the Energy Transfer Crude Oil Pipeline from Patoka, Illinois to Nederland, Texas. Current capacity is 570 kbpd of crude oil with the potential to be expanded through additional pumping horsepower. The Bakken Pipeline System is anchored by long-term throughput commitments from a number of producers.
Feeder Pipelines and Other includes a number of liquids storage assets and pipeline systems in Canada and the US.
16
Key assets included in Feeder Pipelines and Other are the Hardisty Contract Terminal and Hardisty Storage Caverns located near Hardisty, Alberta, a key crude oil pipeline hub in western Canada and the Southern Access Extension (SAX) pipeline which originates in Flanagan, Illinois and delivers to Patoka, Illinois. We have an effective 65% interest in the 300 kbpd SAX pipeline of which the majority of its capacity is commercially secured under long-term take-or-pay contracts with shippers.
Feeder Pipelines and Other also includes Patoka Storage, the Toledo pipeline system and the Norman Wells (NW) System. Patoka Storage is comprised of four storage tanks with 480 thousand barrels of shell capacity located in Patoka, Illinois. The 101 kbpd Toledo pipeline system connects with the Lakehead System and delivers to Ohio and Michigan. The 45 kbpd NW System transports crude oil from Norman Wells in the Northwest Territories to Zama, Alberta and has a cost-of-service rate structure based on established terms with shippers.
COMPETITION
Other competing carriers available to ship western Canadian liquid hydrocarbons to markets in Canada, the US and internationally represent competition to our liquids pipelines network. Competition amongst existing pipelines is based primarily on the cost of transportation, access to supply, the quality and reliability of service, contract carrier alternatives and proximity to markets.
Competition also arises from proposed pipeline expansions that provide access to markets currently served by our liquids pipelines, as well as from proposed projects enhancing infrastructure in the Alberta regional oil sands market. The Mid-Continent and Bakken systems also face competition from existing pipelines, proposed future pipelines and existing and alternative gathering facilities. Competition for storage facilities in the US includes large integrated oil companies and other midstream energy partnerships. Additionally, volatile crude price differentials and insufficient pipeline capacity on either our or competitors' pipelines can make transportation of crude oil by rail competitive, particularly to markets not currently served by pipelines.
We believe that our liquids pipelines continue to provide attractive options to producers in the Western Canadian Sedimentary Basin (WCSB) and North Dakota due to our competitive tolls and flexibility through our multiple delivery and storage points. We also employ long-term agreements with shippers, which mitigates competition risk by ensuring consistent supply to our liquids pipelines network. Our current complement of growth projects to expand market access and to enhance capacity on our pipeline system are expected to provide shippers reliable and long-term competitive solutions for liquids transportation. We have a proven track record of successfully executing projects to meet the needs of our customers and our existing right-of-way for the Mainline System also provides a competitive advantage as it can be difficult and costly to obtain rights-of-way for new pipelines traversing new areas. In addition, we are currently pursuing the offering of contracted service on the Mainline System, which would further contribute to mitigating competition risk.
SUPPLY AND DEMAND
We have an established and successful history of being the largest transporter of crude oil to the US, the world’s largest market for crude oil. While US demand for Canadian crude oil production will support the use of our infrastructure for the foreseeable future, North American and global crude oil supply and demand fundamentals are shifting, and we have a role to play in this transition by developing long-term transportation options that enable the efficient flow of crude oil from supply regions to end-user markets.
The COVID-19 pandemic had a significant impact on the crude oil market in 2020. International prices weakened as lockdowns led to a reduction in energy consumption, lower refinery utilization and a glut in supply. The Organization of Petroleum Exporting Countries (OPEC), along with producers around the world, cut crude oil production to stabilize international prices and inventories. WCSB production substantially recovered in the second half of the year as refinery demand has picked up and the Alberta production curtailment program has ended.
17
Our Mainline System throughput, as measured at the Canada/US border at Gretna, Manitoba saw deliveries of 2.44 million bpd in the second quarter of 2020, a 400 kbpd drop from the previous quarter. Volumes improved in the third quarter to 2.55 million bpd and in the fourth quarter to 2.65 million bpd driven by improved refinery utilization in the US and Canada. The Mainline System also returned to apportionment in the fourth quarter, as heavy crude oil shipment nominations exceeded capacity on portions of the system. Lower supply of heavy crude from Latin America and the Middle East is driving increased demand for Canadian heavy crude in the US Gulf Coast even as refinery utilization remained below pre-pandemic levels.
The impact of the COVID-19 pandemic on the financial performance of our Liquids Pipelines business continues to be modest given the cost effectiveness of our Mainline System tolls and commercial arrangements, which underpin many of our pipelines. These arrangements provide a significant measure of protection against volume fluctuations. Our Mainline System is well positioned to continue to provide safe and efficient transportation which will enable western Canadian and Bakken production to reach attractive markets in the US and eastern Canada at a competitive cost.
Over the long term, continued growth in global energy consumption is expected to be primarily driven by emerging economies in regions outside the Organization for Economic Cooperation and Development (OECD), mainly in India and China. In North America, demand growth for transportation fuels is expected to moderate due to vehicle fuel efficiencies and increasing sales of electric vehicles. Accordingly, there is a strategic opportunity to establish tide-water export facilities to service North American producers wanting access to global markets.
Global crude oil production is expected to continue to grow through 2035 to meet this increase in global demand. This supply will primarily come from OPEC countries and North America. Growth in supply from OPEC is partly due to the expected recovery of Iraqi and Libyan production. Saudi Arabia also has the capacity to increase production as necessary. The pace of growth in North America will be governed by a number of factors including crude oil prices, corresponding production decisions by OPEC, increasing environmental regulation, sufficient pipeline egress and prolonged approval processes for new pipelines with access to the US Gulf Coast and tide-water. Recent forecasts continue to show long-term supply growth from the WCSB, however the projected pace of growth is slower than previous forecasts as a result of the evolving factors noted above.
In the near term, Canadian pipeline export capacity is expected to remain fully utilized, resulting in continued apportionment on our Mainline System and incremental production utilizing non-pipeline transportation services (e.g. rail and trucks) until such time as sufficient pipeline capacity is made available. Over the longer term, however, it will be important to develop additional WCSB pipeline egress alternatives as we believe pipelines will continue to be the most reliable, safe and cost-effective means of transportation.
We help alleviate price discounts for producers and rising supply costs to refiners through optimization of throughput on our existing liquids pipelines systems and through investment in new pipelines and related infrastructure to provide expanded transportation capacity and sustainable connectivity to alternative markets. Progress on the development and construction of our commercially secured growth projects is discussed in Part II. Item 7. Management's Discussion and Analysis of Financial Condition and Results of Operations - Growth Projects - Commercially Secured Projects.
18
GAS TRANSMISSION AND MIDSTREAM
Gas Transmission and Midstream consists of our investments in natural gas pipelines and gathering and processing facilities in Canada and the US, including US Gas Transmission, Canadian Gas Transmission, US Midstream and other assets.

19
US GAS TRANSMISSION
US Gas Transmission includes ownership interests in Texas Eastern Transmission, L.P. (Texas Eastern), Algonquin Gas Transmission, LLC (Algonquin), Maritimes & Northeast (M&N) (US and Canada), East Tennessee Natural Gas, LLC (East Tennessee), Gulfstream Natural Gas System, L.L.C. (Gulfstream), Sabal Trail Transmission (Sabal Trail), NEXUS Gas Transmission Pipeline (NEXUS), Valley Crossing Pipeline, LLC. (Valley Crossing), Southeast Supply Header (SESH), Vector Pipeline L.P. (Vector) and certain other gas pipeline and storage assets. The US Gas Transmission business primarily provides transmission and storage of natural gas through interstate pipeline systems for customers in various regions of the northeastern, southern and midwestern US.
The Texas Eastern natural gas transmission system extends from producing fields in the Gulf Coast region of Texas and Louisiana to Ohio, Pennsylvania, New Jersey and New York. Texas Eastern's onshore system has a peak day capacity of 13.06 billion cubic feet per day (bcf/d) of natural gas on approximately 14,183-kilometers (8,813-miles) of pipeline and associated compressor stations. Texas Eastern is also connected to four affiliated storage facilities that are partially or wholly-owned by other entities within the US Gas Transmission business.
The Algonquin natural gas transmission system connects with Texas Eastern’s facilities in New Jersey and extends through New Jersey, New York, Connecticut, Rhode Island and Massachusetts where it connects to M&N US. The system has a peak day capacity of 3.09 bcf/d of natural gas on approximately 1,820-kilometers (1,131-miles) of pipeline with associated compressor stations. We have a 92% interest in the Algonquin natural gas transmission system.
M&N US has a peak day capacity of 0.83 bcf/d of natural gas on approximately 552-kilometers (343-miles) of mainline interstate natural gas transmission system, including associated compressor stations, which extends from northeastern Massachusetts to the border of Canada near Baileyville, Maine. M&N Canada has a peak day capacity 0.55 bcf/d on approximately 885-kilometers (550-miles) of interprovincial natural gas transmission mainline system that extends from Goldboro, Nova Scotia to the US border near Baileyville, Maine. We have a 78% interest in M&N US and M&N Canada.
East Tennessee’s natural gas transmission system has a peak day capacity of 1.86 bcf/d of natural gas, crosses Texas Eastern’s system at two locations in Tennessee and consists of two mainline systems totaling approximately 2,456-kilometers (1,526-miles) of pipeline in Tennessee, Georgia, North Carolina and Virginia, with associated compressor stations. East Tennessee has a liquefied natural gas (LNG) storage facility in Tennessee and also connects to the Saltville storage facilities in Virginia.
Gulfstream is an approximately 1,199-kilometer (745-mile) interstate natural gas transmission system with associated compressor stations. Gulfstream has a peak day capacity of 1.31 bcf/d of natural gas from Mississippi, Alabama, Louisiana and Texas, crossing the Gulf of Mexico to markets in central and southern Florida. We have a 50% interest in Gulfstream.
Sabal Trail is an approximately 832-kilometer (517-mile) pipeline that provides firm natural gas transportation. Facilities include a pipeline, laterals and various compressor stations. The pipeline infrastructure is located in Alabama, Georgia and Florida, and adds approximately 1.0 bcf/d of capacity enabling the access of onshore shale gas supplies once approved future expansions are completed. We have a 50% interest in Sabal Trail.
NEXUS is an approximately 414-kilometer (257-mile) interstate natural gas transmission system with associated compressor stations. NEXUS transports natural gas from our Texas Eastern system in Ohio to our Vector interstate pipeline in Michigan, with peak day capacity of 1.4 bcf/d. Through its interconnect with Vector, NEXUS provides a connection to Dawn Hub, the largest integrated underground storage facility in Canada and one of the largest in North America, located in southwestern Ontario adjacent to the Greater Toronto Area. We have a 50% interest in NEXUS.
20
Valley Crossing is an approximately 285-kilometer (177-mile) intrastate natural gas transmission system, with associated compressor stations. The pipeline infrastructure is located in Texas and provides market access of up to 2.6 bcf/d of design capacity to the Comisión Federal de Electricidad, Mexico’s state-owned utility.
SESH is an approximately 467-kilometer (290-mile) natural gas transmission system with associated compressor stations. SESH extends from the Perryville Hub in northeastern Louisiana where the shale gas production of eastern Texas, northern Louisiana and Arkansas, along with conventional production, is reached from six major interconnections. SESH extends to Alabama, interconnecting with 14 major north-south pipelines and three high-deliverability storage facilities and has a peak day capacity of 1.1 bcf/d of natural gas. We have a 50% interest in SESH.
Vector is an approximately 560-kilometer (348-mile) pipeline travelling between Joliet, Illinois in the Chicago area and Ontario. Vector can deliver 1.745 bcf/d of natural gas, of which 455 million cubic feet per day (mmcf/d) is leased to NEXUS. We have a 60% interest in Vector.
Transmission and storage services are generally provided under firm agreements where customers reserve capacity in pipelines and storage facilities. The vast majority of these agreements provide for fixed reservation charges that are paid monthly regardless of the actual volumes transported on the pipelines, plus a small variable component that is based on volumes transported, injected or withdrawn, which is intended to recover variable costs.
Interruptible transmission and storage services are also available where customers can use capacity if it exists at the time of the request and are generally at a higher toll than long-term contracted rates. Interruptible revenues depend on the amount of volumes transported or stored and the associated rates for this service. Storage operations also provide a variety of other value-added services including natural gas parking, loaning and balancing services to meet customers’ needs.
CANADIAN GAS TRANSMISSION
Canadian Gas Transmission is comprised of Westcoast Energy Inc.’s (Westcoast) British Columbia (BC) Pipeline, Alliance Pipeline and other minor midstream gas gathering pipelines.
BC Pipeline has a peak day capacity of 2.9 bcf/d of natural gas on approximately 2,900-kilometers (1,800-miles) of transmission pipeline in British Columbia and Alberta that includes associated mainline compressor stations. It provides cost-of-service based natural gas transmission services.
Alliance Pipeline is an approximately 3,000-kilometer (1,864-mile) integrated, high-pressure natural gas transmission pipeline with approximately 860-kilometers (534-miles) of lateral pipelines and related infrastructure. It transports liquids-rich natural gas from northeast BC, northwest Alberta and the Bakken area in North Dakota to the Alliance Chicago gas exchange hub downstream of the Aux Sable NGL extraction and fractionation plant at Channahon, Illinois. The system has a peak day capacity of 1.8 bcf/d of natural gas. We have a 50% interest in Alliance Pipeline.
The majority of transportation services provided by Canadian Gas Transmission are under firm agreements, which provide for fixed reservation charges that are paid monthly regardless of actual volumes transported on the pipeline, plus a small variable component that is based on volumes transported to recover variable costs. Canadian Gas Transmission also provides interruptible transmission services where customers can use capacity if it is available at the time of request. Payments under these services are based on volumes transported.
21
US MIDSTREAM
US Midstream includes a 42.7% interest in each of Aux Sable Liquid Products LP and Aux Sable Midstream LLC, and a 50% interest in Aux Sable Canada LP (collectively, Aux Sable). Aux Sable Liquid Products LP owns and operates an NGL extraction and fractionation plant at Channahon, Illinois, outside Chicago, near the terminus of Alliance Pipeline. Aux Sable also owns facilities connected to Alliance Pipeline that facilitate delivery of liquids-rich natural gas for processing at the Aux Sable plant. These facilities include the Palermo Conditioning Plant and the Prairie Rose Pipeline in the Bakken area of North Dakota, owned and operated by Aux Sable Midstream US; and Aux Sable Canada’s interests in the Montney area of BC, comprising the Septimus Pipeline. Aux Sable Canada also owns a facility which processes refinery/upgrader offgas in Fort Saskatchewan, Alberta.
US Midstream also includes a 50% investment in DCP Midstream, LLC (DCP Midstream), which indirectly owns approximately 57% of DCP Midstream, LP, including limited partner and general partner interests. DCP Midstream, LP is a master limited partnership, with a diversified portfolio of assets, engaged in the business of gathering, compressing, treating, processing, transporting, storing and selling natural gas; producing, fractionating, transporting, storing and selling NGLs; and recovering and selling condensate. DCP Midstream, LP owns and operates more than 39 plants and approximately 92,135-kilometers (57,250-miles) of natural gas and natural gas liquids pipelines, with operations in nine states across major producing regions.
OTHER
Other consists primarily of our offshore assets. Enbridge Offshore Pipelines is comprised of 11 natural gas gathering and FERC regulated transmission pipelines and four oil pipelines. These pipelines are located in four major corridors in the Gulf of Mexico, extending to deepwater developments, and include almost 2,100-kilometers (1,300-miles) of underwater pipe and onshore facilities with total capacity of approximately 6.5 bcf/d.
COMPETITION
Our natural gas transmission and storage businesses compete with similar facilities that serve our supply and market areas in the transmission and storage of natural gas. The flow pattern of natural gas is changing across North America due to emerging supply sources and evolving demand centers, which creates competition for growth opportunities. The principal elements of competition are location, rates, terms of service, flexibility and reliability of service.
The natural gas transported in our business competes with other forms of energy available to our customers and end-users, including electricity, coal, propane, fuel oils, nuclear and renewable energy. Factors that influence the demand for natural gas include price changes, the availability of natural gas and other forms of energy, levels of business activity, long-term economic conditions, conservation, legislation, governmental regulations, the ability to convert to alternative fuels, weather and other factors.
Competition exists in all markets that our businesses serve. Competitors include interstate/interprovincial and intrastate/intraprovincial pipelines or their affiliates and other midstream businesses that transport, gather, treat, process and market natural gas or NGLs. Because pipelines are generally the most efficient mode of transportation for natural gas over land, the most significant competitors of our natural gas pipelines are other pipeline companies.
SUPPLY AND DEMAND
Our gas transmission assets make up one of the largest natural gas transportation networks in North America, driving connectivity between prolific supply basins and major demand centers within the continent. Our systems have been integral to the transition in natural gas fundamentals over the last decade and will continue to play a part as the energy landscape evolves. Shifts in production and consumption, both domestic and foreign, will require that we continue to serve as a critical link between markets.
22
In 2010, natural gas production in each of the Appalachian and Permian basins were less than 5.0 bcf/d each. Today, these regions produce more than 43.0 bcf/d of natural gas on a combined basis. Improved technology and increased shale gas drilling have increased the supply of low-cost natural gas. As well, there has been and continues to be a corresponding increase in demand for our natural gas infrastructure in North America. Through a series of expansions and reversals on our core systems, combined with the execution of greenfield projects and strategic acquisitions, we have been able to meet the needs of producers and consumers alike. Our US Gas Transmission systems were initially designed to transport natural gas from the Gulf Coast to the supply starved northeast markets. Our asset base now has the capability to transport diverse bi-directional supply to the northeast, southeast, midwest, Gulf Coast and LNG markets on a fully subscribed and highly utilized basis.
The northeast market continues its role as a predominantly supply constrained region with steady demand into 2040. The bi-directional capabilities offered by our US Gas Transmission system allows us to deliver in an efficient manner to our regional customers. The region has seen an increase in natural gas supply due to the development of the Marcellus and Utica shales in the Appalachia region.
The southeast market is linked to multiple, highly liquid supply pools that include the Marcellus and Utica shale developments, offering consistent supply and stable pricing to a growing population of end-use customers across our multiple systems under long term, utility-like arrangements.
With connectivity to Appalachian and western Canadian supply through our systems, the midwest market has access to two of the lowest cost gas producing regions on the continent. As demand in the region is expected to continue to grow by approximately 2.3 bcf/d over the next two decades, maintaining this link will remain important. Flexibility in supply for this market is especially critical to maintaining liquidity and price stability as natural gas continues to replace coal-fired generation.
Gulf Coast demand growth is being driven by an ongoing wave of gas-intensive petrochemical facilities, along with power generation, an increase in the volume of LNG exports and additional pipeline exports to Mexico. Demand to these markets in the region is anticipated to grow by more than 23.0 bcf/d through 2040. The Gulf Coast market has been the beneficiary of low cost capacity on our assets as the relationship between supply and market centers has shifted. Such cost-effective capacity is difficult to access or replicate, offering existing shippers and transporters stability of capacity and utilization. Tide-water market access and proximity to Mexico continue to make this region a platform of global trade as pipeline and LNG exports continue their growth trajectory. The US exported over 9 bcf/d of natural gas to LNG markets, primarily from the Gulf Coast region, at the end of 2020.
Despite there being strong growth in both supply and demand in the US, a lack of adequate transportation capacity has placed downward pressure on local natural gas pricing. The Appalachian Basin has seen price differentials of $1.00 to $2.00 per million British Thermal Units relative to Henry Hub in the Gulf Coast over the last few years. Unlike the dry gas production of the Marcellus, natural gas production growth in the Permian Basin is a result of robust crude oil production taking place in the region. Gas supplies from the region remained above prior year levels on average throughout 2020.
Western Canada, not unlike other supply hubs, is a source of low-cost supply seeking access to premium markets in North America and globally. One of the few vital links to demand centers in the pacific northwest are our own systems in the region, which are highly utilized.
23
Global energy demand is expected to increase approximately 23% by 2040, according to the International Energy Agency, driven primarily by economic growth in non-OECD countries. Natural gas will play an important role in meeting this energy demand as gas consumption is anticipated to grow by approximately 30% during this period as one of the world’s fastest growing energy sources. North American exports will play a significant part in meeting global demand, underscoring the ability of our assets to remain highly utilized by shippers, and highlighting the need for incremental transportation solutions across North America. In response to these global fundamentals, we believe we are well positioned to provide value-added solutions to shippers. We are responding to the need for regional infrastructure with additional investments in Canadian and US gas transportation facilities. Progress on the development and construction of our commercially secured growth projects is discussed in Part II. Item 7. Management’s Discussion and Analysis of Financial Condition and Results of Operations - Growth Projects - Commercially Secured Projects.
GAS DISTRIBUTION AND STORAGE
Gas Distribution and Storage consists of our natural gas utility operations, the core of which is Enbridge Gas Inc. (Enbridge Gas), which serves residential, commercial and industrial customers throughout Ontario. This business segment also includes natural gas distribution activities in Québec and an investment in Noverco Inc. (Noverco).

ENBRIDGE GAS
Enbridge Gas is a rate-regulated natural gas distribution utility with storage and transmission services that have been in operation for 172 years. Enbridge Gas serves approximately 75% of Ontario residents via approximately 3.8 million residential, commercial and industrial meter connections.
There are three principal interrelated aspects of the natural gas distribution business in which Enbridge Gas is directly involved: Distribution, Transportation and Storage.
24
Distribution
Enbridge Gas’ principal source of revenue arises from distribution of natural gas to customers. The services provided to residential, small commercial and industrial heating customers are primarily on a general service basis, without a specific fixed term or fixed price contract. The services provided to larger commercial and industrial customers are usually on an annual contract basis under firm or interruptible service contracts. Under a firm contract, Enbridge Gas is obligated to deliver natural gas to the customer up to a maximum daily volume. The service provided under an interruptible contract is similar to that of a firm contract, except that it allows for service interruption at Enbridge Gas’ option primarily to meet seasonal or peak demands. The Ontario Energy Board (OEB) approves rates for both contract and general services. The distribution system consists of approximately 146,000-kilometers (90,720-miles) of pipelines that carry natural gas from the point of local supply to customers.
Customers have a choice with respect to natural gas supply. Customers may purchase and deliver their own natural gas to points upstream of the distribution system or directly into Enbridge Gas’ distribution system, or, alternatively, they may choose a system supply option, whereby customers purchase natural gas from Enbridge Gas’ supply portfolio. To acquire the necessary volume of natural gas to serve its customers, Enbridge Gas maintains a diversified natural gas supply portfolio, acquiring supplies on a delivered basis in Ontario, as well as acquiring supply from multiple supply basins across North America.
Transportation
Enbridge Gas contracts for firm transportation service, primarily with TransCanada Pipelines Limited (TransCanada), Vector and NEXUS, to meet its annual natural gas supply requirements. The transportation service contracts are not directly linked with any particular source of natural gas supply. Separating transportation contracts from natural gas supply allows Enbridge Gas flexibility in obtaining its own natural gas supply and accommodating the requests of its direct purchase customers for assignment of TransCanada capacity. Enbridge Gas forecasts the natural gas supply needs of its customers, including the associated transportation and storage requirements.
In addition to contracting for transportation service, Enbridge Gas offers firm and interruptible transportation services on its own Dawn-Parkway pipeline system. Enbridge Gas’ transmission system consists of approximately 5,500-kilometers (3,418-miles) of high-pressure pipeline and five mainline compressor stations and has an effective peak daily demand capacity of 7.6 bcf/d. Enbridge Gas’ transmission system also links an extensive network of underground storage pools at the Tecumseh Gas Storage facility and Dawn Hub (collectively, Dawn) to major Canadian and US markets, and forms an important link in moving natural gas from western Canada and US supply basins to central Canadian and northeastern US markets.
As the supply of natural gas in areas close to Ontario continues to grow, there is an increased demand to access these diverse supplies at Dawn and transport them along the Dawn-Parkway pipeline system to markets in Ontario, eastern Canada and the northeastern US. Enbridge Gas delivered 1,793 bcf of gas through its distribution and transmission system in 2020. A substantial amount of Enbridge Gas’ transportation revenue is generated by fixed annual demand charges, with the average length of a long-term contract being approximately 13.5 years and the longest remaining contract term being 22 years.
Storage
Enbridge Gas’ business is highly seasonal as daily market demand for natural gas fluctuates with changes in weather, with peak consumption occurring in the winter months. Utilization of storage facilities permits Enbridge Gas to take delivery of natural gas on favorable terms during off-peak summer periods for subsequent use during the winter heating season. This practice permits Enbridge Gas to minimize the annual cost of transportation of natural gas from its supply basins, assists in reducing its overall cost of natural gas supply and adds a measure of security in the event of any short-term interruption of transportation of natural gas to Enbridge Gas’ franchise areas.
25
Enbridge Gas’ storage facility at Dawn is located in southwestern Ontario, and has a total working capacity of approximately 276 bcf in 34 underground facilities located in depleted gas fields. Dawn is the largest integrated underground storage facility in Canada and one of the largest in North America. Approximately 180 bcf of the total working capacity is available to Enbridge Gas for utility operations. Enbridge Gas also has storage contracts with third parties for 21 bcf of storage capacity.
Dawn offers customers an important link in the movement of natural gas from western Canadian and US supply basins to markets in central Canada and the northeast US. Dawn's configuration provides flexibility for injections, withdrawals and cycling. Customers can purchase both firm and interruptible storage services at Dawn. Dawn offers customers a wide range of market choices and options with easy access to upstream and downstream markets. During 2020, Dawn provided services such as storage, balancing, gas loans, transport, exchange and peaking services to over 200 counterparties.
A substantial amount of Enbridge Gas’ storage revenue is generated by fixed annual demand charges, with the average length of a long-term contract being approximately four years and the longest remaining contract term being 16 years.
NOVERCO
Noverco is a holding company that wholly-owns Énergir, LP (Énergir), formerly known as Gaz Metro Limited Partnership, a natural gas distribution company operating in Quebec, with interests in subsidiary companies operating gas transmission, gas distribution and power distribution businesses in Québec and Vermont. Énergir serves approximately 525,000 residential and industrial customers and is regulated by the Québec Régie de l’énergie and the Vermont Public Utility Commission. Noverco also holds an investment in our common shares. We own an equity interest in Noverco through ownership of 38.9% of its common shares and an investment in its preferred shares.
GAZIFÈRE
We wholly own Gazifère, a natural gas distribution company that serves approximately 43,000 customers in western Québec, a market not served by Énergir. Gazifère is regulated by the Québec Régie de l’énergie.
COMPETITION
Enbridge Gas’ distribution system is regulated by the OEB and is subject to regulation in a number of areas, including rates. Enbridge Gas is not generally subject to third-party competition within its distribution franchise areas.
Enbridge Gas competes with other forms of energy available to its customers and end-users, including electricity, coal, propane and fuel oils. Factors that influence the demand for natural gas include weather, price changes, the availability of natural gas and other forms of energy, the level of business activity, conservation, legislation, governmental regulations, the ability to convert to alternative fuels and other factors.
SUPPLY AND DEMAND
We expect that demand for natural gas in North America will continue to see low annual growth over the long term with continued growth in peak day demands. We expect demand for natural gas connections in Ontario to continue to grow due to continued population growth. Some modest growth driven by low natural gas prices is expected to continue given the significant price advantage relative to alternate energy options, even with increasing carbon charges, with specific interest coming from communities that are not currently serviced by natural gas. Enbridge Gas continues to focus on promoting conservation and energy efficiency by undertaking activities focused on reducing natural gas consumption through various demand side management programs offered across all markets.
26
The storage and transportation marketplace continues to respond to changing natural gas supply dynamics including a robust supply environment. In recent years, the robust North American gas supply balance, due mainly to the development of unconventional gas volumes including the Alberta, British Columbia, Marcellus and Utica supply basins, has resulted in lower commodity prices and narrower seasonal price spreads. Unregulated storage values are primarily determined based on the difference in value between winter and summer natural gas prices. Storage values have been relatively stable to slightly rising as the North American natural gas supply and demand slowly returned to a more balanced position.
27
RENEWABLE POWER GENERATION
Renewable Power Generation consists primarily of investments in wind and solar assets, as well as geothermal, waste heat recovery, and transmission assets. In North America, assets are primarily located in the provinces of Alberta, Saskatchewan, Ontario, and Québec and in the states of Colorado, Texas, Indiana and West Virginia. In Europe, we hold equity interests in operating offshore wind facilities in the coastal waters of the United Kingdom and Germany, as well as in several projects under construction and active development in France. Further, we are pursuing new European development opportunities through Maple Power Ltd., a joint venture in which we hold a 50% interest.

28
Combined Renewable Power Generation investments represent approximately 1,977 MW of net generation capacity. Of this amount, approximately:
•1,392 MW is generated by North American wind facilities;
•255 MW is generated by European offshore wind facilities;
•211 MW will be generated by the Saint-Nazaire and Fécamp Offshore Wind projects, both of which are currently under construction; and
•80 MW is generated by North American solar facilities in operation, with an additional 13 MW in projects under construction.
The vast majority of the power produced from these facilities is sold under long-term Power Purchase Agreements (PPAs).
Renewable Power Generation also includes the East-West Tie, a 450-MW transmission line in northwestern Ontario, which is currently under construction and is expected to reach commercial operation in the first half of 2022. In May 2020, we sold the Montana-Alberta Tie-Line (MATL), a 300-MW transmission line running from Great Falls, Montana to Lethbridge, Alberta. For further information refer to Part II. Item 8. Financial Statements and Supplementary Data - Note 8. Dispositions.
JOINT VENTURES / EQUITY INVESTMENTS
The investments in the Canadian renewable assets and two of the US renewable assets are held within a joint venture in which we maintain a 51% interest and continue to manage, operate, and provide administrative support.
We also own interests in European offshore wind facilities through the following joint ventures:
•a 24.9% interest in Rampion Offshore Wind, located in the United Kingdom, which went into service April 2018;
•a 25% interest in Hohe See Offshore and its subsequent expansion, located in Germany, which went into service October 2019 and January 2020, respectively;
•a 25.5% interest in the Saint-Nazaire Offshore Wind project, located in France, which is currently under construction; and
•a 17.9% interest in the Fécamp Offshore Wind project, under construction in France.
The ownership interest percentages in the Saint-Nazaire and Fécamp Offshore Wind projects reflect the sale of 49% of an entity that holds our 50% interest in Éolien Maritime France SAS (EMF) to the Canada Pension Plan Investment Board (CPP Investments) which is expected to close in the first half of 2021.
COMPETITION
Our Renewable Power Generation assets operate in the North American and European power markets, which are subject to competition and supply and demand fundamentals for power in the jurisdictions in which they operate. The majority of revenue is generated pursuant to long-term PPAs or has been substantially hedged. As such, the financial performance is not significantly impacted by fluctuating power prices arising from supply/demand imbalances or the actions of competing facilities during the term of the applicable contracts. However, the renewable energy sector includes large utilities, small independent power producers and private equity investors, which are expected to aggressively compete for new project development opportunities and for the right to supply customers when contracts expire.
To grow in an environment of heightened competition, we strategically seek opportunities to collaborate with well-established renewable power developers and financial partners and to target regions with commercial constructs consistent with our low risk business model. In addition, we bring to bear the expertise of completing and delivering large scale infrastructure projects.
29
SUPPLY AND DEMAND
The renewable power generation network in North America and Europe is expected to grow significantly over the next 20 years due to the replacement of older fossil fuel-based sources of electricity generation in support of announced governmental carbon emissions reduction targets. Any additional governmental actions toward reducing emissions and/or increasing electrification will further accelerate renewable electricity demand growth and electrification across all sectors.
On the demand side, North American economic growth over the longer term and the continued electrification and decarbonization of the residential, transportation and industrial sectors are expected to drive growing electricity demand. However, continued efficiency gains are expected to make the economy less energy-intensive and temper overall demand growth.
On the supply side in North America, legislation is accelerating the retirement of aging coal-fired generation, while generation from nuclear power is also forecast to decline. As a result, North America requires significant new generation capacity and the extension of project lives and/or PPAs of preferred technologies. Gas-fired and renewable energy facilities, including solar and wind (which make up the bulk of our renewable power assets), are generally the preferred sources to replace coal-fired generation due to their low carbon intensities.
The falling capital and operating costs of wind and solar, combined with their continuously improving capacity factors, are expected to continue the ongoing trend of making renewable energy more competitive and support investment over the long-term, regardless of available government incentives. Generation from renewable sources is expected to double over the next two decades in North America. Aside from the construction of new wind and solar facilities, other growth opportunities include repowering projects to increase output from, and extending the project-life of, our existing facilities.
In Europe, the renewable energy outlook is robust. Demand for electricity is expected to gradually increase over the next two decades, driven by electrification of transportation and buildings. Energy efficiency gains will temper, but not eliminate, demand growth. Renewable power will play a significant role in Britain and the European Union’s ability to meet their aggressive low-carbon and renewable energy targets, particularly wind and offshore wind.
On the supply side, the International Energy Agency expects coal to fall by more than 90%, while nuclear falls by one-third, by 2040. Over the same period, it anticipates power generation from renewable sources will more than double, including installed (onshore and offshore) wind more than doubling and photovoltaics solar power nearly tripling. We, through our European joint ventures, continue to invest in offshore wind projects in the United Kingdom, France and Germany to meet the growing demand.
ENERGY SERVICES
The Energy Services businesses in Canada and the US provide physical commodity marketing and logistical services to North American refiners, producers, and other customers.
Energy Services is primarily focused on servicing customers across the value chain and capturing value from quality, time, and location price differentials when opportunities arise. To execute these strategies, Energy Services transports and stores on both Enbridge-owned and third party assets using a combination of contracted long-term and short-term pipeline, storage tank, railcar, and truck capacity agreements.
30
COMPETITION
Energy Services’ earnings are primarily generated from arbitrage opportunities which, by their nature, can be replicated by competitors. An increase in market participants entering into similar arbitrage strategies could have an impact on our earnings. Efforts to mitigate competition risk include diversification of the marketing business by transacting at the majority of major hubs in North America and establishing long-term relationships with clients and pipelines.
ELIMINATIONS AND OTHER
Eliminations and Other includes operating and administrative costs that are not allocated to business segments and the impact of foreign exchange hedge settlements. Eliminations and Other also includes new business development activities and corporate investments.
OPERATIONAL, ENVIRONMENTAL AND ECONOMIC REGULATION
LIQUIDS PIPELINES
Operational Regulation
We are subject to numerous operational rules and regulations mandated by governments or applicable regulatory authorities, breaches of which could result in fines, penalties, operating restrictions and an overall increase in operating and compliance costs.
In the US, our interstate pipeline operations are subject to pipeline safety laws and regulations administered by the Pipeline and Hazardous Materials Safety Administration (PHMSA), an agency within the of the United States Department of Transportation (DOT). These laws and regulations require us to comply with a significant set of requirements for the design, construction, maintenance and operation of our interstate pipelines. These laws and regulations, among other things, include requirements to monitor and maintain the integrity of our pipelines and to operate them at permissible pressures.
PHMSA has revised existing regulations and promulgated new regulations establishing safety standards that are designed to improve and expand integrity management processes. There remains uncertainty as to how these standards will be implemented, but it is expected that the changes will impose additional costs on new pipeline projects as well as on existing operations. In this climate of increasingly stringent regulation, pipeline failure or failures to comply with applicable regulations could result in reduction of allowable operating pressures as authorized by PHMSA, which would reduce available capacity on our pipelines. Should any of these risks materialize, it may have an adverse effect on our operations, earnings, cash flows and financial condition.
In Canada, our pipeline operations are subject to pipeline safety regulations administered by the CER or provincial regulators. Applicable legislation and regulations require us to comply with a significant set of requirements for the design, construction, maintenance and operation of our pipelines. Among other obligations, this regulatory framework imposes requirements to monitor and maintain the integrity of our pipelines.
As in the US, several legislative changes addressing pipeline safety in Canada have recently been enacted. The changes evidence an increased focus on the implementation of management systems to address key areas such as emergency management, integrity management, safety, security and environmental protection. Other legislative changes have created authority for the CER to impose administrative monetary penalties for non-compliance with the regulatory regime it administers, as well as to impose financial requirements for future abandonment and major pipeline releases.
31
A key component of Liquids Pipelines safety and reliability is the approach to integrity management that uses reliability targets and safety case assessments. A long history of extensive inline inspection has provided detailed knowledge of the assets in the liquids pipeline system. Every segment of every pipeline is assessed and maintained, in a proactive manner, such that the probability of a leak is sufficiently low and that stringent reliability targets are met. Furthermore, the integrity management program has an independent step to check the results of our integrity assessments to validate the effectiveness of the program and to ensure that that the operational risk remains as low as reasonably practicable throughout the integrity inspection and assessment cycle. As inspection technology, pipeline materials and construction practices improve with time, and new data on threats and pipeline condition are gathered, our methods of maintaining fitness for service evolves; with a strong focus on continual improvement in every aspect of integrity management.
Environmental Regulation
We are also subject to numerous federal, state and provincial environmental laws and regulations affecting many aspects of our present and future operations, including air emissions, water quality, wastewater discharges, solid waste and hazardous waste. These laws and regulations generally require us to obtain and comply with a wide variety of environmental licenses, permits and other approvals.
In particular, in the US, compliance with major Clean Air Act regulatory programs is likely to cause us to incur significant capital expenditures to obtain permits, evaluate off-site impacts of our operations, install pollution control equipment, and otherwise assure compliance. Some states in which we operate are implementing new emissions limits to comply with 2008 ozone standards regulated under the National Ambient Air Quality Standards. In 2015, the ozone standards were lowered even further from 75 parts per billion (ppb) to 70 ppb, which may require states to implement additional emissions regulations. The precise nature of these compliance obligations at each of our facilities has not been finally determined and may depend in part on future regulatory changes. In addition, compliance with new and emerging environmental regulatory programs may significantly increase our operating costs compared to historical levels.
In the US, climate change action is evolving at federal, state and regional levels. The Supreme Court decision in Massachusetts v. Environmental Protection Agency in 2007 established that GHG emissions were pollutants subject to regulation under the Clean Air Act. Pursuant to federal regulations, we are currently subject to an obligation to report our GHG emissions at our largest emitting facilities, but are not generally subject to limits on emissions of GHGs. The new US presidential administration has also announced that policies designed to combat climate change and reduce GHG emissions will be a key legislative and regulatory priority, and thus stricter emissions limits and air quality enforcement actions are possible In addition, a number of states have joined regional GHG initiatives, and a number are developing their own programs that would mandate reductions in GHG emissions. Public interest groups and regulatory agencies are increasingly focusing on the emission of methane associated with natural gas development and transmission as a source of GHG emissions. However, as the key details of future GHG restrictions and compliance mechanisms remain undefined, the likely future effects on our business are highly uncertain.
For its part, Canada has reaffirmed its strong preference for a harmonized approach with that of the US. In 2019, the Government of Canada implemented a federal system of carbon pricing. The pricing applies to provinces and territories that do not have a carbon pricing system in place that meets the federal benchmark. On November 19, 2020, the federal Minister of Environment and Climate Change introduced Bill C-12, the Canadian Net-Zero Emissions Accountability Act, which requires national targets for the reduction of GHG emissions in Canada be set, with the objective of attaining net-zero emissions by 2050. In December 2020, the Government of Canada announced plans to increase the federal carbon price by $15 per year, rising to $170 per tonne of carbon dioxide equivalent in 2030.
32
Due to the speculative outlook regarding any US federal and state policies, we cannot estimate the potential effect of proposed GHG policies on our future consolidated results of operations, financial position or cash flows. However, such legislation or regulation could materially increase our operating costs, require material capital expenditures or create additional permitting, which could delay proposed construction projects.
Economic Regulation
Our liquids pipelines also face economic regulation risk. Broadly defined, economic regulation risk is the risk that governments or regulatory agencies change or reject proposed or existing commercial arrangements including permits and regulatory approvals for both new and existing projects, upon which future and current operations are dependent. Our Mainline System and other liquids pipelines are subject to the actions of various regulators, including the CER and FERC, with respect to the tariffs and tolls of those operations. The changing or rejecting of commercial arrangements, including decisions by regulators on the applicable permits and tariff structure or changes in interpretations of existing regulations by courts or regulators, could have an adverse effect on our revenues and earnings.
GAS TRANSMISSION AND MIDSTREAM
Operational Regulation
The span of regulation risks that apply to the Liquids Pipelines business as described above under Liquids Pipelines also applies to the Gas Transmission and Midstream business. Most of our US gas transmission operations are regulated by the FERC. The FERC regulates natural gas transmission in US interstate commerce including the establishment of rates for services. The FERC also regulates the construction of US interstate natural gas pipelines and storage facilities, including the extension, enlargement and abandonment of facilities. In addition, certain operations are subject to oversight by state regulatory commissions. To the extent that the natural gas intrastate pipelines that transport or store natural gas in interstate commerce provide services under Section 311 of the Natural Gas Policy Act of 1978, they are subject to FERC regulations. The FERC may propose and implement new rules and regulations affecting interstate natural gas transmission and storage companies, which remain subject to the FERC’s jurisdiction. These initiatives may also affect certain transmission of gas by intrastate pipelines.
Texas Eastern reached an agreement with its shippers and filed a Stipulation and Agreement with the FERC on October 28, 2019. On February 25, 2020, Texas Eastern received approval from the FERC of its uncontested rate case settlement with customers. In the first quarter of 2020, Texas Eastern recognized revenues from the settled rates retroactive to June 1, 2019, and put the settled rates into effect on April 1, 2020. On July 2, 2020, Algonquin received approval from the FERC of its uncontested rate case settlement with customers. In the third quarter of 2020, Algonquin recognized revenues from the settled rates retroactive to June 1, 2020, and put the settled rates into effect on September 1, 2020. East Tennessee filed a rate case in the second quarter of 2020 and customer settlement discussions commenced in the fourth quarter of 2020. The US portion of Maritimes & Northeast Pipeline filed a rate case in the second quarter of 2020 and an agreement was reached in principle with shippers in December 2020. A Stipulation and Agreement will be filed in February 2021 and we will await FERC approval. The US portion of Alliance Pipeline filed a rate case in the second quarter of 2020 and an agreement was reached in principle with shippers in January 2021. A Stipulation and Agreement will be filed in March 2021 and we will await FERC approval. In July 2020, the 2020-2021 rate settlement agreement with Westcoast's BC Pipeline shippers was approved by the CER. Following approval of the settlement, Westcoast applied and received approval from the CER on August 12, 2020 for the interim tolls to be made final, including the interim tolls from January 1, 2020 to March 31, 2020 as well as the revised interim tolls in effect as at April 1, 2020.
33
Our operations are subject to the jurisdiction of the Environmental Protection Agency and various other federal, state and local environmental agencies. Our US interstate natural gas pipelines and certain of DCP Midstream’s gathering and transmission pipelines are also subject to the regulations of the DOT concerning pipeline safety.
The intrastate natural gas and NGL pipelines owned by us and DCP Midstream are subject to state regulation. DCP Midstream's interstate NGL transportation pipelines are subject to FERC regulation. The natural gas gathering and processing activities of DCP Midstream are not subject to FERC regulation.
Our Canadian operations are governed by various federal and provincial agencies with respect to pipeline safety, including the CER, the Transportation Safety Board and the Ontario Technical Standards and Safety Authority.
Our Canadian natural gas transmission operations are subject to regulation by the CER or the provincial agencies in Canada, such as the OEB. These agencies have jurisdiction similar to the FERC for regulating rates, the terms and conditions of service, the construction of additional facilities and acquisitions. In addition, these assets are subject to GHG emissions regulations, including GHG emissions management and carbon pricing policies. Across Canada there are a variety of new and evolving initiatives in development at the federal and provincial levels aimed at reducing GHG emissions. The Government of Canada has finalized a federal plan to have carbon pricing in place in all Canadian jurisdictions.
GAS DISTRIBUTION AND STORAGE
Operational Regulation
Our gas distribution and storage utility operations are regulated by the OEB and the Québec Régie de l’énergie, among others. To the extent that the regulators’ future actions are different from current expectations, the timing and amount of recovery or refund of amounts recorded on the Consolidated Statements of Financial Position, or amounts that would have been recorded on the Consolidated Statements of Financial Position in absence of the effects of regulation, could be different from the amounts that are eventually recovered or refunded.
Enbridge Gas' distribution rates, commencing in 2019, are set under a five-year incentive regulation (IR) framework using a price cap mechanism. The price cap mechanism establishes new rates each year through an annual base rate escalation at inflation less a 0.3% productivity factor, annual updates for certain costs to be passed through to customers, and where applicable, the recovery of material discrete incremental capital investments beyond those that can be funded through base rates. The IR framework includes the continuation and establishment of certain deferral and variance accounts, as well as an earnings sharing mechanism that requires Enbridge Gas to share equally with customers any earnings in excess of 150 basis points over the annual OEB approved return on equity (ROE).
We seek to mitigate operational regulation risk. We retain dedicated professional staff and maintain strong relationships with customers, intervenors and regulators. This strong regulatory relationship continued in 2020 following OEB Decisions and Orders approving Phase 2 of Enbridge Gas’ application for 2020 rates and Phase 1 of Enbridge Gas’ application for 2021 rates. The Phase 2 Decision and Order approved the recovery of requested 2020 discrete incremental capital investments through the incremental capital module, while the Phase 1 Decision and Order approved 2021 base rate escalation under the price cap mechanism.
34
Enbridge Gas has continued to develop opportunities to support a low carbon future in Ontario. In 2020, the OEB approved Enbridge Gas' application to implement a voluntary RNG pilot program, whereby customers can voluntarily contribute towards the incremental cost of low carbon RNG which would displace regular natural gas. The OEB also approved Enbridge Gas' pilot project to construct facilities that will allow regular natural gas to be blended with hydrogen gas, in an isolated portion of the existing distribution system, with the intent to gain insight into the use of hydrogen as a method for decarbonizing natural gas for the purpose of reducing GHG emissions.
Environmental Regulation
Our workers, operations and facilities are subject to municipal, provincial and federal legislation which regulate the protection of the environment and the health and safety of workers. Environmental legislation primarily includes regulation of discharges to air, land and water; environmental assessment of natural gas infrastructure projects in Ontario; protection of species at risk and species at risk habitat; management and disposal of hazardous waste; the assessment and management of contaminated sites; and the reporting and reduction of GHG emissions.
Gas distribution system operation, as with any industrial operation, has the potential risk of abnormal or emergency conditions, or other unplanned events that could result in leaks or emissions in excess of permitted levels. These events could result in injuries to workers or the public, adverse impacts to the environment in which we operate, property damage or regulatory violations including orders and fines. We could also incur future liability for soil and groundwater contamination associated with past and present site activities.
In addition to gas distribution, we also operate storage facilities and a small amount of oil and brine production in southwestern Ontario. Environmental risk associated with these facilities is the potential for unplanned releases. In the event of a release, remediation of the affected area would be required. There would also be potential for fines, orders or charges under environmental legislation, and potential third-party liability claims by any affected landowners.
The gas distribution system and our other operations must maintain environmental approvals and permits from regulators to operate. As a result, these assets and facilities are subject to periodic inspections and/or audits. Annual reports, such as the Annual Written Summary Report are submitted to the Ontario Ministry of the Environment, Conservation and Parks (MECP) and other regulators to demonstrate we are in good standing with our Environmental Compliance Approvals. Failure to maintain regulatory compliance could result in operational interruptions, fines, and/or orders for additional pollution control technology or environmental mitigation. As environmental requirements and regulations become more stringent, the cost to maintain compliance and the time required to obtain approvals has increased.
As with previous years, in 2020, we reported operational GHG emissions, including emissions from stationary combustion, flaring, venting and fugitive sources to Environment and Climate Change Canada (ECCC), the Ontario MECP, and a number of voluntary reporting programs. In accordance with the provincial GHG regulations, stationary combustion and flaring emissions related to storage and transmission operations were verified in detail by a third-party accredited verifier with no material discrepancies found.
Enbridge Gas utilizes emissions data management processes and systems to help with the data capture and mandatory and voluntary reporting needs. Quantification methodologies and emission factors will continually be updated in the system as required. Enbridge Gas continues to work with industry associations to refine quantification methodologies and emissions factors, as well as best management practices to minimize emissions.
35
In October 2018, the federal government confirmed that Ontario is subject to the federal government’s carbon pricing program, otherwise known as the Federal Carbon Pricing Backstop Program. This program consists of two components: a carbon charge levied on fossil fuels, including natural gas, and an output-based pricing system (OBPS).
The federal carbon charge took effect on April 1, 2019 at a rate of 3.91 cents/cubic meter (m3) of natural gas and is applicable to the majority of customers. Enbridge Gas is registered as a natural gas distributor with the Canada Revenue Agency and remits the federal carbon charge on a monthly basis. The charge increases annually on April 1 of each year by 1.96 cents/m3, rising up to 9.79 cents/m3 in 2022. In December 2020, the federal government announced plans to increase the federal carbon price by $15 per year, rising to $170 per tonne of carbon dioxide equivalent in 2030. Enbridge Gas estimates that this will equate to a federal carbon charge on natural gas of approximately 33.31 cents/m3 in 2030.
The OBPS component came into effect on January 1, 2019. Under OBPS, a registered facility has a compliance obligation for the portion of their emissions that exceeds their annual facility emissions limit, which is calculated based on the sector specific output-based standard and annual production. Enbridge Gas is registered with ECCC as an emitter in the OBPS program and has an annual compliance obligation associated with the combustion and flaring emissions associated with its natural gas pipeline transmission system. As a registered facility under OBPS, Enbridge Gas submitted an annual report along with the required verification report from an accredited third-party verifier who found no material misstatements. Enbridge Gas is required to remit payment for facility emissions that exceed its annual facility emissions limit. Due to COVID-19, ECCC has delayed the payment deadline from December 15, 2020 to April 15, 2021, and therefore Enbridge Gas has deferred payment until the first half of 2021.
In September 2020, Ontario and the federal government announced that the federal government has accepted that Ontario’s Emission Performance Standards (EPS) will replace the federal OBPS for industrial facilities. The date of the transition has not yet been communicated. Enbridge Gas will continue to have a compliance obligation under either the OBPS or EPS program for its facility-related emissions, as well as the federal carbon charge for its customer-related emissions.
HUMAN CAPITAL RESOURCES
WORKFORCE SIZE AND COMPOSITION
As at December 31, 2020, we had approximately 11,200 regular employees, including 1,600 unionized employees across our North American operations. This total rises to more than 13,000 if including temporary employees and contractors. We have a strong preference for direct employment relationships but where we have collectively bargained for employees, we have mature working relationships with our labor unions and the parties have traditionally committed themselves to the achievement of renewal agreements without a work stoppage.
SAFETY
We believe all injuries, incidents and occupational illnesses are preventable. Our overall focus on employee and contractor safety continues to result in strong performance compared against industry benchmarks and we are actively engaged in continuous improvement exercises as we pursue our goal of zero incidents. Refer also to Part II, Item 7. Management’s Discussion and Analysis of Financial Condition and Results of Operations – Recent Developments- COVID-19 Pandemic, Reduced Crude Oil Demand and Commodity Prices.
36
DIVERSITY AND INCLUSION
To ensure our workforce is reflective of the communities where we operate, we have pursued efforts to increase the representation of women, ethnic and racial groups, people with disabilities and veterans. Our original ambitions were set and shared with employees in 2018 with progress toward achievement shared regularly through our Diversity Dashboard. While we have made strong progress, we are accelerating the pace of our program and we have plans in place to meet our objectives by 2025. Consistent with our culture, we remain committed to open, two-way dialogue related to our goals, enhancing transparency and accountability for all stakeholders.
In early 2021, we added Inclusion to our core values of Safety, Integrity and Respect to demonstrate this commitment.
We are building an organization where people feel safe and welcome and have the opportunity to thrive and grow based on merit. As part of our evolving ESG strategy, we wanted to create a tighter link between our success and the workforce related ESG measures – including safety and diversity – that enable it. As a result, beginning in 2021, key metrics in these areas are embedded in our scorecards and directly impact compensation.
PRODUCTIVITY AND DEVELOPMENT
We continually invest in our people’s personal and professional development because we recognize their success is our success. Every year, employees are provided a range of development opportunities through a variety of channels, including: educational reimbursement programs; developmental relationships with mentors; rotational assignments; and Enbridge University, which offers a large catalog of courses.
EXECUTIVE OFFICERS
The following table sets forth information regarding our executive officers:
| Name | Age | Position | ||||||
| Al Monaco | 61 | President & Chief Executive Officer | ||||||
| Colin K. Gruending | 51 | Executive Vice President & Chief Financial Officer | ||||||
| Robert R. Rooney | 64 | Executive Vice President & Chief Legal Officer | ||||||
| William T. Yardley | 56 | Executive Vice President & President, Gas Transmission and Midstream | ||||||
| Cynthia L. Hansen | 56 | Executive Vice President & President, Gas Distribution and Storage | ||||||
| Byron C. Neiles | 55 | Executive Vice President, Corporate Services | ||||||
| Vern D. Yu | 54 | Executive Vice President & President, Liquids Pipelines | ||||||
| Matthew Akman | 53 | Senior Vice President, Strategy & Power | ||||||
| Allen C. Capps | 50 | Senior Vice President, Corporate Development & Energy Services | ||||||
Al Monaco was appointed President and Chief Executive Officer on October 1, 2012. Mr. Monaco is also a member of the Enbridge Board of Directors. Prior to being appointed President of Enbridge, Mr. Monaco served as President, Gas Pipelines, Green Energy and International with responsibility for the growth and operations of our gas pipelines, including the gas gathering and processing operations in the US, our Gulf Coast offshore assets and our investments in Alliance Pipeline, Vector and Aux Sable, as well as our International business development and investment activities and Renewable Power Generation.
37
Colin K. Gruending was appointed Executive Vice President and Chief Financial Officer of Enbridge on June 1, 2019. Previously, our Senior Vice President, Corporate Development and Investment Review, Mr. Gruending performed a number of progressively challenging executive roles such as Vice President Corporate Development and Planning and Vice President, Treasury and Tax while concurrently serving as Chief Financial Officer for Enbridge Income Fund and Enbridge Income Fund Holdings Inc. Prior to that, Mr. Gruending served as Corporate Controller and also led enterprise Investor Relations and Pension Investments.
Robert R. Rooney was appointed Executive Vice President and Chief Legal Officer on February 1, 2017. Mr. Rooney leads our legal, ethics and compliance, security and aviation teams across the organization.
William T. Yardley was named Executive Vice President and President, Gas Transmission and Midstream on February 27, 2017. Mr. Yardley, based in Houston, was previously President of Spectra Energy Corp's. (Spectra Energy) US Transmission and Storage business, leading the business development, project execution, operations and environment, health and safety efforts associated with Spectra Energy’s US portfolio of assets.
Cynthia L. Hansen was appointed Executive Vice President and President, Gas Distribution and Storage, on June 1, 2019. Ms. Hansen is responsible for the overall leadership and operations of Enbridge Gas, following the amalgamation of Enbridge Gas Distribution Inc. (EGD) and Union Gas Limited (Union Gas), as well as Gazifère. Previously, our Executive Vice President, Utilities and Power Operations, Ms. Hansen is also the Executive Sponsor for Asset and Work Management Transformation across Enbridge, working with other business unit leaders.
Byron C. Neiles was appointed Executive Vice President, Corporate Services on May 2, 2016. Mr. Neiles has oversight of our Technology & Information Services, Human Resources, Real Estate, Safety & Reliability, Supply Chain Management, and Public Affairs, Communications & Sustainability. Mr. Neiles had previously held the role of Senior Vice President, Major Projects, Enterprise Safety and Operational Reliability and had been Senior Vice President of Major Projects since November 2011, after joining our Major Projects group in April 2008.
Vern D. Yu was appointed Executive Vice President and President, Liquids Pipelines on January 1, 2020. Previously, Mr. Yu served as President and Chief Operating Officer for Liquids Pipelines and prior to that served as Executive Vice President and Chief Development Officer. He had previously served as Senior Vice President, Corporate Planning and Chief Development Officer. Prior to joining Corporate Development, Mr. Yu served as Senior Vice President of Business and Market Development for Enbridge’s Liquids Pipelines division and previously has held a series of roles with increasing responsibility in our corporate and financial areas.
Matthew Akman is our Senior Vice President, Strategy and Power. He is responsible for the corporate strategic planning process and all renewable power operations and development globally. Mr. Akman joined Enbridge in early 2016 as our head of Corporate Strategy and also previously held responsibilities for Corporate Development and Investor Relations. Prior to joining Enbridge, Mr. Akman worked primarily in banking with a focus on institutional equity research.
Allen C. Capps is our Senior Vice President, Corporate Development and Energy Services. He is responsible for capital allocation, investment review, corporate business development and Energy Services. Prior to assuming his current role in June 2019, Mr. Capps served as our Senior Vice President and Chief Accounting Officer and before that Vice President and Controller of Spectra Energy.
38
ADDITIONAL INFORMATION
Additional information about us is available on our website at www.enbridge.com, on SEDAR at www.sedar.com and on EDGAR at www.sec.gov. The aforementioned information is made available in accordance with legal requirements and is not, unless otherwise specifically stated, incorporated by reference into this Annual Report on Form 10-K. We make available free of charge, through our website, annual reports on Form 10-K, quarterly reports on Form 10-Q and current reports on Form 8-K and amendments to those reports filed or furnished pursuant to Section 13(a) or 15(d) of the Securities Exchange Act of 1934, as well as proxy statements, as soon as reasonably practicable after we electronically file such material with, or furnish it to, the Securities and Exchange Commission (SEC). Reports, proxy statements and other information filed with the SEC may also be obtained through the SEC’s website (www.sec.gov).
ENBRIDGE GAS INC.
Additional information about Enbridge Gas can be found in its annual information form, financial statements and management's discussion and analysis (MD&A) for the year ended December 31, 2020, which have been filed with the securities commissions or similar authorities in each of the provinces of Canada. These documents contain detailed disclosure with respect to Enbridge Gas and are publicly available on SEDAR at www.sedar.com. These documents are not, unless otherwise specifically stated, incorporated by reference into this Annual Report on Form 10-K.
ENBRIDGE PIPELINES INC.
Additional information about Enbridge Pipelines Inc. (EPI) can be found in its annual information form, financial statements and MD&A for the year ended December 31, 2020, which have been filed with the securities commissions or similar authorities in each of the provinces of Canada. These documents contain detailed disclosure with respect to EPI and are publicly available on SEDAR at www.sedar.com. These documents are not, unless otherwise specifically stated, incorporated by reference into this Annual Report on Form 10-K.
WESTCOAST ENERGY INC.
Additional information about Westcoast can be found in its annual information form, financial statements and MD&A for the year ended December 31, 2020, which have been filed with the securities commissions or similar authorities in each of the provinces of Canada. These documents contain detailed disclosure with respect to Westcoast and are publicly available on SEDAR at www.sedar.com. These documents are not, unless otherwise specifically stated, incorporated by reference into this Annual Report on Form 10-K.
39
ITEM 1A. RISK FACTORS
The following risk factors could materially and adversely affect our business, operations, financial results or market price or value of our securities. This list is not exhaustive, and we place no priority or likelihood based on order of presentation or grouping under sub-captions. For ease of reference, the risk factors are presented under the following sub-captions: (1) Risks Related to Operational Disruption or Catastrophic Events; (2) Risks Related to our Business and Industry; and (3) Risks Related to Government Regulation and Legal Risks.
RISKS RELATED TO OPERATIONAL DISRUPTION OR CATASTROPHIC EVENTS
Pipeline operations involve numerous risks that may adversely affect our business and financial results.
Operation of complex pipeline systems, gathering, treating, storing and processing operations involves many risks, hazards and uncertainties. These events include adverse weather conditions, accidents, the breakdown or failure of equipment or processes, the performance of the facilities below expected levels of capacity and efficiency and catastrophic events; which include, but are not limited to, physical risks related to climate change, such as, fires, earthquakes, hurricanes, floods, landslides, increased volatility in season temperatures, rising sea levels or other similar events beyond our control. These types of catastrophic events could result in loss of human life, significant damage to property and our assets, environmental pollution and impairment of our operations, any of which could also result in substantial losses for which insurance may not be sufficient or available and for which we may bear a part or all of the cost.
We have experienced such events in the past, including in 2010 on Lines 6A and 6B of the Lakehead System; in October 2018 at the BC Pipeline T-South system; and in January 2019, August 2019 and May 2020 at the Texas Eastern pipeline, and we cannot guarantee that we will not experience catastrophic events in the future. In addition, we could be subject to litigation and significant fines and penalties from regulators in connection with any such events.
An environmental incident is an event that may cause harm or potential harm to the environment and could also lead to an increased cost of operating and insuring our assets, thereby negatively impacting earnings. An environmental incident could have lasting reputational impacts to us and could impact our ability to work with various stakeholders. For pipeline and storage assets located near populated areas, including residential communities, commercial business centers, industrial sites and other public gathering locations, the level of damage resulting from these catastrophic events could be greater.
A service interruption could have a significant impact on our operations, and negatively impact financial results, relationships with stakeholders and our reputation.
A service interruption due to a major power disruption, curtailment of commodity supply, operational incident or other reasons could have a significant impact on our operations and negatively impact financial results, relationships with stakeholders and our reputation. Service interruptions that impact our crude oil and natural gas transportation services can negatively impact shippers’ operations and earnings as they are dependent on our services to move their product to market or fulfill their own contractual arrangements.
40
Our operations involve safety risks to the public and to our workers and contractors.
Several of our pipelines and distribution systems and related assets are operated in close proximity to populated areas and a major incident could result in injury or loss of life to members of the public. In addition, given the natural hazards inherent in our operations, our workers and contractors are subject to personal safety risks. A public safety incident or an injury or loss of life to our workers or contractors, which we have experienced in the past and, despite the precautions we take, may experience in the future, could result in reputational damage to us, material repair costs or increased costs of operating and insuring our assets.
Cyber-attacks or security breaches could adversely affect our business, operations or financial results.
Our business is dependent upon information systems and other digital technologies for controlling our plants, pipelines and other assets, processing transactions and summarizing and reporting results of operations. The secure processing, maintenance and transmission of information is critical to our operations. A security breach of our network or systems, or the network or systems of our third-party vendors, could result in improper operation of our assets, potentially including delays in the delivery or availability of our customers’ products, contamination or degradation of the products we transport, store or distribute, or releases of hydrocarbon products for which we could be held liable. Furthermore, we and some of our vendors collect and store sensitive data in the ordinary course of our business, including personal identification information of our employees as well as our proprietary business information and that of our customers, suppliers, investors and other stakeholders.
Cybersecurity risks have increased in recent years as a result of the proliferation of new technologies and the increased sophistication, magnitude and frequency of cyber-attacks and data security breaches. Because of the critical nature of our infrastructure and our use of information systems and other digital technologies to control our assets, we face a heightened risk of cyber-attacks. We have a cyber-security controls framework in place which has been derived from the National Institute of Standards. We monitor our control effectiveness in an increasing threat landscape and continuously take action to improve our security posture. We have implemented a security operations center, which operates at all times to monitor, detect and investigate activity in our network together with an incident response process that we test on a monthly basis. We conduct independent cyber-security audits and penetration tests on a regular basis to test that our preventative and detective controls are working as designed.
During the normal course of business, we have experienced and expect to continue to experience attempts to gain unauthorized access to, or to compromise, our information systems or to disrupt our operations through cyber-attacks or security breaches, although none to our knowledge have had a material adverse effect on our business, operations or financial results. Despite our security measures, our information systems, or those of our vendors, may become the target of further cyber-attacks (including hacking, viruses or acts of terrorism) or security breaches (including employee error, malfeasance or other breaches), which could compromise our network or systems, or those of our vendors, affect our ability to correctly record, process and report transactions or financial information, or result in the release or loss of the information stored therein, misappropriation of assets, disruption to our operations or damage to our facilities. As a result of a cyber-attack or security breach, we could also be liable under laws that protect the privacy of personal information, subject to regulatory penalties, experience damage to our reputation or a loss of consumer confidence in our products and services, or incur additional costs for remediation and modification or enhancement of our information systems to prevent future occurrences or other costs or be subject to increased regulation or litigation, all of which could materially adversely affect our reputation, business, operations or financial results.
41
Pandemics, epidemics or disease outbreaks, such as the COVID-19 pandemic, may adversely affect local and global economies and our business, operations or financial results.
Disruptions caused by pandemics, epidemics or disease outbreaks, in locations in which we operate or globally, could materially adversely affect our business, operations, financial results and forward-looking expectations. The COVID-19 pandemic has negatively impacted us in 2020 and the impacts are expected to continue for future periods, which we are unable to reasonably predict due to numerous uncertainties, including the duration and severity of the pandemic.
The World Health Organization declared COVID-19 to be a pandemic on March 11, 2020. In response to the rapid global spread of COVID-19, governments have enacted emergency measures to combat the spread of the virus. These measures include restrictions on business activity and travel, as well as requirements to isolate or quarantine, which could continue or expand. Certain of our operations and projects have been deemed essential services in critical infrastructure sectors and are currently exempt from certain business activity restrictions; however, there is no guarantee that this exemption will continue. These actions have interrupted business activities and supply chains; disrupted travel; contributed to significant volatility in the financial and commodity markets, resulting in lower interest rates; impacted social conditions; and adversely impacted national and international economic conditions, including commodity prices and demand for energy, as well as the labor market.
Given the ongoing and dynamic nature of the circumstances surrounding the COVID-19 pandemic, it is difficult to predict how significant the impact of this pandemic, including any responses to it, will be on North American or global economies or our business, or for how long disruptions are likely to continue. The extent of such impact will depend on future developments and factors outside of our control, which are highly uncertain, rapidly evolving and cannot be predicted, including new information which may emerge concerning the severity or duration of this pandemic (including regarding new COVID-19 strains) and actions taken by governments and others to contain or end the COVID-19 pandemic or its impact (including regarding the development and distribution of effective vaccines). Such developments, which have had or may have an adverse effect on our customers, suppliers, regulators, business, operations and financial results, include disruptions that, among other things:
•adversely impacted market fundamentals, such as commodity prices and supply and demand for energy, decreasing volumes transported on our systems, increasing our exposure to asset utilization risks and adversely affecting our results;
•adversely impacted our Liquids Pipelines investments;
•could prevent one or more of our secured capital projects from proceeding, and has delayed completion and increased anticipated costs of certain projects;
•adversely impacted the operations or financial position of our third-party suppliers, service providers or customers and increase our exposure to contract-related risks or customer credit risk;
•adversely impacted the global capital markets, which could adversely impact the ratings assigned to our securities or our credit facilities and/or impact our ability to access capital markets at effective rates;
•increased our risks associated with emergency measures taken (including remote working, distancing and additional personal protective equipment), including increased cyber security risks, increased costs and the potential for reduced availability or productivity of our employees or third-party contractors or service providers;
•adversely impacted our ability to accurately forecast assumptions used to evaluate expansion projects, acquisitions and divestitures on an ongoing basis;
•adversely impacted the carrying value of our equity method investment in DCP Midstream and could adversely impact the outcome of future asset impairment tests, indicating that the carrying value of such assets might be impaired;
•could adversely impact the execution of current and future trade policies between Canada and the US; and
42
•could result in future business interruption losses that our insurance coverage may not be sufficient to cover.
There can be no assurance that our strategies to address potential disruptions will mitigate these risks or the adverse impacts to our business, operations and financial results. Future adverse impacts to our business, operations and financial results may materialize that are not yet known. In addition, disruptions related to the COVID-19 pandemic have had, or could have, the effect of heightening many of the other risks described in this Item 1A. Risk Factors. The risk that is most significantly heightened by the COVID-19 pandemic is the impact of commodity price weakness and volatility on our Liquids Pipelines, Gas Transmission and Midstream and Energy Services businesses, as detailed in the risk factor “Weakness and volatility in commodity prices increase utilization risks with respect to our assets and has had and may have an adverse effect on our results of operations” below. Even after the COVID-19 pandemic has subsided, we may continue to experience adverse impacts to our business as a result of its global impact, including any related recession, as well as lingering impacts on supply of, demand for and prices of crude oil, natural gas, natural gas liquids, LNG and renewable energy.
Terrorist attacks and threats, escalation of military activity in response to these attacks or acts of war, and other civil unrest or activism could adversely affect our business, operations or financial results.
Terrorist attacks and threats, escalation of military activity or acts of war, or other civil unrest or activism may have significant effects on general economic conditions and may cause fluctuations in consumer confidence and spending and market liquidity, each of which could adversely affect our business. Future terrorist attacks, rumors or threats of war, actual conflicts involving the US, or Canada, or military or trade disruptions may significantly affect our operations and those of our customers. Strategic targets, such as energy related assets, may be at greater risk of future attacks than other targets in the US and Canada. In addition, increased environmental activism against pipeline construction and operation could potentially result in work delays, reduced demand for our products and services, increased legislation or denial or delay of permits and rights-of-way. Finally, the disruption or a significant increase in energy prices could result in government-imposed price controls. It is possible that any of these occurrences, or a combination of them, could adversely affect our business, operations or financial results.
RISKS RELATED TO OUR BUSINESS AND INDUSTRY
There are utilization risks with respect to our assets.
With respect to our Liquids Pipelines assets, we are exposed to throughput risk under the CTS on the Canadian Mainline and under certain tolling agreements applicable to other Liquids Pipelines assets, such as the Lakehead System. A decrease in volumes transported can directly and adversely affect our revenues and earnings. Factors such as changing market fundamentals, capacity bottlenecks, operational incidents, regulatory restrictions, system maintenance and increased competition can all impact the utilization of our assets. Market fundamentals, such as commodity prices and price differentials, weather, gasoline price and consumption, alternative energy sources and global supply disruptions outside of our control can impact both the supply of and demand for crude oil and other liquid hydrocarbons transported on our pipelines.
With respect to our Gas Transmission and Midstream assets, gas supply and demand dynamics continue to change as a result of the development of non-conventional shale gas supplies. The increase in natural gas supply has resulted in declines in the price of natural gas in North America. As a result, a shift occurred to extraction of gas in richer, wet gas areas with higher NGL content which depressed activity in dry fields. This, in turn, has contributed to a resulting oversupply of pipeline takeaway capacity in some areas, which can adversely affect our revenues and earnings.
43
With respect to our Gas Distribution and Storage assets, customers are billed on a combination of both fixed charge and volumetric basis and our ability to collect their respective total revenue requirement (the cost of providing service, including a reasonable return to the utility) depends on achieving the forecast distribution volume established in the rate-making process. The probability of realizing such volume is contingent upon four key forecast variables: weather, economic conditions, pricing of competitive energy sources and growth in the number of customers. Weather is a significant driver of delivery volumes, given that a significant portion of our Gas Distribution customer base uses natural gas for space heating. Distribution volume may also be impacted by the increased adoption of energy efficient technologies, along with more efficient building construction, that continue to place downward pressure on consumption. In addition, conservation efforts by customers may further contribute to a decline in annual average consumption. Our Gas Distribution business has deferral accounts approved by the OEB that provide regulatory protection against the margin impacts associated with declining annual average consumption due to efficiencies and customers’ conservation efforts. Sales and transportation service to large volume commercial and industrial customers is more susceptible to prevailing economic conditions. As well, the pricing of competitive energy sources affects volume distributed to these sectors as some customers have the ability to switch to an alternate fuel. Even in those circumstances where we attain our respective total forecast distribution volume, our Gas Distribution business may not earn its expected ROE due to other forecast variables, such as the mix between the higher margin residential and commercial sectors and the lower margin industrial sector. Our Gas Distribution business remains at risk for the actual versus forecast large volume contract commercial and industrial volumes.
With respect to our Renewable Power Generation assets, earnings from these assets are highly dependent on weather and atmospheric conditions as well as continued operational availability of these energy producing assets. While the expected energy yields for Renewable Power Generation projects are predicted using long-term historical data, wind and solar resources are subject to natural variation from year to year and from season to season. Any prolonged reduction in wind or solar resources at any of the Renewable Power Generation facilities could lead to decreased earnings and cash flows for us. Additionally, inefficiencies or interruptions of Renewable Power Generation facilities due to operational disturbances or outages resulting from weather conditions or other factors, could also impact earnings.
An impairment of our assets, including goodwill, property, plant, and equipment, intangible assets, and/or equity method investments, could reduce our earnings.
Generally accepted accounting principles in the United States of America (US GAAP) requires us to test certain assets for impairment on either an annual basis or when events or circumstances occur which indicate that the carrying value of such assets might be impaired. The outcome of such testing could result in impairments of our assets including our goodwill, property, plant and equipment, intangible assets, and/or equity method investments. Additionally, any asset monetizations could result in impairments if such assets are sold or otherwise exchanged for amounts less than their carrying value. If we determine that an impairment has occurred, we would be required to take an immediate non-cash charge to earnings.
Our assets vary in age and were constructed over many decades which may cause our inspection, maintenance or repair costs to increase in the future.
Our pipelines vary in age and were constructed over many decades. Pipelines are generally long-lived assets, and pipeline construction and coating techniques have changed over time. Depending on the era of construction, some assets require more frequent inspections, which could result in increased maintenance or repair expenditures in the future. Any significant increase in these expenditures could adversely affect our business, operations or financial results.
44
Competition may result in a reduction in demand for our services, fewer project opportunities or assumption of risk that results in weaker or more volatile financial performance than expected.
We face competition from competing carriers available to ship western Canadian liquid hydrocarbons to markets in Canada, the US and internationally and from proposed pipelines that seek to access markets currently served by our liquids pipelines. Competition among existing pipelines is based primarily on the cost of transportation, access to supply, the quality and reliability of service, contract carrier alternatives and proximity to markets. We also face competition from alternative gathering and storage facilities. Our natural gas transmission and storage businesses compete with similar facilities that serve our supply and market areas in the transmission and storage of natural gas. The natural gas transported in our business competes with other forms of energy available to our customers and end-users, including electricity, coal, propane, fuel oils, and renewable energy. Competition in all of our businesses, including competition for new project development opportunities, could have a negative impact on our business, financial condition or results of operations.
Execution of our projects subjects us to various regulatory, operational and market risks that may affect our financial results.
Our ability to successfully execute our projects is subject to various regulatory, operational and market risks, including:
•the ability to obtain necessary approvals and permits from governments and regulatory agencies on a timely basis and on acceptable terms and to maintain those issued approvals and permits and satisfy the terms and conditions imposed therein;
•potential changes in federal, state, provincial and local statutes and regulations, including environmental requirements, that may prevent a project from proceeding or increase the anticipated cost of the project;
•impediments on our ability to acquire or renew rights-of-way or land rights on a timely basis and on acceptable terms;
•opposition to our projects by third parties, including interest groups;
•the availability of skilled labor, equipment and materials to complete projects;
•the ability to construct projects within anticipated costs, including the risk of cost overruns resulting from inflation or increased costs of equipment, materials or labor, contractor or supplier non-performance, weather, geologic conditions or other factors beyond our control, that may be material;
•general economic factors that affect the demand for our projects; and
•the ability to raise financing for these projects.
Climate related risks are integrated into our larger risk categories that encompass operational, financial and stakeholder consequences. This is done because of the interconnected economic, social and environmental nature of climate impacts requires a comprehensive review within the context of other risks that impact us.
Any of these risks could prevent a project from proceeding, delay its completion or increase its anticipated cost. Recent projects that have experienced delays include the US L3R Program, the Spruce Ridge Project and the T-South Reliability and Expansion Program. New projects may not achieve their expected investment return, which could affect our financial results, and hinder our ability to secure future projects. For additional discussion of specific proceedings that could affect our operations and financial results, refer to Part II. Item 7. Management's Discussion and Analysis of Financial Condition and Results of Operations - Legal and Other Updates.
45
Changing expectations from stakeholders regarding ESG practices and climate change or erosion of stakeholder trust or confidence could influence actions or decisions about our company and industry and have negative impacts on our business, operations or financial results.
Companies across all sectors and industries are facing changing expectations or increasing scrutiny from stakeholders related to their approach to ESG matters of greatest relevance to their business and to their stakeholders. For energy companies, climate change, safety and stakeholder relations remain primary focus areas; changing expectations of our practices and performance across these and other ESG areas may impose additional costs or create exposure to new or additional risks. Our operations, projects and growth opportunities require us to have strong relationships with key stakeholders, including local communities, Indigenous communities and other groups directly impacted by our activities, as well as governments and government agencies, investor advocacy groups, certain institutional investors, investment funds and others which are increasingly focused on ESG practices. We have long been committed to strong ESG practices and performance, and in 2020 introduced a set of ESG goals to strengthen transparency and accountability. The goals include targets for GHG emissions reduction; adapting to the energy transition over time is one of our strategic priorities. Inadequately managing expectations and issues important to stakeholders, including those related to environment and climate change, could impact stakeholder trust and confidence and our reputation and have negative impacts on our business, operations or financial results, including:
•loss of business;
•loss of ability to secure growth opportunities;
•delays in project execution;
•legal action, such as the legal challenges to the operation of Line 5 in Michigan and Wisconsin;
•increased regulatory oversight;
•loss of ability to obtain and maintain necessary approvals and permits from governments and regulatory agencies on a timely basis and on acceptable terms;
•impediments on our ability to acquire or renew rights-of-way or land rights on a timely basis and on acceptable terms;
•changing investor sentiment regarding investment in the oil and gas industry or our company;
•restricted access to and cost of capital; and
•loss of ability to hire and retain top talent.
We are also exposed to the risk of higher costs, delays, project cancellations, new restrictions or the cessation of operations of existing pipelines due to increasing pressure on governments and regulators. Recent judicial decisions have increased the ability of groups to make claims and oppose projects in regulatory and legal forums. In addition to issues raised by groups focused on particular project impacts, we and others in the energy and pipeline businesses are facing organized opposition to oil and gas extraction and shipment of oil and gas products.
Our forecasted assumptions may not materialize as expected on our expansion projects, acquisitions and divestitures.
We evaluate expansion projects, acquisitions and divestitures on an ongoing basis. Planning and investment analysis is highly dependent on accurate forecasting assumptions and to the extent that these assumptions do not materialize, financial performance may be lower or more volatile than expected. Volatility and unpredictability in the economy, both locally and globally, change in cost estimates, project scoping and risk assessment could result in a loss of our profits.
46
Our insurance coverage may not be sufficient to cover our losses in the event of an accident, natural disaster or other hazardous event.
Our operations are subject to many hazards inherent in our industry. Our assets may experience physical damage as a result of an accident or natural disaster. These hazards also can cause, and in some cases have caused, personal injury and loss of life, severe damage to and destruction of property and equipment, pollution or environmental damage, and suspension of operations. We maintain a comprehensive insurance program for us, our subsidiaries and certain of our affiliates to mitigate the financial impacts arising from these hazards. This program includes insurance coverage in types and amounts and with terms and conditions that are generally consistent with coverage customary for our industry; however, insurance does not cover all events in all circumstances.
In the unlikely event that multiple insurable incidents that in the aggregate exceed coverage limits occur within the same insurance period, the total insurance coverage will be allocated among our entities on an equitable basis based on an insurance allocation agreement among us and our subsidiaries. Additionally, even with insurance, if any natural disaster or other hazardous event leads to a catastrophic interruption in operations, we may not be able to restore operations without significant interruption.
We are exposed to the credit risk of our customers.
We are exposed to the credit risk of our customers in the ordinary course of our business. Generally, our customers are rated investment-grade, are otherwise considered creditworthy or provide us security to satisfy credit concerns. A significant amount of our credit exposures for transmission and storage services are with customers who have an investment-grade rating (or the equivalent based on our evaluation) or are secured by collateral. However, we cannot predict to what extent our business would be impacted by deteriorating conditions in the economy, including possible declines in our customers’ creditworthiness. As a result of future capital projects for which natural gas and oil producers may be the primary customer, our credit exposure with below investment-grade customers may increase. It is possible that customer payment defaults, if significant, could adversely affect our earnings and cash flows.
Our risk management policies cannot eliminate all risks. In addition, any non-compliance with our risk management policies could adversely affect our business, operations or financial results.
We use derivative financial instruments to manage the risks associated with movements in foreign exchange rates, interest rates, commodity prices and our share price to reduce volatility of our cash flows. Based on our risk management policies, all of our derivative financial instruments are associated with an underlying asset, liability and/or forecasted transaction. We do not enter into transactions with the objective of speculating on commodity prices or interest rates. These policies cannot, however, eliminate all risk of unauthorized trading and other speculative activity. Although this activity is monitored independently by our risk management function, we remain exposed to the risk of non-compliance with our risk management policies. We can provide no assurance that our risk management function will detect and prevent all unauthorized trading and other violations of our risk management policies and procedures, particularly if deception, collusion or other intentional misconduct is involved, and any such violations could adversely affect our business, operations or financial results.
Our business requires the retention and recruitment of a skilled workforce, and difficulties recruiting and retaining our workforce could result in a failure to implement our business plans.
Our operations and management require the retention and recruitment of a skilled workforce, including engineers, technical personnel and other professionals. We and our affiliates compete with other companies in the energy industry for this skilled workforce. If we are unable to retain current employees and/or recruit new employees of comparable knowledge and experience, our business could be negatively impacted. In addition, we could experience increased costs to retain and recruit these professionals.
47
Our transformation projects may fail to fully deliver anticipated results.
We launched projects starting in 2016 to transform various processes, capabilities and reporting systems infrastructure to continuously improve effectiveness and efficiency across the organization and are subject to transformation project risk with respect to these projects. Such projects, some of which will continue into 2021 and 2022, including integration initiatives arising out of the merger with Spectra Energy and the amalgamation of EGD and Union Gas, are subject to transformation project risk. Transformation project risk is the risk that modernization projects carried out by us and our subsidiaries do not fully deliver anticipated results due to insufficiently addressing the risks associated with project execution and change management. This could result in negative financial, operational and reputational impacts.
Weakness and volatility in commodity prices increase utilization risks with respect to our assets and has had and may have an adverse effect on our operational results.
The COVID-19 pandemic and concerns about global economic growth have caused considerable uncertainty in the market for crude oil, natural gas and other commodities, lowering demand forecasts. This, and the changing relationship dynamic among OPEC+ members, has put severe downward pressure on prices early in 2020. The economic climate in Canada, the US and abroad has deteriorated and worldwide demand for petroleum products has diminished. 2020 saw a dramatic decline in the price of crude oil, natural gas and NGL and other commodities whose prices are highly correlated to crude oil. The West Texas Intermediate benchmark prices for crude oil had been trading around US$60 per barrel in December 2019 and fell to as low as US$14 per barrel in March 2020 and into a negative value on April 20, 2020. Crude oil prices started to recover in the second and third quarters of 2020, with West Texas Intermediate benchmark prices reaching over US$40 primarily due to the announcement of crude oil productions cuts in April 2020 and June 2020. The West Texas Intermediate benchmark finished the year at US$48.35 per barrel.
With respect to our Liquids Pipelines assets, we are exposed to throughput risk under the Competitive Tolling Settlement on the Canadian Mainline and under certain tolling agreements applicable to other Liquids Pipelines assets, such as the Lakehead System. A decrease in volumes transported can directly and adversely affect our revenues and earnings. The current commodity price environment has impacted both the supply of and demand for crude oil and other liquid hydrocarbons transported on our pipelines. This has led to a year-over-year reduction in Mainline System utilization of 80 kbpd in 2020.
While reduced demand has impacted throughput and revenue on the Mainline System, the financial impact of reduced throughput on our upstream regional pipelines and our downstream market extension pipelines is largely mitigated by the presence of take-or-pay contracts. The financial impact is also mitigated through cost-of-service arrangements with credit-worthy counterparties or parties that are not investment grade but have instead provided credit support in the form of letters of credit or other instruments. The existing market conditions are likely to stress the creditworthiness of many of these counterparties and we continue to evaluate the situation on an ongoing basis. To date, we have not had any counterparty default on its obligations to maintain credit support or pay its tolls under these contracts and, at this time, we do not foresee a material impact to our financial results.
Shippers also reduced investment in exploration and development programs in 2020. The decline in oil prices is also causing some sponsors of oil sands development programs to reconsider the timing of previously announced upstream development projects. Cancellation or deferral of these projects would affect longer-term supply growth from the Western Canadian Sedimentary Basin.
With respect to our Gas Transmission and Midstream assets, the low commodity prices have had limited impact on demand for natural gas shipped within our long-haul Gas Transmission assets in the US and Canada. These assets are comprised of primarily cost-of-service and take-or-pay contract arrangements which are not directly impacted by fluctuations in commodity prices.
48
Within our US Midstream assets, through our investment in DCP Midstream and, to a lesser extent, the Aux Sable liquids product plant, we are engaged in the businesses of gathering, treating and processing natural gas and natural gas liquids. Given the drastic decline in commodity prices, DCP Midstream made the decision to decrease its distribution to us by 50% (beginning with the first quarter distribution paid in May 2020), thereby reducing our cash flows. Aux Sable results were also negatively impacted by these lower commodity prices.
With respect to our Energy Services business, we generate margins by capitalizing on quality, time and location differentials when opportunities arise. The recent volatility in commodity prices could limit margin opportunities and impede our ability to cover capacity commitments.
At this point, given the many outstanding questions as to the length and depth of the current low commodity price environment, the impact on us is uncertain; however, it is possible that it may have an adverse impact on our business and our results of operations.
Our Liquids Pipelines growth rate and results may be directly and indirectly affected by commodity prices and Government policy.
The efforts implemented in 2019 by the Alberta Government to manage supply and inventories in Western Canada continued at diminishing levels in 2020 as incremental take away capacity was introduced to the market. This intervention had a negligible impact on the Mainline System throughput, as enough inventory existed to meet refinery customer needs and service our favorable markets. Wide commodity price basis between Western Canada and global tidewater markets have negatively impacted producer netbacks and margins in the past years that largely resulted from pipeline infrastructure takeaway capacity from producing regions in Western Canada and North Dakota which are operating at capacity. A protracted long-term outlook for low crude oil prices could result in delay or cancellation of future projects.
The tight conventional oil plays of Western Canada and the Bakken region of North Dakota have short cycle break-even time horizons, typically less than 24 months, and high decline rates that can be well managed through active hedging programs and are positioned to react quickly at market signals. Accordingly, during periods of comparatively low prices, drilling programs, unsupported by hedging programs, will be reduced and as such supply growth from tight oil basins may be lower, which may impact volumes on our pipeline systems.
Our Gas Transmission and Midstream results may be adversely affected by commodity price volatility and risks associated with our hedging activities.
Our exposure to commodity price volatility is inherent to our US Midstream business. We employ a disciplined hedging program to manage this direct commodity price risk. Because we are not fully hedged, we may be adversely impacted by commodity price exposure on the commodities we receive in-kind as payment for our gathering, processing, treating and transportation services. As a result of our unhedged exposure and the pricing of our hedge positions, a substantial decline in the prices of these commodities could adversely affect our financial results.
Additionally, our hedging activities may not be as effective as we intend in reducing the volatility of our cash flows. To the extent that we engage in hedging activities to reduce our commodity price exposure, we likely will be prevented from realizing the full benefits of price increases above the level of the hedges. Our hedging activities can result in substantial losses if hedging arrangements are imperfect or ineffective and our hedging policies and procedures are not followed properly or do not work as intended. Further, hedging contracts are subject to the credit risk that the other party may prove unable or unwilling to perform its obligations under the contracts, particularly during periods of weak and volatile economic conditions. In addition, certain of the financial instruments we use to hedge our commodity risk exposures must be accounted for on a mark-to-market basis. This causes periodic earnings volatility due to fluctuations in commodity prices.
49
Our Energy Services results may be adversely affected by commodity price volatility.
Energy Services generates margin by capitalizing on quality, time and location differentials when opportunities arise. Lower commodity prices due to changing market conditions could limit margin opportunities and impede Energy Services' ability to cover capacity commitments.
We rely on access to short-term and long-term capital markets to finance capital requirements and support liquidity needs, and cost effective access to those markets can be affected, particularly if we or our rated subsidiaries are unable to maintain an investment-grade credit rating.
A significant portion of our consolidated asset base is financed with debt. The maturity and repayment profile of debt used to finance investments often does not correlate to cash flows from assets. Accordingly, we rely on access to both short-term and long-term capital markets as a source of liquidity for capital requirements not satisfied by cash flows from operations and to fund investments originally financed through debt. Our senior unsecured long-term debt is currently rated investment-grade by various rating agencies. If the rating agencies were to rate us or our rated subsidiaries below investment-grade, our borrowing costs would increase, perhaps significantly. Consequently, we would likely be required to pay a higher interest rate in future financings and our potential pool of investors and funding sources could decrease.
We maintain revolving credit facilities to provide back-up for commercial paper programs for borrowings and/or letters of credit at various entities. These facilities typically include financial covenants and failure to maintain these covenants at a particular entity could preclude that entity from issuing commercial paper or letters of credit or borrowing under the revolving credit facility, which could affect cash flows or restrict business. Furthermore, if our short-term debt rating were to be downgraded, access to the commercial paper market could be significantly limited. Although this would not affect our ability to draw under our credit facilities, borrowing costs could be significantly higher.
If we are not able to access capital at competitive rates, our ability to finance operations and implement our strategy may be affected. An inability to access capital may limit our ability to pursue enhancements or acquisitions that we may otherwise rely on for future growth. Any downgrade or other event negatively affecting the credit ratings of our subsidiaries could make their costs of borrowing higher or access to funding sources more limited, which in turn could increase our need to provide liquidity in the form of capital contributions or loans to such subsidiaries, thus reducing the liquidity and borrowing availability of the consolidated group.
RISKS RELATED TO GOVERNMENT REGULATION AND LEGAL RISKS
Many of our operations are regulated and failure to secure regulatory approval for our proposed projects, or loss of required approvals for our existing operations, could have a negative impact on our business, operations or financial results.
The nature and degree of regulation and legislation affecting energy companies in Canada and the US have changed significantly in recent years.
50
In Canada, the passing of the Canadian Energy Regulator Act and the Impact Assessment Act under Bill C-69, which came into force on August 28, 2019, is expected to extend timelines associated with regulatory approvals for new projects which trigger a federal impact assessment. Changes to the British Columbia regulatory framework have also been made, including a new Environmental Assessment Act, which came into force in December 2019, affecting provincially-regulated projects in a similar manner as those that are federally-regulated. Within the US and in Canada, pipelines companies continue to face opposition from anti-pipeline activists, Indigenous and tribal communities, citizens, environmental groups and politicians concerned with either the safety of pipelines or environmental effects. In the US, several federal agencies made changes to regulations that were designed to streamline permitting, including changes that the Environmental Protection Agency made in June 2020 to regulations implementing Section 401 of the Clean Water Act and the July 2020 Council on Environmental Quality revisions to regulations implementing the National Environmental Policy Act. These and many other regulations adopted during the previous US presidential administration are not only being challenged in multiple courts, but have now been expressly targeted for rollback by the new US administration, which is expected to modify or reverse the regulations.
These actions could adversely impact permitting of a wide range of energy projects. We may not be able to obtain or maintain all required regulatory approvals for our operating assets or development projects. If there is a delay in obtaining any required regulatory approvals, if we fail to obtain or comply with them, or if laws or regulations change or are administered in a more stringent manner, the operations of facilities or the development of new facilities could be prevented, delayed or become subject to additional costs.
Our operations are subject to numerous environmental laws and regulations, including those relating to climate change and GHG emissions, compliance with which may require significant capital expenditures, increase our cost of operations and affect or limit our business plans, or expose us to environmental liabilities.
We are subject to numerous environmental laws and regulations affecting many aspects of our present and future operations, including air emissions, water quality, wastewater discharges, solid waste and hazardous waste.
Failure to comply with environmental laws and regulations and failure to secure permits necessary for our operations may result in the imposition of fines, penalties and injunctive measures affecting our operating assets. In addition, changes in environmental laws and regulations or the enactment of new environmental laws or regulations, including those related to climate change and GHG emissions, could result in a material increase in our cost of compliance with such laws and regulations, such as costs to monitor and report our emissions and install new emission controls to reduce emissions. We may not be able to include some or all of such increased costs in the rates charged by our pipelines or other facilities. Efforts to regulate or restrict GHG emissions could also drive down demand for the products we transport.
We may not be able to obtain or maintain all required environmental regulatory approvals and permits for our operating assets or development projects. If there is a delay in obtaining any required environmental regulatory approvals or permits, if we fail to obtain or comply with them, or if environmental laws or regulations change or are administered in a more stringent manner, the operations of facilities or the development of new facilities could be prevented, delayed or become subject to additional costs. We expect that costs we incur to comply with environmental regulations in the future may have a significant effect on our earnings and cash flows.
In November 2020, we set new ESG goals for the future, including with respect to GHG emissions reduction. Our ability to achieve these goals depends on many factors, including our ability to reduce emissions from our operations through modernization and innovation, reduce the emissions intensity of the electricity we buy, invest in renewables and low carbon energy and balance residual emissions through carbon offset credits. The cost associated with our GHG emissions reduction goals could be significant. Failure to achieve our emissions targets could result in reputational harm, changing investor sentiment regarding investment in Enbridge or a negative impact on access to and cost of capital.
51
Our operations are subject to operational regulation and other requirements, including compliance with easements and other land tenure documents, and failure to comply with applicable regulations and other requirements could have a negative impact on our reputation, business, operations or financial results.
Operational risks relate to compliance with applicable operational rules and regulations mandated by governments, applicable regulatory authorities, or other requirements that may be found in easements or other agreements that provide a legal basis for our operations, breaches of which could result in fines, penalties, awards of damages, operating restrictions (including shutdown of lines) and an overall increase in operating and compliance costs. We do not own all of the land on which our pipelines, facilities and other assets are located and we obtain the rights to construct and operate our pipelines and other assets from third parties or government entities. In addition, some of our pipelines, facilities and other assets cross Indigenous lands pursuant to rights-of-way or other land tenure interests. Our loss of these rights could have an adverse effect on our reputation, operations and financial results. Scrutiny over the integrity of our assets and operations has the potential to increase operating costs or limit future projects. Potential regulatory changes and legal challenges could have an impact on our future earnings from existing operations and the cost related to the construction of new projects. Regulators' future actions may differ from current expectations, or future legislative changes may impact the regulatory environments in which we operate. While we seek to mitigate operational regulation risk by actively monitoring and consulting on potential regulatory requirement changes with the respective regulators directly, or through industry associations, and by developing response plans to regulatory changes or enforcement actions, such mitigation efforts may be ineffective or insufficient. While we believe the safe and reliable operation of our assets and adherence to existing regulations is the best approach to managing operational regulatory risk, the potential remains for regulators or other government officials to make unilateral decisions that could disrupt our operations or have an adverse financial impact on us.
Our operations are subject to economic regulation and failure to secure regulatory approval for our proposed or existing commercial arrangements could have a negative impact on our business, operations or financial results.
Our liquids pipelines face economic regulatory risk, the risk that governments or regulatory agencies change or reject proposed or existing commercial arrangements. We believe that economic regulatory risk is reduced through the negotiation of long-term agreements with shippers that govern the majority of our liquids pipelines assets. However, there remains a risk that a regulator could modify significantly its own long-standing policies for rate making as well as overturn long-term agreements that we have entered into with shippers.
We could be subject to changes in our tax rates, the adoption of new US, Canadian or international tax legislation or exposure to additional tax liabilities.
We are subject to taxes in the US, Canada and numerous foreign jurisdictions. Due to economic and political conditions, tax rates in various jurisdictions may be subject to significant change. Our effective tax rates could be affected by changes in the mix of earnings in countries with differing statutory tax rates, changes in the valuation of deferred tax assets and liabilities, or changes in tax laws or their interpretation, including in particular the US with a new presidential administration and in Canada and other foreign jurisdictions in which we operate.
We are also subject to the examination of our tax returns and other tax matters by the US Internal Revenue Service, the Canada Revenue Agency and other tax authorities and governmental bodies. We regularly assess the likelihood of an adverse outcome resulting from these examinations to determine the adequacy of our provision for taxes. There can be no assurance as to the outcome of these examinations. If our effective tax rates were to increase, particularly in the US or Canada, or if the ultimate determination of our taxes owed is for an amount in excess of amounts previously accrued, our financial condition and operating results could be materially adversely affected.
52
We are involved in numerous legal proceedings, the outcomes of which are uncertain, and resolutions adverse to us could adversely affect our financial results.
We are subject to numerous legal proceedings. Litigation is subject to many uncertainties, and we cannot predict the outcome of individual matters with assurance. It is reasonably possible that the final resolution of some of the matters in which we are involved could require additional expenditures, in excess of established reserves, over an extended period of time and in a range of amounts that could adversely affect our financial results. Refer to Part II. Item 7. Management's Discussion and Analysis of Financial Condition and Results of Operations - Legal and Other Updates for a discussion of legal proceedings.
ITEM 1B. UNRESOLVED STAFF COMMENTS
None.
ITEM 2. PROPERTIES
Descriptions of our properties and maps depicting the locations of our liquids and natural gas systems are included in Item 1. Business.
In general, our systems are located on land owned by others and are operated under easements and rights-of-way, licenses, leases or permits that have been granted by private land-owners, First Nations, Native American Tribes, public authorities, railways or public utilities. Our liquids systems have pumping stations, tanks, terminals and certain other facilities that are located on land that is owned by us and/or used by us under easements, licenses, leases or permits. Additionally, our natural gas systems have natural gas compressor stations, processing plants and treating plants, the vast majority of which are located on land that is owned by us, with the remainder used by us under easements, leases or permits.
Titles to our properties acquired in our liquids and natural gas systems are subject to encumbrances in some cases. We believe that none of these burdens should materially detract from the value of these properties or materially interfere with their use in the operation of our business.
ITEM 3. LEGAL PROCEEDINGS
We are involved in various legal and administrative proceedings and litigation arising in the ordinary course of business. The outcome of these matters is not predictable at this time. However, we believe that the ultimate resolution of these matters will not have a material adverse effect on our financial condition, results of operations or cash flows in future periods. Refer to Part II. Item 7. Management's Discussion and Analysis of Financial Condition and Results of Operations - Legal and Other Updates for discussion of other legal proceedings.
ITEM 4. MINE SAFETY DISCLOSURES
Not applicable.
53
PART II
ITEM 5. MARKET FOR REGISTRANT'S COMMON EQUITY, RELATED STOCKHOLDER MATTERS AND ISSUER PURCHASES OF EQUITY SECURITIES
Common Stock
Our common stock is traded on the TSX and NYSE under the symbol “ENB.” As at February 5, 2021, there were 2,025,495,603 holders of record of our common stock. A substantially greater number of holders of our common stock are "street name" or beneficial holders, whose shares are held by banks, brokers and other financial institutions.
Securities Authorized for Issuance Under Equity Compensation Plans
The information required by this Item will be contained in our Form 10-K/A, which will be filed no later than 120 days after December 31, 2020.
Recent Sales of Unregistered Equity Securities
None.
Issuer Purchases of Equity Securities
None.
Total Shareholder Return
The following graph reflects the comparative changes in the value from January 1, 2016 through December 31, 2020 of $100 invested in (1) Enbridge Inc.’s common shares traded on the TSX, (2) the S&P/TSX Composite index, (3) the S&P 500 index, (4) our US peer group (comprising CNP, D, DTE, DUK, EPD, ET, KMI, MMP, NEE, NI, OKE, PAA, PCG, SO, SRE and WMB) and (5) our Canadian peer group (comprising CU, FTS, IPL, PPL and TRP). The amounts included in the table were calculated assuming the reinvestment of dividends at the time dividends were paid.
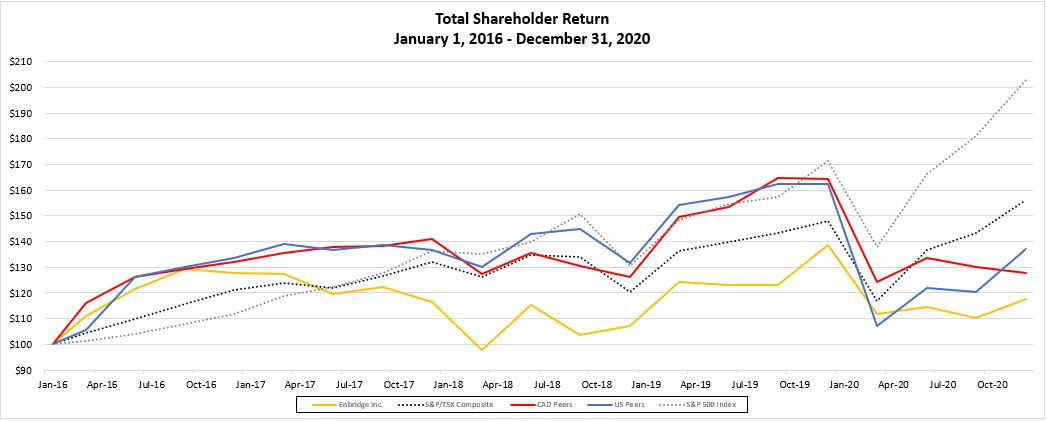
54
| January 1, 2016 | December 31, | |||||||||||||||||||
| 2016 | 2017 | 2018 | 2019 | 2020 | ||||||||||||||||
| Enbridge Inc. | 100.00 | 127.97 | 116.65 | 107.20 | 138.65 | 117.59 | ||||||||||||||
| S&P/TSX Composite | 100.00 | 121.08 | 132.09 | 120.36 | 147.89 | 156.17 | ||||||||||||||
| S&P 500 Index | 100.00 | 111.96 | 136.40 | 130.42 | 171.49 | 203.04 | ||||||||||||||
US Peers1 | 100.00 | 133.50 | 136.67 | 131.82 | 162.50 | 137.15 | ||||||||||||||
| Canadian Peers | 100.00 | 132.07 | 140.85 | 126.30 | 164.43 | 127.61 | ||||||||||||||
1 For the purpose of the graph, it was assumed that CAD:USD conversion ratio remained at 1:1 for the years presented.
55
ITEM 6. SELECTED FINANCIAL DATA
The following selected financial data is not necessarily indicative of results of future operations and should be read in conjunction with Item 7. Management’s Discussion and Analysis of Financial Condition and Results of Operations and Item 8. Financial Statements and Supplementary Data to fully understand factors that may affect the comparability of the information presented below.
| Years Ended December 31, | |||||||||||||||||
| 2020 | 2019 | 2018 | 2017 | 2016 | |||||||||||||
(millions of Canadian dollars, except per share amounts) | |||||||||||||||||
Consolidated Statements of Earnings | |||||||||||||||||
Operating revenues | $ | 39,087 | $ | 50,069 | $ | 46,378 | $ | 44,378 | $ | 34,560 | |||||||
Operating income | 7,957 | 8,260 | 4,816 | 1,571 | 2,581 | ||||||||||||
| Earnings | 3,416 | 5,827 | 3,333 | 3,266 | 2,309 | ||||||||||||
| Earnings attributable to noncontrolling interests and redeemable noncontrolling interests | (53) | (122) | (451) | (407) | (240) | ||||||||||||
Earnings attributable to controlling interests | 3,363 | 5,705 | 2,882 | 2,859 | 2,069 | ||||||||||||
| Earnings attributable to common shareholders | 2,983 | 5,322 | 2,515 | 2,529 | 1,776 | ||||||||||||
| Common Share Data | |||||||||||||||||
| Earnings per common share | |||||||||||||||||
Basic | 1.48 | 2.64 | 1.46 | 1.66 | 1.95 | ||||||||||||
Diluted | 1.48 | 2.63 | 1.46 | 1.65 | 1.93 | ||||||||||||
Dividends paid per common share | 3.24 | 2.95 | 2.68 | 2.41 | 2.12 | ||||||||||||
| December 31, | |||||||||||||||||
| 2020 | 2019 | 2018 | 2017 | 2016 | |||||||||||||
(millions of Canadian dollars) | |||||||||||||||||
Consolidated Statements of Financial Position | |||||||||||||||||
| Total assets | $ | 160,276 | $ | 163,157 | $ | 166,905 | $ | 162,093 | $ | 85,209 | |||||||
| Long-term debt | 62,819 | 59,661 | 60,327 | 60,865 | 36,494 | ||||||||||||
56
ITEM 7. MANAGEMENT'S DISCUSSION AND ANALYSIS OF FINANCIAL CONDITION AND RESULTS OF OPERATIONS
INTRODUCTION
The following discussion and analysis of our financial condition and results of operations is based on and should be read in conjunction with "Forward-Looking Information", Part I. Item 1A. Risk Factors and our consolidated financial statements and the accompanying notes included in Part II. Item 8. Financial Statements and Supplementary Data of this Annual Report on Form 10-K.
This section of our Annual Report on Form 10-K discusses 2020 and 2019 items and year-over-year comparisons between 2020 and 2019. For discussion of 2018 items and year-over-year comparisons between 2019 and 2018, refer to Part II. Item 7. Management's Discussion and Analysis of Financial Condition and Results of Operations of our Annual Report on Form 10-K for the year ended December 31, 2019.
RECENT DEVELOPMENTS
COVID-19 PANDEMIC, REDUCED CRUDE OIL DEMAND AND COMMODITY PRICES
The COVID-19 pandemic and the emergency response measures enacted by governments in Canada, the US and around the world, have caused material disruption to many businesses resulting in a severe slow down in Canadian, US and global economies, leading to increased volatility in financial and commodity markets worldwide and demand reduction for certain commodities.
We took proactive measures to deliver energy safely and reliably during the COVID-19 pandemic. We activated our crisis management team to focus on a number of priorities, including: (i) the health and safety of our employees and the public; (ii) operational reliability for our customers and markets; (iii) identification of essential personnel and procedures; and (iv) extensive stakeholder communication and outreach including updates to our Board of Directors. We are following recommendations from public health authorities and medical experts and have taken steps to help prevent our employees’ exposure to the spread of COVID-19, including, where practical, work-at-home plans enacted in March 2020 and the implementation of business continuity plans to enable the integrity of our operations and protect the health of our employees in pipeline control functions and service centers, our field representatives and other essential functions.
With respect to the safe operation of our facilities, we continue to employ all safety processes and procedures in the normal course. Our business continuity plans are designed to enable us to manage operational developments related to COVID-19 as they unfold. We provide an essential service across North America. Our customers, and the communities where we operate, depend on us to safely and reliably provide the energy they need to heat their homes and fuel their lives.
The COVID-19 pandemic has had a deep impact in the communities in which we operate. We are providing support in our communities by advancing funds to respond and provide relief to those who are most vulnerable. Our teams in our operating regions are working closely with our nonprofit community partners, our closest Indigenous and Tribal neighbors and local governments to identify where resources are needed most.
57
The COVID-19 pandemic has negatively impacted crude oil demand and increased commodity price volatility, which together present potential new or elevated risks to our business. In late March, we began to see impacts both on the supply of, and demand for, crude oil and other liquid hydrocarbons transported on our pipelines. Several shippers on our crude oil pipelines responded to significantly lower demand caused by the COVID-19 pandemic, declining storage availability and refinery utilization, and commodity price declines by reducing volumes beginning in the second quarter of 2020. In the third and fourth quarters of 2020, Mainline System volumes began to recover as fourth quarter volumes increased by approximately 200 thousand barrels per day (kbpd) when compared with significantly reduced volumes in the second quarter of 2020. Year-over-year, Mainline System throughput only decreased by approximately 80 kbpd. We anticipate a return to full utilization in 2021 as economic activity gradually resumes in North America. This view is supported by our expectation that the refineries operating in our core Mainline System markets (i.e. the US Midwest, Eastern Canada and the US Gulf Coast) will continue to experience higher utilization rates given their scale, complexity and cost competitiveness. For every 100 kbpd increase or decrease in volumes on our Mainline System, our revenues, net of power savings, are expected to increase or decline by approximately $35 million per quarter.
In our US Midstream business, our equity affiliate DCP Midstream, LP, responded to the drastic decline in commodity prices by decreasing their distributions to us by 50% (beginning with the first quarter distribution paid in May 2020), thereby modestly reducing our cash flows. As a further outcome of the drastic commodity price decline, we recorded a $1.7 billion impairment on our equity method investment in DCP Midstream in the first quarter of 2020, based on the decline in the market price of DCP Midstream, LP publicly-traded units as at March 31, 2020.
In addition, these circumstances have led to the deterioration of the credit profiles of some of our customers and suppliers. There have been no material defaults by customers or suppliers to date, however, we will continue to monitor this risk and take credit risk mitigating actions as appropriate.
The situation around the COVID-19 pandemic, reduced crude oil demand and reduced commodity prices is evolving and our assessment of risks is included in Part I. Item 1A. Risk Factors.
While the length and depth of the current energy demand reduction and its impact is challenging to estimate at this time, we have completed several actions to further strengthen our resiliency and position for the future, while assuring that the safety and reliability of our operations remains our first priority. We took actions to reduce operating costs by approximately $300 million in 2020, including reductions to employee, management and Board of Director compensation, a voluntary workforce reduction program, as well as supply chain savings. We have also executed approximately $400 million of asset sales and increased our available liquidity to approximately $13 billion. We experienced a natural slowing of 2020 capital spending in light of COVID-19 and the health and safety measures put into place by federal and regional governments. In addition, we believe that the following factors further demonstrate the resiliency of our low-risk business model:
•Our assets are highly contracted and commercially underpinned by long-term take-or-pay and cost-of-service agreements;
•Approximately 95% of our customer exposure is investment grade, investment grade equivalent or non-investment grade who have provided credit enhancements;
•The acquisition of Spectra Energy in 2017 provided us with greater diversification into natural gas with embedded low risk commercial structures. We currently have approximately 40 different sources of cash flows by geography and by different customer groups;
•A strong financial position with approximately $13 billion of net available liquidity which gives us the capacity to fund all of our capital projects and any debt maturities through 2021 without accessing the capital markets; and
•We limit the maximum cash flow loss that could arise from direct market price risks through a comprehensive long-term economic hedging program.
58
We will continue to actively monitor our business environment and may take further actions that we determine are in the best interests of Enbridge, our employees, customers, partners and stakeholders, or as required by federal, state or provincial authorities. At this time, given the many outstanding questions as to the length and depth of the COVID-19 pandemic and the current sustained low commodity price environment, the long term impact on us is uncertain; however, it is possible that they continue to have an adverse impact on our business and results of operations.
UNITED STATES LINE 3 REPLACEMENT PROGRAM UNDER CONSTRUCTION
The United States Line 3 Replacement Program (US L3R Program) is now under construction in Minnesota after receiving all necessary permits and approvals. The US L3R Program is a critical integrity project that will enhance the continued safe and reliable operations of our Mainline System well into the future, reflecting our long-standing commitment to protecting the environment.
For further details refer to Growth Projects - Liquids Pipelines - United States Line 3 Replacement Program.
MAINLINE SYSTEM CONTRACTING
On December 19, 2019, we submitted an application to the Canada Energy Regulator (CER) to implement contracting on our Mainline System. The application for contracted and uncommitted service included the associated terms, conditions and tolls of each service, which would be offered in an open season following approval by the CER.
On February 24, 2020, the CER issued a Notice of Public Hearing which outlined the process for participation in the hearing and identified a list of issues for discussion in the proceeding. In March 2020, letters were filed with the CER by a group of potential intervenors that requested the CER delay setting hearing dates associated with our Mainline System contract filing. Subsequently, the CER issued a letter requesting comments on the potential delay of proceedings.
We filed our response with the CER on May 1, 2020, and on May 19, 2020, the CER announced that the regulatory process for our proposal to offer contracted transportation service on our Mainline System will proceed in a single phase hearing process that balances the need to address COVID-19 pandemic related challenges and the CER's mandate to adjudicate in an appropriately expeditious manner.
We are currently in the midst of the regulatory process and expect an oral hearing to occur sometime after April 2021, but a hearing date has not yet been set. If a replacement agreement is not in place by June 30, 2021, the Competitive Tolling Settlement provides for tolls to continue on an interim basis.
GAS TRANSMISSION AND MIDSTREAM RATE PROCEEDINGS
Texas Eastern
On February 25, 2020, Texas Eastern Transmission, L.P. (Texas Eastern) received approval from the Federal Energy Regulatory Commission (FERC) of its uncontested rate case settlement with customers. In the first quarter of 2020, Texas Eastern recognized revenues from the settled rates retroactive to June 1, 2019, and put the settled rates into effect on April 1, 2020.
Algonquin
On July 2, 2020, Algonquin Gas Transmission, LLC (Algonquin) received approval from the FERC of its uncontested rate case settlement with customers. In the third quarter of 2020, Algonquin recognized revenues from the settled rates retroactive to June 1, 2020, and put the settled rates into effect on September 1, 2020.
59
BC Pipeline
In July 2020, the 2020-2021 rate settlement agreement with Westcoast Energy Inc.’s (Westcoast) British Columbia (BC) Pipeline shippers was approved by the CER. Following approval of the settlement, Westcoast applied and received approval from the CER on August 12, 2020 for the interim tolls to be made final, including the interim tolls from January 1, 2020 to March 31, 2020 as well as the revised interim tolls in effect as at April 1, 2020.
East Tennessee
East Tennessee Natural Gas, LLC filed a rate case in the second quarter of 2020 and customer settlement discussions commenced in the fourth quarter of 2020.
Maritimes & Northeast Pipeline
The US portion of Maritimes & Northeast Pipeline filed a rate case in the second quarter of 2020 and an agreement was reached in principle with shippers in December 2020. A Stipulation and Agreement will be filed in February 2021 and we will await FERC approval.
Alliance Pipeline
The US portion of Alliance Pipeline filed a rate case in the second quarter of 2020 and an agreement was reached in principle with shippers in January 2021. A Stipulation and Agreement will be filed in March 2021 and we will await FERC approval.
GAS DISTRIBUTION AND STORAGE RATE APPLICATIONS
2020 Rate Application
Enbridge Gas's rate applications are filed in two phases. As part of an Ontario Energy Board (OEB) Decision and Order issued in December 2019, Phase 1 of the application for 2020 rates, exclusive of funding for 2020 discrete incremental capital investments requested through the incremental capital module (ICM) mechanism, was approved effective January 1, 2020. Through a subsequent OEB Rate Order issued on June 11, 2020, Phase 2 of the application for 2020 rates, inclusive of requested 2020 ICM amounts, was approved effective October 1, 2020, and interim rates in effect from January 1, 2020 through September 30, 2020 were made final. The 2020 rate application, which represented the second year of a five-year term, was filed in accordance with the parameters of Enbridge Gas's OEB approved Price Cap Incentive Regulation (IR) rate setting mechanism.
2021 Rate Application
On June 30, 2020, Enbridge Gas filed Phase 1 of an application with the OEB for the setting of rates for 2021. The 2021 rate application was filed in accordance with the parameters of Enbridge Gas's OEB approved Price Cap IR rate setting mechanism and represents the third year of a five-year term. On October 6, 2020, Enbridge Gas filed a Phase 1 Settlement Proposal and draft Interim Rate Orders with the OEB, which were approved, on an interim basis effective January 1, 2021, on November 6, 2020. Phase 2 of the application addressing 2021 ICM funding requirements was filed on October 15, 2020.
FINANCING UPDATE
On February 20, 2020, we raised US$750 million of two-year floating rate notes in the US debt capital markets and on April 1, 2020, Enbridge Gas completed a $1.2 billion dual tranche offering of 10-year and 30-year notes in the Canadian debt capital markets. On May 12, 2020, we raised $1.3 billion with a dual tranche offering of 5-year and 7-year notes in the Canadian debt capital markets. On July 8, 2020, we raised an additional US$1.0 billion of 60-year hybrid subordinated notes in the US debt capital markets. Through these capital market activities, we completed our 2020 debt funding plan and strengthened our financial position.
60
In February 2020, we closed three new non-revolving credit facilities totaling US$1.5 billion and on March 31, 2020, we established a new syndicated one-year revolving credit facility in the amount of $1.7 billion. On April 9, 2020, we increased the amount of our new revolving facility by an additional $1.3 billion, bringing the total amount to $3.0 billion, significantly enhancing our available liquidity.
In July 2020, we extended approximately $10.0 billion of our 364 day extendible credit facilities to July 2022, inclusive of a one-year term out provision.
On October 1, 2020, we completed a private placement of US$300 million 20-year senior notes for Texas Eastern and early redeemed US$300 million senior notes originally due December 2020.
On February 10, 2021, we entered into a three year, sustainability linked credit facility for $1.0 billion with a syndicate of lenders. As a result of the sustainability linked credit facility and other financing activities completed in 2020, our resilient cash flows and our current liquidity position, we concurrently cancelled a one year, revolving, syndicated credit facility for $3.0 billion, ahead of its scheduled March 2021 maturity.
These financing activities, in combination with the asset monetization activities noted below, provide significant liquidity and we expect will enable us to fund our current portfolio of capital projects without requiring access to the capital markets through 2021 if market access is restricted or pricing is unattractive. Refer to Liquidity and Capital Resources.
ASSET MONETIZATION
Ozark Gas Transmission and Ozark Gas Gathering
On April 1, 2020, we closed the sale of our Ozark assets for cash proceeds of approximately $63 million.
Montana-Alberta Tie Line
On May 1, 2020, we closed the sale of our Montana-Alberta Tie-Line (MATL) transmission assets for cash proceeds of approximately $189 million.
Éolien Maritime France SAS
On May 1, 2020, we executed agreements to sell 49% of an entity that holds our 50% interest in Éolien Maritime France SAS (EMF) to the Canada Pension Plan Investment Board (CPP Investments) for initial proceeds in excess of $100 million. CPP Investments will fund their 49% share of all ongoing future development capital. Closing of the transaction is subject to customary regulatory approvals and is expected to occur in the first half of 2021. Refer to Growth Projects - Commercially Secured Projects - Renewable Power Generation.
TEXAS EASTERN PIPELINE RETURN-TO-SERVICE
On May 4, 2020, a rupture occurred on Line 10, a 30-inch natural gas pipeline that makes up part of the Texas Eastern natural gas pipeline system in Fleming County, Kentucky. There were no reported injuries or damaged structures as a result of the rupture.
In 2020, we undertook a comprehensive integrity program to ensure continued safe and reliable service. During the program, we reduced operating pressure across the Texas Eastern system to enable necessary integrity work to be completed. In the fourth quarter of 2020, we lifted the pressure restrictions and returned the system to service.
61
RESULTS OF OPERATIONS
| Year ended December 31, | |||||||||||
| 2020 | 2019 | 2018 | |||||||||
| (millions of Canadian dollars, except per share amounts) | |||||||||||
| Segment earnings before interest, income taxes and depreciation and amortization | |||||||||||
| Liquids Pipelines | 7,683 | 7,681 | 5,331 | ||||||||
| Gas Transmission and Midstream | 1,087 | 3,371 | 2,334 | ||||||||
| Gas Distribution and Storage | 1,748 | 1,747 | 1,711 | ||||||||
| Renewable Power Generation | 523 | 111 | 369 | ||||||||
| Energy Services | (236) | 250 | 482 | ||||||||
| Eliminations and Other | (113) | 429 | (708) | ||||||||
| Earnings before interest, income taxes and depreciation and amortization | 10,692 | 13,589 | 9,519 | ||||||||
| Depreciation and amortization | (3,712) | (3,391) | (3,246) | ||||||||
| Interest expense | (2,790) | (2,663) | (2,703) | ||||||||
| Income tax expense | (774) | (1,708) | (237) | ||||||||
Earnings attributable to noncontrolling interests and redeemable noncontrolling interests | (53) | (122) | (451) | ||||||||
| Preference share dividends | (380) | (383) | (367) | ||||||||
| Earnings attributable to common shareholders | 2,983 | 5,322 | 2,515 | ||||||||
| Earnings per common share | 1.48 | 2.64 | 1.46 | ||||||||
| Diluted earnings per common share | 1.48 | 2.63 | 1.46 | ||||||||
EARNINGS ATTRIBUTABLE TO COMMON SHAREHOLDERS
Year ended December 31, 2020 compared with year ended December 31, 2019
Earnings Attributable to Common Shareholders were negatively impacted by $1.9 billion due to certain unusual, infrequent or other non-operating factors, primarily explained by the following:
•a non-cash, unrealized derivative fair value gain of $856 million ($646 million after-tax) in 2020, compared with a gain of $1.6 billion ($1.2 billion after-tax) in 2019, reflecting net fair value gains and losses arising from changes in the mark-to-market value of derivative financial instruments used to manage foreign exchange risks;
•a combined loss of $2.1 billion ($1.6 billion after-tax) related to our equity method investment in DCP Midstream, LLC (DCP Midstream) due to a loss of $1.7 billion ($1.3 billion after-tax) resulting from an impairment to the carrying value of our investment and a loss of $324 million ($244 million after-tax) in 2020, compared with $86 million ($68 million after-tax) in 2019 resulting from further asset and goodwill impairment losses within DCP Midstream;
•a combined loss of $615 million ($452 million after-tax) in 2020 resulting from impairments to the carrying value of our equity method investments in Southeast Supply Header (SESH) and Steckman Ridge, LP (Steckman Ridge);
•a loss of $159 million ($119 million after-tax) in 2020 resulting from the February 2020 Texas Eastern rate settlement that re-established the Excess Accumulated Deferred Income Tax (EDIT) regulated liability that was previously eliminated in December 2018; and
•employee severance, transition and transformation costs of $339 million ($256 million after-tax) in 2020, compared with $135 million ($123 million after-tax) in 2019.
62
The factors above were partially offset by the absence in 2020 of the following:
•a loss of $467 million after-tax attributable to us ($268 million loss on sale and $199 million tax expense) in 2019 resulting from the sale of the federally regulated portion of our Canadian natural gas gathering and processing businesses;
•a loss of $310 million ($229 million after-tax) in 2019 resulting from the review of our comprehensive long-term economic hedging program and a payment to certain hedge counterparties to pre-settle and reset the hedge rate on a portion of our hedging program;
•a loss of $297 million ($218 million after-tax) in 2019 resulting from the classification of our MATL assets as held for sale and the subsequent measurement at the lower of their carrying value or fair value less costs to sell; and
•a loss of $105 million ($79 million after-tax) in 2019 resulting from the write-off of project costs related to the Access Northeast pipeline project.
The non-cash, unrealized derivative fair value gains and losses discussed above generally arise as a result of a comprehensive long-term economic hedging program to mitigate interest rate, foreign exchange and commodity price risks. This program creates volatility in reported short-term earnings through the recognition of unrealized non-cash gains and losses on financial derivative instruments used to hedge these risks. Over the long-term, we believe our hedging program supports the reliable cash flows and dividend growth upon which our investor value proposition is based.
After taking into consideration the factors above, the remaining $447 million decrease in earnings attributable to common shareholders is primarily explained by the following significant business factors:
•decreased earnings from our Energy Services segment due to the significant compression of location and quality differentials in certain markets and fewer opportunities to achieve profitable transportation margins on facilities where we hold capacity obligations;
•decreased contributions from our Liquids Pipelines segment due to lower volume demand resulting from the COVID-19 pandemic impact on supply and demand for crude oil and related products primarily during the second and third quarters of 2020;
•the absence of earnings in 2020 from the federally-regulated portion of our Canadian natural gas gathering and processing businesses which were sold on December 31, 2019;
•decreased earnings from our Gas Distribution and Storage segment due to warmer weather experienced in our franchise areas; and
•higher depreciation and amortization expense, in addition to reduced capitalized interest, as a result of new assets placed into service throughout 2019 and 2020, primarily the Canadian portion of the Line 3 Replacement Program (Canadian L3R Program).
The business factors above were partially offset by the following positive factors:
•stronger contributions from our Liquids Pipelines segment due to a higher International Joint Tariff (IJT) Benchmark Toll;
•increased earnings from our Gas Transmission and Midstream segment due to increased rates on Texas Eastern and Algonquin resulting from 2020 rate settlements;
•increased earnings from our Gas Distribution and Storage segment due to higher distribution charges resulting from increases in rates and customer base;
•increased earnings from new Liquids Pipelines, Gas Transmission and Midstream, and Renewable Power Generation assets that were placed into service throughout 2019 and 2020; and
•lower operating and administrative costs in 2020 as a result of cost containment actions.
REVENUES
We generate revenues from three primary sources: transportation and other services, gas distribution sales and commodity sales.
63
Transportation and other services revenues of $16.2 billion, $16.6 billion and $14.4 billion for the years ended December 31, 2020, 2019 and 2018, respectively, were earned from our crude oil and natural gas pipeline transportation businesses and also include power generation revenues from our portfolio of renewable and power generation assets. For our transportation assets operating under market-based arrangements, revenues are driven by volumes transported and the corresponding tolls for transportation services. For assets operating under take-or-pay contracts, revenues reflect the terms of the underlying contract for services or capacity. For rate-regulated assets, revenues are charged in accordance with tolls established by the regulator, and in most cost-of-service based arrangements are reflective of our cost to provide the service plus a regulator-approved rate of return.
Gas distribution sales revenues of $3.7 billion, $4.2 billion and $4.4 billion for the years ended December 31, 2020, 2019 and 2018, respectively, were recognized in a manner consistent with the underlying rate-setting mechanism mandated by the regulator. Revenues generated by the gas distribution businesses are primarily driven by volumes delivered, which vary with weather and customer composition and utilization, as well as regulator-approved rates. The cost of natural gas is passed through to customers through rates and does not ultimately impact earnings due to its flow-through nature.
Commodity sales of $19.3 billion, $29.3 billion and $27.7 billion for the years ended December 31, 2020, 2019 and 2018, respectively, were generated primarily through our Energy Services operations. Energy Services includes the contemporaneous purchase and sale of crude oil, natural gas, power and Natural Gas Liquids (NGLs) to generate a margin, which is typically a small fraction of gross revenue. While sales revenue generated from these operations are impacted by commodity prices, net margins and earnings are relatively insensitive to commodity prices and reflect activity levels which are driven by differences in commodity prices between locations, grades and points in time, rather than on absolute prices. Any residual commodity margin risk is closely monitored and managed. Revenues from these operations depend on activity levels, which vary from year-to-year depending on market conditions and commodity prices.
Our revenues also include changes in unrealized derivative fair value gains and losses related to foreign exchange and commodity price contracts used to manage exposures from movements in foreign exchange rates and commodity prices. The mark-to-market accounting creates volatility and impacts the comparability of revenues in the short-term, but we believe over the long-term, the economic hedging program supports reliable cash flows.
64
BUSINESS SEGMENTS
LIQUIDS PIPELINES
| 2020 | 2019 | 2018 | |||||||||
| (millions of Canadian dollars) | |||||||||||
Earnings before interest, income taxes and depreciation and amortization | 7,683 | 7,681 | 5,331 | ||||||||
Year ended December 31, 2020 compared with year ended December 31, 2019
EBITDA was negatively impacted by $139 million due to certain unusual, infrequent or other non-operating factors, primarily explained by a non-cash, unrealized gain of $545 million in 2020 compared with a gain of $976 million in 2019 reflecting net fair value gains and losses arising from changes in the mark-to-market value of derivative financial instruments used to manage foreign exchange risks. This negative factor was partially offset by the absence in 2020 of a loss of $310 million in 2019 resulting from the review of our comprehensive long-term economic hedging program and a payment to certain hedge counterparties to pre-settle and reset the hedge rate on a portion of our hedging program.
After taking into consideration the factors above, the remaining $141 million increase is primarily explained by the following significant business factors:
•contributions from the Canadian L3R Program that was placed into service on December 1, 2019 with an interim surcharge on Mainline System volumes of US$0.20 per barrel for the IJT Benchmark Toll;
•a higher average IJT Benchmark Toll on our Mainline System of US$4.24 in 2020 compared with US$4.18 in 2019; and
•higher Flanagan South Pipeline throughput and contribution.
The positive business factors above were partially offset by:
•lower Mainline System ex-Gretna throughput of 2,622 kbpd in 2020 compared with 2,705 kbpd in 2019 due to lower volume demand resulting from the COVID-19 pandemic impact on supply and demand for crude oil and related products primarily during the second and third quarters of 2020; and
•lower spot throughput on our Bakken Pipeline System and Seaway Crude Pipeline System driven by the significant impact of lower crude oil prices and the COVID-19 pandemic on supply and demand for crude oil and related products primarily during the second and third quarters of 2020.
65
GAS TRANSMISSION AND MIDSTREAM
| 2020 | 2019 | 2018 | |||||||||
| (millions of Canadian dollars) | |||||||||||
| Earnings before interest, income taxes and depreciation and amortization | 1,087 | 3,371 | 2,334 | ||||||||
Year ended December 31, 2020 compared with year ended December 31, 2019
EBITDA was negatively impacted by $2.3 billion due to certain unusual, infrequent or other non-operating factors primarily explained by the following:
•a combined loss of $2.1 billion related to our equity method investment in DCP Midstream due to a loss of $1.7 billion resulting from an impairment to the carrying value of our investment and a loss of $324 million in 2020, compared with $86 million in 2019 resulting from further asset and goodwill impairment losses within DCP Midstream;
•a combined loss of $615 million in 2020 resulting from impairments to the carrying value of our equity method investments in SESH and Steckman Ridge; and
•a loss of $159 million in 2020 resulting from the February 2020 Texas Eastern rate settlement that re-established the EDIT regulated liability that was previously eliminated in December 2018.
The factors above were partially offset by the following positive factors:
•the absence in 2020 of a loss of $268 million in 2019 resulting from the sale of the federally regulated portion of our Canadian natural gas gathering and processing businesses; and
•the absence in 2020 of a loss of $105 million in 2019 resulting from the write-off of project costs related to the Access Northeast Pipeline project.
After taking into consideration the factors above, the remaining $27 million increase is primarily explained by the following significant business factors:
•higher revenues from increased rates on Texas Eastern and Algonquin resulting from 2020 rate settlements; and
•contributions from the Stratton Ridge project and the second phase of the Atlantic Bridge project that were placed into service in the second and fourth quarters of 2019, respectively.
The positive business factors above were partially offset by:
•the absence of earnings in 2020 from the federally-regulated portion of our Canadian natural gas gathering and processing businesses which were sold on December 31, 2019;
•lower revenues on our US Gas Transmission assets due to pressure restrictions on Texas Eastern;
•narrowed AECO-Chicago basis at our Alliance Pipeline joint venture; and
•lower commodity prices impacting our Aux Sable joint venture.
66
GAS DISTRIBUTION AND STORAGE
| 2020 | 2019 | 2018 | |||||||||
| (millions of Canadian dollars) | |||||||||||
Earnings before interest, income taxes and depreciation and amortization | 1,748 | 1,747 | 1,711 | ||||||||
Year ended December 31, 2020 compared with year ended December 31, 2019
EBITDA was positively impacted by $1 million primarily explained by the following significant business factors:
•higher distribution charges resulting from increases in rates and customer base; and
•synergy capture realized from the amalgamation of Enbridge Gas Distribution Inc. (EGD) and Union Gas Limited (Union Gas).
The positive business factors above were partially offset by the following factors:
•warmer weather experienced in our franchise service areas in 2020 when compared with the colder than normal weather experienced in 2019. When compared with the normal weather forecast embedded in rates, the warmer weather in 2020 negatively impacted 2020 EBITDA by approximately $33 million while the colder weather in 2019 positively impacted 2019 EBITDA by approximately $67 million; and
•the absence of earnings in 2020 from Enbridge Gas New Brunswick Limited Partnership and Enbridge Gas New Brunswick Inc. (collectively, EGNB) and St. Lawrence Gas Company, Inc. (St. Lawrence Gas) which were sold on October 1, 2019 and November 1, 2019, respectively.
RENEWABLE POWER GENERATION
| 2020 | 2019 | 2018 | |||||||||
| (millions of Canadian dollars) | |||||||||||
Earnings before interest, income taxes and depreciation and amortization | 523 | 111 | 369 | ||||||||
Year ended December 31, 2020 compared with year ended December 31, 2019
EBITDA was positively impacted by $329 million due to certain unusual, infrequent or other non-operating factors, primarily explained by the absence in 2020 of a loss of $297 million in 2019 resulting from the classification of our MATL assets as held for sale and the subsequent measurement at the lower of their carrying value or fair value less costs to sell.
After taking into consideration the factors above, the remaining $83 million increase is primarily explained by the following significant business factors:
•contributions from the Hohe See Offshore Wind Project, which reached full operating capacity in October 2019 and the Albatros expansion, which was placed into service in January 2020;
•stronger wind resources at Canadian and US wind facilities; and
•reimbursements received at certain Canadian wind facilities resulting from a change in operator.
67
ENERGY SERVICES
| 2020 | 2019 | 2018 | |||||||||
| (millions of Canadian dollars) | |||||||||||
Earnings/(loss) before interest, income taxes and depreciation and amortization | (236) | 250 | 482 | ||||||||
EBITDA from Energy Services is dependent on market conditions and results achieved in one period may not be indicative of results to be achieved in future periods.
Year ended December 31, 2020 compared with year ended December 31, 2019
EBITDA was negatively impacted by $98 million due to certain unusual, infrequent or other non-operating factors, explained by the following:
•a non-cash, net positive adjustment to crude oil and natural gas inventories of $5 million in 2020 compared with a net positive adjustment of $91 million in 2019; and
•a non-cash, unrealized loss of $122 million in 2020, compared with a loss of $110 million in 2019, reflecting the revaluation of derivatives used to manage the profitability of transportation and storage transactions, as well as manage the exposure to movements in commodity prices.
After taking into consideration the factors above, the remaining $388 million decrease reflects the significant compression of location and quality differentials in certain markets and fewer opportunities to achieve profitable transportation margins on facilities in which Energy Services holds capacity obligations, partially offset by favorable storage opportunities.
ELIMINATIONS AND OTHER
| 2020 | 2019 | 2018 | |||||||||
| (millions of Canadian dollars) | |||||||||||
Earnings/(loss) before interest, income taxes and depreciation and amortization | (113) | 429 | (708) | ||||||||
Eliminations and Other includes operating and administrative costs which are not allocated to business segments and the impact of foreign exchange hedge settlements. Eliminations and Other also includes the impact of new business development activities and corporate investments.
Year ended December 31, 2020 compared with year ended December 31, 2019
EBITDA was negatively impacted by $678 million due to certain unusual, infrequent or other-non-operating factors, primarily explained by the following:
•a non-cash, unrealized gain of $318 million in 2020 compared with a gain of $671 million in 2019 reflecting net fair value gains and losses arising from the change in the mark-to-market value of derivative financial instruments used to manage foreign exchange risk;
•employee severance, transition and transformation costs of $279 million in 2020 compared with $84 million in 2019 primarily related to our voluntary workforce reduction program offered in the second quarter of 2020;
•a loss of $74 million in 2020 from non-cash changes in a corporate guarantee obligation; and
•a loss of $43 million in 2020 from the write-down of certain investments in emerging energy and other technologies.
68
After taking into consideration the factors above, the remaining $136 million increase is primarily explained by lower operating and administrative costs in 2020 as a result of cost containment actions and lower realized foreign exchange settlement losses.
GROWTH PROJECTS – COMMERCIALLY SECURED PROJECTS
The following table summarizes the status of our commercially secured projects, organized by business segment:
| Enbridge's Ownership Interest | Estimated Capital Cost1 | Expenditures to Date2 | Status | Expected In-Service Date | ||||||||||||||||
| (Canadian dollars, unless stated otherwise) | ||||||||||||||||||||
| LIQUIDS PIPELINES | ||||||||||||||||||||
| 1. | Canadian Line 3 Replacement Program | 100 | % | $5.3 billion | $5.0 billion | Complete | In-service | |||||||||||||
| 2. | United States Line 3 Replacement Program | 100 | % | US$4.0 billion | US$2.0 billion | Under construction | Q4 - 2021 | |||||||||||||
| 3. | Southern Access Expansion3 | 100 | % | US$0.5 billion | US$0.5 billion | Under construction | Q4 - 2021 | |||||||||||||
| 4. | Other - United States | 100 | % | US$0.1 billion | US$0.1 billion | Under construction | Q1 - 2021 | |||||||||||||
| GAS TRANSMISSION AND MIDSTREAM | ||||||||||||||||||||
| 5. | T-South Reliability & Expansion Program | 100 | % | $1.0 billion | $0.7 billion | Under construction | Q4 - 2021 | |||||||||||||
| 6. | Spruce Ridge Project4 | 100 | % | $0.5 billion | $0.2 billion | Under construction | Q4 - 2021 | |||||||||||||
| 7. | Other - United States5 | Various | US$1.0 billion | US$0.5 billion | Various stages | 2020 - 2023 | ||||||||||||||
| GAS DISTRIBUTION AND STORAGE | ||||||||||||||||||||
| 8. | Windsor Line Replacement & Owen Sound Reinforcement | 100 | % | $0.2 billion | $0.1 billion | Various stages | In-service | |||||||||||||
| 9. | London Line Replacement Project | 100 | % | $0.2 billion | No significant expenditures to date | Pre-construction | 2H - 2021 | |||||||||||||
| 10. | Storage Enhancements | 100 | % | $0.1 billion | No significant expenditures to date | Pre-construction | 2021 - 2022 | |||||||||||||
| RENEWABLE POWER GENERATION | ||||||||||||||||||||
| 11. | East-West Tie Line | 25.0 | % | $0.2 billion | $0.1 billion | Under construction | 1H - 2022 | |||||||||||||
| 12. | Saint-Nazaire France Offshore Wind Project6 | 25.5 | % | $0.9 billion | $0.1 billion | Under construction | 2H - 2022 | |||||||||||||
| (€0.6 billion) | (€0.1 billion) | |||||||||||||||||||
| 13. | Fécamp Offshore Wind Project7 | 17.9 | % | $0.7 billion | $0.1 billion | Under construction | 2023 | |||||||||||||
| (€0.5 billion) | (€0.1 billion) | |||||||||||||||||||
1 These amounts are estimates and are subject to upward or downward adjustment based on various factors. Where appropriate, the amounts reflect our share of joint venture projects.
69
2 Expenditures to date reflect total cumulative expenditures incurred from inception of the project up to December 31, 2020.
3 The status and in-service date will coincide with the status and in-service date of the US L3R Program.
4 Expenditures were revised in the second quarter of 2020 due to scope modifications.
5 Includes the US$0.1 billion Sabal Trail Phase II project placed into service in the second quarter of 2020 and the US$0.1 Atlantic Bridge Phase III project placed into service in January 2021.
6 Reflects the sale of 49% of an entity that holds our 50% interest in EMF to CPP Investments which is expected to close in the first half of 2021. After closing, our equity contribution will be $0.15 billion, with the remainder of the project financed through non-recourse project level debt.
7 Reflects the sale of 49% of an entity that holds our 50% interest in EMF to CPP Investments which is expected to close in the first half of 2021. After closing, our equity contribution will be $0.10 billion, with the remainder of the project financed through non-recourse project level debt.
Risks related to the development and completion of growth projects are described under Part I. Item 1A. Risk Factors.
70
LIQUIDS PIPELINES

71
The following commercially secured growth projects are expected to be placed into service in 2021:
•United States Line 3 Replacement Program - replacement of the existing Line 3 crude oil pipeline between Neche, North Dakota and Superior, Wisconsin. The US L3R Program will support the safety and operational reliability of the Mainline System, enhance system flexibility and allow us to optimize throughput on the mainline. The US L3R Program is expected to restore the original capacity of 760 kbpd and bring the total Mainline System capacity to approximately 3.2 million barrels per day (bpd). The Wisconsin portion of the US L3R Program is in service. The Minnesota portion is now under construction after receiving all necessary permits and approvals. While complete, the North Dakota portion will be placed into service when Minnesota construction concludes.
Estimated capital costs for the Line 3 Replacement Program, including the Canadian segment already in service, have been updated from $8.2 billion to $9.3 billion (in source currency). The increase in costs reflects winter construction, further enhancements to industry-leading environmental protections and construction techniques, the extended regulatory and permitting timeframe, higher capitalized interest and COVID-19 protocols.
Upon the Line 3 Replacement Program being placed fully into service a surcharge of US$0.895 per barrel will be applied, inclusive of the current interim US$0.20 surcharge for the Canadian portion of Line 3. In addition, incremental throughput related to the restored Line 3 capacity will receive an international joint toll charge for each barrel.
For additional regulatory updates on the project, refer to Growth Projects - Regulatory Matters - United States Line 3 Replacement Program.
•Southern Access Expansion - an expansion of our existing Southern Access crude oil pipeline from 996 kbpd to approximately 1,200 kbpd.
72
GAS TRANSMISSION AND MIDSTREAM

73
The following commercially secured growth project was placed into service in 2020:
•Sabal Trail Phase II - an expansion of our existing Sabal Trail pipeline through the addition of two new greenfield compressor stations in Albany, Georgia and Dunnellon, Florida.
The following commercially secured growth projects are expected to be placed into service in 2021:
•Atlantic Bridge Phase III - an expansion of the Algonquin natural gas transmission systems to transport 133 million cubic feet per day (mmcf/d) of natural gas to the New England region. The third and final phase of Atlantic Bridge fully commenced service in January 2021 with the Weymouth compressor station being brought online.
•T-South Reliability & Expansion Program - a natural gas pipeline expansion of Westcoast's BC Pipeline in southern BC that will provide improved compressor reliability and additional capacity of approximately 190 mmcf/d into the Huntington/Sumas market at the US/Canada border. The projects were approved by the CER in September 2019 and has phased in-service dates with final completion in the fourth quarter of 2021.
•Spruce Ridge Project - a natural gas pipeline expansion of Westcoast's BC Pipeline in northern BC. The project will provide additional capacity of up to 402 mmcf/d. Due to commercial delays, the revised expected in-service date is the fourth quarter of 2021.
74
GAS DISTRIBUTION AND STORAGE

The following commercially secured growth projects were placed into service in 2020:
•Windsor Line Replacement & Owen Sound Reinforcement Projects - replacement of approximately 64-kilometers of the existing Windsor Line with a new 6-inch natural gas pipeline and the reinforcement of the Owen Sound System through the construction of 34-kilometers of 12-inch natural gas pipeline in southwestern Ontario. Although the Windsor Line Replacement was placed into service, there is continuing work on the west portion to be completed in 2021.
The following commercially secured growth project is expected to be placed into service in 2021:
•London Line Replacement Project - a project that will replace the two current pipelines known collectively as the London Line and includes the construction of approximately 90.5-kilometers of natural gas pipeline and ancillary facilities in southern Ontario.
The following commercially secured growth project is expected to be placed into service in two phases, occurring in 2021 and 2022:
•Storage Enhancements - an enhancement of our unregulated storage facilities at Dawn, Ontario.
In October 2020, due to changes in demand and uncertainties resulting from the COVID-19 pandemic, Enbridge Gas withdrew the Dawn-Parkway Expansion leave to construct application with the OEB. Enbridge Gas will continue to assess demand requirements for the expansion and refile as needed in the future.
75
RENEWABLE POWER GENERATION

76
The following commercially secured growth projects are expected to be placed into service in 2022:
•East-West Tie Line - a transmission project that will parallel an existing double-circuit, 230 kilovolt transmission line that connects the Wawa Transformer Station to the Lakehead Transformer Station near Thunder Bay, Ontario, including a connection midway in Marathon, Ontario.
•Saint-Nazaire Offshore Wind Project - a wind project located off the west coast of France that is expected to generate approximately 480-megawatts (MW). Project revenues are backed by a 20-year fixed price power purchase agreement (PPA) with added power production protection.
The following commercially secured growth project is expected to be placed into service in 2023:
•Fécamp Offshore Wind Project - an offshore wind project that will be comprised of 71 wind turbines located off the northwest coast of France and is expected to generate approximately 500-MW. Project revenues are underpinned by a 20-year fixed price PPA.
On May 1, 2020, we executed agreements to sell 49% of an entity that holds our 50% interest in EMF to CPP Investments, inclusive of the Saint-Nazaire France Offshore Wind Project, the Fécamp Offshore Wind Project and the Courseulles-sur-Mer Offshore Wind Project. CPP Investments will fund their 49% share of all ongoing future development capital. The transaction is expected to close in the first half of 2021.
GROWTH PROJECTS - REGULATORY MATTERS
United States Line 3 Replacement Program
On February 3, 2020, and through its subsequent order on May 1, 2020, the Minnesota Public Utilities Commission (MNPUC) deemed the second revised final Environmental Impact Statement (EIS) adequate and reinstated the Certificate of Need and Route Permit, allowing for construction of the pipeline to commence following the issuance of required permits. On May 21, 2020, various parties filed petitions for reconsideration with the MNPUC contesting the adequacy of the EIS and the MNPUC’s restored grant of the Certificate of Need and Route Permit. On June 1, 2020, Enbridge and various supporting parties filed responses to those filed petitions for reconsideration. On June 25, 2020 the MNPUC denied all petitions for reconsideration reaffirming its prior decisions in all three dockets. After each environmental permitting agency issued their respective permits, the MNPUC issued its Authorization to Construct to Enbridge. Currently, construction in Minnesota continues despite the EIS, Certificate of Need and Route Permit undergoing appellate review; however judicial decisions may impact construction activities.
As for environmental permits, we have received all Minnesota Department of Natural Resources licenses and permits. The Minnesota Pollution Control Agency (MPCA) released a draft of the revised 401 Water Quality Certificate (WQC) in February 2020. Following a public comment period, the MPCA announced on June 3, 2020 that it would conduct a contested case hearing regarding the 401 Water Quality Certificate. After an Administrative Law Judge (ALJ) was assigned to the case, the contested case hearing schedule was established on June 23, 2020. The MPCA contested case hearing was completed in August and on October 16, 2020, the MPCA received a favorable recommendation from the ALJ on all five of the issues considered. On November 12, 2020, the MPCA Commissioner issued a 401 WQC to us. Subsequently, the United States Army Corps of Engineers (Army Corps) issued its 404 Permit. With all required permits received, we commenced construction on December 1, 2020. Currently, construction in Minnesota continues despite the 401 WQC and the 404 Permit undergoing appellate review; however judicial decisions may impact construction activities.
77
SOLAR SELF-POWER PROJECTS
Lambertville Compressor Station
In October 2020, we announced the completion of project development and construction of the first solar power plant in the US designed to directly help power an interstate natural gas pipeline compressor station. The 2.25-MW solar project, located in West Amwell Township, New Jersey, will provide solar energy to the Texas Eastern Lambertville compressor station.
Alberta Solar One
In October 2020, we announced the start of construction on our first solar generation facility in Alberta. The 10.5-MW solar project, located near Burdett, Alberta, will produce a portion of our Canadian Mainline power requirements with solar energy. The project is expected to achieve commercial operations in the first quarter of 2021.
Heidlersburg Compressor Station
In November 2020, we announced the start of construction on the Heidlersburg solar project. The project will produce 2.5-MW of solar energy for our Heidlersburg compressor station, offsetting a portion of the station’s electric load and helping power the compressor units that keep gas flowing along our Texas Eastern pipeline. The project is expected to achieve commercial operations in the second quarter of 2021.
OTHER ANNOUNCED PROJECTS UNDER DEVELOPMENT
The following projects have been announced by us, but have not yet met our criteria to be classified as commercially secured:
LIQUIDS PIPELINES
•Sea Port Oil Terminal Project - the Sea Port Oil Terminal (SPOT) project consists of onshore and offshore facilities, including a fixed platform located approximately 30 miles off the coast of Brazoria County, Texas. SPOT is designed to load very large crude carriers at rates of approximately 85,000 barrels per hour, or up to approximately 2 million bpd. Along with Enterprise Products Partners, L.P., we announced our intent to jointly develop and market SPOT, and we will work to finalize an equity participation agreement. The agreement will allow us to purchase an ownership interest in SPOT, subject to SPOT receiving a deep-water port license.
•Jones Creek Crude Oil Storage Terminal - the Jones Creek terminal is expected to have an ultimate capability of up to 15 million barrels of storage, access to crude oil from all major North American production basins and will be fully integrated with the Seaway Pipeline system to allow for access to Houston-area refineries, existing export facilities, the SPOT project and other facilities in the future.
GAS TRANSMISSION AND MIDSTREAM
•Rio Bravo Pipeline - the Rio Bravo Pipeline is designed to transport up to 4.5 billion cubic feet per day (bcf/d) of natural gas from the Agua Dulce supply area to NextDecade's Rio Grande liquefied natural gas (LNG) export facility in the Port of Brownsville, Texas. We have acquired the Rio Bravo Pipeline development project from NextDecade. In addition, we have executed a precedent agreement with NextDecade under which we will provide firm transportation capacity on the Rio Bravo Pipeline to NextDecade's Rio Grande LNG export facility for a term of at least twenty years. Construction of the pipeline will be subject to the Rio Grande LNG export facility reaching a final investment decision.
78
•Annova LNG - we have executed a precedent agreement to supply the 6.5 million tonnes per annum Annova LNG export facility in the Port of Brownsville, Texas for a term of at least twenty years, by expanding our existing Valley Crossing system. The expansion will be subject to the Annova LNG facility reaching a final investment decision.
•Texas Eastern Venice Extension Project - a reversal and expansion of Texas Eastern’s Line 40 from its existing New Roads compressor station to a new delivery point with the proposed Gator Express pipeline just south of Texas Eastern’s Larose compressor station. The project is expected to deliver 1.26 bcf/d of feed gas to Venture Global’s proposed Plaquemines LNG export facility located in Plaquemine Parish, Louisiana. The expansion will be subject to the Plaquemines LNG export facility reaching a final investment decision.
RENEWABLE POWER GENERATION
•Courseulles-sur-Mer Offshore Wind Project - an offshore wind project located off the northwest coast of France that is expected to generate approximately 448-MW. Project revenues are underpinned by a 20-year fixed price PPA. We expect to reach a final investment decision in 2021.
We also have a portfolio of additional projects under development that have not yet progressed to the point of securement.
LIQUIDITY AND CAPITAL RESOURCES
The maintenance of financial strength and flexibility is fundamental to our growth strategy, particularly in light of the significant number and size of capital projects currently secured or under development. Access to timely funding from capital markets could be limited by factors outside our control, including but not limited to financial market volatility resulting from economic and political events both inside and outside North America. To mitigate such risks, we actively manage financial plans and strategies to ensure we maintain sufficient liquidity to meet routine operating and future capital requirements. In the near term, we generally expect to utilize cash from operations together with commercial paper issuance and/or credit facility draws and the proceeds of capital market offerings to fund liabilities as they become due, finance capital expenditures, fund debt retirements and pay common and preference share dividends. We target to maintain sufficient liquidity through securement of committed credit facilities with a diversified group of banks and financial institutions to enable us to fund all anticipated requirements for approximately one year without accessing the capital markets.
Our financing plan is regularly updated to reflect evolving capital requirements and financial market conditions and identifies a variety of potential sources of debt and equity funding alternatives. Our current financing plan does not include any issuances of additional common equity and was the primary consideration for the suspension of our Dividend Reinvestment and Share Purchase Plan in November 2018.
As discussed within Recent Developments - Financing Update, as a result of the COVID-19 pandemic and the corresponding impact on the capital markets, we have elected to increase our liquidity through additional credit facilities to ensure we will not have to access the capital markets through 2021 to fund our current portfolio of capital projects if market access is restricted or pricing is unattractive.
79
CAPITAL MARKET ACCESS
We ensure ready access to capital markets, subject to market conditions, through maintenance of shelf prospectuses that allow for issuance of long-term debt, equity and other forms of long-term capital when market conditions are attractive. In accordance with our funding plan, we completed the following long-term debt issuances totaling $2.5 billion and US$2.1 billion in 2020:
| Entity | Type of Issuance | Amount | ||||||
| (in millions of Canadian dollars, unless stated otherwise) | ||||||||
| Enbridge Inc. | Medium-term notes | $1,300 | ||||||
| Enbridge Inc. | Floating rate notes | US$750 | ||||||
| Enbridge Inc. | Fixed-to-fixed subordinated term notes | US$1,000 | ||||||
| Enbridge Gas Inc. | Medium-term notes | $1,200 | ||||||
Spectra Energy Partners, LP1 | Senior notes | US$300 | ||||||
1Issued through Texas Eastern, a wholly-owned operating subsidiary of Spectra Energy Partners, LP (SEP).
Credit Facilities, Ratings and Liquidity
To ensure ongoing liquidity and to mitigate the risk of capital market disruption, we maintain ready access to funds through committed bank credit facilities and actively manage our bank funding sources to optimize pricing and other terms. The following table provides details of our committed credit facilities at December 31, 2020:
| Total | ||||||||||||||
| Maturity | Facilities | Draws1 | Available | |||||||||||
| (millions of Canadian dollars) | ||||||||||||||
| Enbridge Inc. | 2021-2024 | 11,854 | 8,719 | 3,135 | ||||||||||
| Enbridge (U.S.) Inc. | 2022-2024 | 7,007 | 492 | 6,515 | ||||||||||
| Enbridge Pipelines Inc. | 20222 | 3,000 | 1,278 | 1,722 | ||||||||||
| Enbridge Gas Inc. | 20222 | 2,000 | 1,121 | 879 | ||||||||||
| Total committed credit facilities | 23,861 | 11,610 | 12,251 | |||||||||||
1Includes facility draws and commercial paper issuances that are back-stopped by the credit facility.
2Maturity date is inclusive of the one-year term out option.
On February 24, 2020, Enbridge Inc. entered into a two year, non-revolving credit facility for US$1.0 billion with a syndicate of lenders.
On February 25, 2020, Enbridge Inc. entered into two, one year, non-revolving, bilateral credit facilities for a total of US$500 million.
On March 31, 2020, Enbridge Inc. entered into a one year, revolving, syndicated credit facility for $1.7 billion. On April 9, 2020, Enbridge Inc. exercised an accordion provision and increased the facility to $3.0 billion.
On July 23 and 24, 2020, we extended approximately $10.0 billion of our 364 day extendible credit facilities to July 2022, inclusive of a one-year term out provision.
On February 10, 2021, we entered into a three year, sustainability linked credit facility for $1.0 billion with a syndicate of lenders. As a result of the sustainability linked credit facility and other financing activities completed in 2020, our resilient cash flows and our current liquidity position, we concurrently cancelled a one year, revolving, syndicated credit facility for $3.0 billion, ahead of its scheduled March 2021 maturity.
In addition to the committed credit facilities noted above, we have $849 million of uncommitted demand facilities, of which $533 million were unutilized as at December 31, 2020. As at December 31, 2019, we had $916 million of uncommitted credit facilities, of which $476 million were unutilized.
80
As at December 31, 2020, our net available liquidity totaled $12.7 billion, inclusive of $452 million of unrestricted Cash and cash equivalents as reported on the Consolidated Statements of Financial Position.
Our credit facility agreements and term debt indentures include standard events of default and covenant provisions, whereby accelerated repayment and/or termination of the agreements may result if we were to default on payment or violate certain covenants. As at December 31, 2020, we were in compliance with all debt covenants and expect to continue to comply with such covenants.
Strong growth in internal cash flow, proceeds from non-core asset dispositions, ready access to liquidity from diversified sources and a stable business model have enabled us to manage our credit profile. We actively monitor and manage key financial metrics with the objective of sustaining investment grade credit ratings from the major credit rating agencies and ongoing access to bank funding and term debt capital on attractive terms. Key measures of financial strength that are closely managed include the ability to service debt obligations from operating cash flow and the ratio of debt to EBITDA.
During 2020, our credit ratings were affirmed as follows:
•On July 23, 2020, DBRS Limited affirmed our issuer rating and medium-term notes and unsecured debentures rating of BBB (high), fixed-to-floating subordinated notes rating of BBB (low), preference share rating of Pfd-3 (high) and commercial paper rating of R-2 (high), all with stable outlooks;
•On April 13, 2020, Fitch Rating services affirmed long-term issuer default rating and senior unsecured debt rating of BBB+, preference share rating of BBB-, junior subordinated note rating of BBB- and short-term and commercial paper rating of F2 with a stable rating outlook;
•On December 22, 2020, Moody’s Investor Services, Inc. affirmed our issuer and senior unsecured ratings of Baa2, subordinated rating of Ba1 and preference share rating of Ba1 all with positive outlooks. In addition, the commercial paper rating for Enbridge (U.S.) Inc. was affirmed at P-2; and
•On December 1, 2020, Standard & Poor’s Rating Services (S&P) affirmed our corporate credit rating and senior unsecured debt rating of BBB+, preference share rating of P-2 (low) and commercial paper rating of A-1 (low) and reaffirmed a stable outlook. S&P also affirmed our global overall short-term rating of A-2.
There are no material restrictions on our cash. Total restricted cash of $38 million, as reported on the Consolidated Statements of Financial Position, primarily includes cash collateral and future pipeline abandonment costs collected and held in trust. Cash and cash equivalents held by certain subsidiaries may not be readily accessible for alternative use by us.
Excluding current maturities of long-term debt, as at December 31, 2020 and 2019, we had a negative working capital position of $3.7 billion and $2.8 billion, respectively. In both periods, the major contributing factor to the negative working capital position was the current liabilities associated with our growth capital program.
To address this negative working capital position, we maintain significant liquidity in the form of committed credit facilities and other sources as previously discussed, which enable the funding of liabilities as they become due.
81
SOURCES AND USES OF CASH
| Year ended December 31, | 2020 | 2019 | 2018 | ||||||||
| (millions of Canadian dollars) | |||||||||||
| Operating activities | 9,781 | 9,398 | 10,502 | ||||||||
| Investing activities | (5,177) | (4,658) | (3,017) | ||||||||
| Financing activities | (4,770) | (4,745) | (7,503) | ||||||||
Effect of translation of foreign denominated cash and cash equivalents | (20) | 44 | 68 | ||||||||
Net increase/(decrease) in cash and cash equivalents and restricted cash | (186) | 39 | 50 | ||||||||
Significant sources and uses of cash for the years ended December 31, 2020 and 2019 are summarized below:
Operating Activities
2020
•The increase in cash flow provided by operations during 2020 was primarily driven by changes in operating assets and liabilities. Our operating assets and liabilities fluctuate in the normal course due to various factors, including the impact of fluctuations in commodity prices and activity levels on working capital within our business segments, the timing of tax payments, as well as timing of cash receipts and payments generally. Refer to Part II. Item 8. Financial Statements and Supplementary Data - Note 28. Changes in Operating Assets and Liabilities.
•The factor above was partially offset by the impact of certain unusual, infrequent and other non-operating factors as discussed under Results of Operations.
2019
•The decrease in cash flow provided by operations during 2019 was primarily driven by changes in operating assets and liabilities, partially offset by stronger contributions from our operating segments.
Investing Activities
We continue with the execution of our growth capital program which is further described in Part II. Item 7. Management's Discussion and Analysis of Financial Condition and Results of Operations - Growth Projects - Commercially Secured Projects. The timing of project approval, construction and in-service dates impacts the timing of cash requirements.
A summary of additions to property, plant and equipment for the years ended December 31, 2020, 2019 and 2018 is set out below:
| Year ended December 31, | 2020 | 2019 | 2018 | ||||||||
| (millions of Canadian dollars) | |||||||||||
| Liquids Pipelines | 2,032 | 2,548 | 3,102 | ||||||||
| Gas Transmission and Midstream | 2,066 | 1,695 | 2,578 | ||||||||
| Gas Distribution and Storage | 1,134 | 1,100 | 1,066 | ||||||||
| Renewable Power Generation | 81 | 23 | 33 | ||||||||
| Energy Services | 2 | 2 | — | ||||||||
| Eliminations and Other | 90 | 124 | 27 | ||||||||
| Total capital expenditures | 5,405 | 5,492 | 6,806 | ||||||||
82
2020
The increase in cash used in investing activities primarily resulted from the following factors:
•Lower proceeds from asset dispositions in 2020 compared with 2019, primarily due to the sale of the federally regulated portion of our Canadian natural gas gathering and processing businesses assets on December 31, 2019.
•The factor above was partially offset by lower contributions to the Gray Oak Holdings LLC equity investment in 2020, higher return of capital primarily from equity investments in Seaway Crude Holdings LLC, MarEn Bakken Company LLC, Gray Oak Holdings LLC, and Enbridge Renewable Infrastructure Investments S.a.r.l., and lower net cash invested in affiliate loans in 2020 compared with 2019.
2019
The increase in cash used in investing activities primarily resulted from the following factors:
•Lower proceeds from asset dispositions in 2019 compared with 2018. In 2019, the proceeds from dispositions reflects the sale of the federally regulated portion of our Canadian natural gas gathering and processing businesses assets, St. Lawrence Gas and EGNB. In 2018, the proceeds from dispositions reflects the sale of Midcoast Operating, L.P. and its subsidiaries (MOLP), a portion of our renewable assets and the provincially regulated portion of our Canadian natural gas gathering and processing businesses assets.
•The absence in 2019 of a distribution received from Sabal Trail in 2018 as a partial return of capital for construction and development costs previously funded by Sabal Trail's partners.
Financing Activities
2020
Cash used in financing activities in 2020 was consistent with 2019 due to the following factors:
•Increased commercial paper and credit facility draws, increased short-term borrowings and lower repayments of maturing long-term debt in 2020 compared with 2019, partially offset by lower issuances of long-term debt.
• The absence in 2020 of cash used in the redemption of Westcoast's Series 7 and Series 8 preferred shares in 2019.
• The factors above were offset by higher common share dividend payments in 2020 due to the increase in our common share dividend rate.
2019
The decrease in cash used in financing activities primarily resulted from the following factors:
•Increased commercial paper and credit facility draws and increased long-term debt issued in 2019 compared with 2018, partially offset by higher repayments of maturing long-term debt.
• Decreased distributions to noncontrolling interests and redeemable noncontrolling interests in 2019 primarily as a result of the buy-ins of our sponsored vehicles: SEP, Enbridge Energy Partners, L.P. (EEP), Enbridge Energy Management, L.L.C. (EEM) and Enbridge Income Fund Holdings Inc. (ENF), (collectively, the Sponsored Vehicles) in the fourth quarter of 2018.
• The absence in 2019 of proceeds received from the sale of a portion of our interest in our Canadian and US renewable assets to CPP Investments in the third quarter of 2018.
• The factors above were partially offset by higher common share dividend payments in 2019 due to the increase in the common share dividend rate and an increase in the number of common shares outstanding in connection with the Sponsored Vehicles buy-in in the fourth quarter of 2018.
OFF-BALANCE SHEET ARRANGEMENTS
We enter into guarantee arrangements in the normal course of business to facilitate commercial transactions with third parties. These arrangements include financial guarantees, stand-by letters of credit, debt guarantees, surety bonds and indemnifications. See Part II. Item 8. Financial Statements and Supplementary Data - Note 31. Guarantees for further discussion of guarantee arrangements.
83
Most of the guarantee arrangements that we enter into enhance the credit standings of certain subsidiaries, non-consolidated entities or less than 100%-owned entities, enabling them to conduct business. As such, these guarantee arrangements involve elements of performance and credit risk which are not included on our Consolidated Statements of Financial Position. The possibility of us having to honor our contingencies is largely dependent upon the future operations of our subsidiaries, investees and other third parties, or the occurrence of certain future events. Issuance of these guarantee arrangements is not required for the majority of our operations.
We do not have material off-balance sheet financing entities or structures, except for guarantee arrangements and financings entered into by our equity investments. For additional information on these commitments, see Part II. Item 8. Financial Statements and Supplementary Data - Note 30. Commitments and Contingencies and Note 31. Guarantees.
We do not have material off-balance sheet arrangements that have or are reasonably likely to have a current or future effect on our financial condition, changes in financial condition, revenues or expenses, results of operations, liquidity, capital expenditures or capital resources.
CONTRACTUAL OBLIGATIONS
Payments due under contractual obligations over the next five years and thereafter are as follows:
| As at December 31, 2020 | Total | Less than 1 year | 1-3 years | 4-5 years | After 5 years | ||||||||||||
| (millions of Canadian dollars) | |||||||||||||||||
Annual debt maturities1 | 65,358 | 2,942 | 12,627 | 13,001 | 36,788 | ||||||||||||
Interest obligations2 | 34,799 | 2,417 | 4,525 | 3,918 | 23,939 | ||||||||||||
| Right-of-ways | 1,173 | 31 | 76 | 76 | 990 | ||||||||||||
Pension obligations3 | 151 | 151 | — | — | — | ||||||||||||
Long-term contracts4 | 9,660 | 3,185 | 2,286 | 1,398 | 2,791 | ||||||||||||
| Total contractual obligations | 111,141 | 8,726 | 19,514 | 18,393 | 64,508 | ||||||||||||
1Includes debentures, term notes, commercial paper and credit facility draws based on the facility's maturity date and excludes short-term borrowings, debt discount, debt issue costs, finance lease obligations and fair value adjustment. We have the ability under certain debt facilities to call and repay the obligations prior to scheduled maturities. Therefore, the actual timing of future cash repayments could be materially different than presented above.
2Includes debentures and term notes bearing interest at fixed, floating and fixed-to-floating rates.
3Assumes only required payments will be made into the pension plans in 2021. Contributions are made in accordance with independent actuarial valuations as at December 31, 2020. Contributions may vary depending on future benefit design and asset performance.
4Included within long-term contracts, in the table above, are contracts that we have signed for the purchase of services, pipe and other materials totaling $2.1 billion which are expected to be paid over the next five years. Also consists of the following purchase obligations: gas transportation and storage contracts, firm capacity payments and gas purchase commitments, transportation, service and product purchase obligations, and power commitments.
We are unable to estimate deferred income taxes (Item 8. Financial Statements and Supplementary Data - Note 25. Income Taxes) since cash payments for income taxes are determined primarily by taxable income for each discrete fiscal year. We are also unable to estimate asset retirement obligations (ARO) (Item 8. Financial Statements and Supplementary Data - Note 19. Asset Retirement Obligations), environmental liabilities (Item 8. Financial Statements and Supplementary Data - Note 30. Commitments and Contingencies) and hedges payable (Item 8. Financial Statements and Supplementary Data - Note 24. Risk Management and Financial Instruments) due to the uncertainty as to the amount and, or, timing of when cash payments will be required.
84
Preference Share Issuances
Since July 2011, we have issued 315 million preference shares for gross proceeds of approximately $7.9 billion with the following characteristics.
| Gross Proceeds | Dividend Rate | Dividend1 | Per Share Base Redemption Value2 | Redemption and Conversion Option Date2,3 | Right to Convert Into3,4 | |||||||||||||||
| (Canadian dollars, unless otherwise stated) | ||||||||||||||||||||
| Series A | $125 million | 5.50 | % | $1.37500 | $25 | — | — | |||||||||||||
| Series B | $457 million | 3.42 | % | $0.85360 | $25 | June 1, 2022 | Series C | |||||||||||||
Series C5 | $43 million | 3-month treasury bill plus 2.40% | — | $25 | June 1, 2022 | Series B | ||||||||||||||
| Series D | $450 million | 4.46 | % | $1.11500 | $25 | March 1, 2023 | Series E | |||||||||||||
| Series F | $500 million | 4.69 | % | $1.17224 | $25 | June 1, 2023 | Series G | |||||||||||||
| Series H | $350 million | 4.38 | % | $1.09400 | $25 | September 1, 2023 | Series I | |||||||||||||
| Series J | US$200 million | 4.89 | % | US$1.22160 | US$25 | June 1, 2022 | Series K | |||||||||||||
| Series L | US$400 million | 4.96 | % | US$1.23972 | US$25 | September 1, 2022 | Series M | |||||||||||||
| Series N | $450 million | 5.09 | % | $1.27152 | $25 | December 1, 2023 | Series O | |||||||||||||
| Series P | $400 million | 4.38 | % | $1.09476 | $25 | March 1, 2024 | Series Q | |||||||||||||
| Series R | $400 million | 4.07 | % | $1.01825 | $25 | June 1, 2024 | Series S | |||||||||||||
| Series 1 | US$400 million | 5.95 | % | US$1.48728 | US$25 | June 1, 2023 | Series 2 | |||||||||||||
| Series 3 | $600 million | 3.74 | % | $0.93425 | $25 | September 1, 2024 | Series 4 | |||||||||||||
| Series 5 | US$200 million | 5.38 | % | US$1.34383 | US$25 | March 1, 2024 | Series 6 | |||||||||||||
| Series 7 | $250 million | 4.45 | % | $1.11224 | $25 | March 1, 2024 | Series 8 | |||||||||||||
| Series 9 | $275 million | 4.10 | % | $1.02424 | $25 | December 1, 2024 | Series 10 | |||||||||||||
Series 116 | $500 million | 3.94 | % | $0.98452 | $25 | March 1, 2025 | Series 12 | |||||||||||||
Series 136 | $350 million | 3.04 | % | $0.76076 | $25 | June 1, 2025 | Series 14 | |||||||||||||
Series 156 | $275 million | 2.98 | % | $0.74576 | $25 | September 1, 2025 | Series 16 | |||||||||||||
| Series 17 | $750 million | 5.15 | % | $1.28750 | $25 | March 1, 2022 | Series 18 | |||||||||||||
| Series 19 | $500 million | 4.90 | % | $1.22500 | $25 | March 1, 2023 | Series 20 | |||||||||||||
1The holder is entitled to receive a fixed, cumulative, quarterly preferential dividend, as declared by the Board of Directors. With the exception of Series A and Series C Preference Shares, such fixed dividend rate resets every five years beginning on the initial redemption and conversion option date. The Series 17 and Series 19 Preference Shares contain a feature where the fixed dividend rate, when reset every five years, will not be less than 5.15% and 4.90%, respectively. No other series of Preference Shares has this feature.
2Series A Preference Shares may be redeemed any time at our option. For all other series of Preference Shares, we, may at our option, redeem all or a portion of the outstanding Preference Shares for the Base Redemption Value per share plus all accrued and unpaid dividends on the Redemption Option Date and on every fifth anniversary thereafter.
3The holder will have the right, subject to certain conditions, to convert their shares into Cumulative Redeemable Preference Shares of a specified series on a one-for-one basis on the Conversion Option Date and every fifth anniversary thereafter at an ascribed issue price equal to the Base Redemption Value.
4With the exception of Series A Preference Shares, after the redemption and conversion option dates, holders may elect to receive quarterly floating rate cumulative dividends per share at a rate equal to: $25 x (number of days in quarter/number of days in a year) x three-month Government of Canada treasury bill rate + 2.4% (Series C), 2.4% (Series E), 2.5% (Series G), 2.1% (Series I), 2.7% (Series O), 2.5% (Series Q), 2.5% (Series S), 2.4% (Series 4), 2.6% (Series 8), 2.7% (Series 10), 2.6% (Series 12), 2.7% (Series 14), 2.7% (Series 16), 4.1% (Series 18) or 3.2% (Series 20); or US$25 x (number of days in quarter/number of days in a year) x three-month US Government treasury bill rate + 3.1% (Series K), 3.2% (Series M), 3.1% (Series 2) or 2.8% (Series 6).
5The floating quarterly dividend amount for the Series C Preference Shares was increased to $0.25458 from $0.25305 on March 1, 2020, was decreased to $0.16779 from $0.25458 on June 1, 2020, was decreased to $0.15975 from $0.16779 on September 1, 2020 and was decreased to $0.15349 from $0.15975 on December 1, 2020, due to reset on a quarterly basis following the issuance thereof.
6No Series 11, 13 or 15 Preference shares were converted on the March 1, 2020, June 1, 2020 or September 1, 2020 conversion option dates, respectively. However, the quarterly dividend amounts for Series 11, 13 or 15, was decreased to $0.24613 from $0.27500 on March 1, 2020, decreased to $0.19019 from $0.27500 on June 1, 2020, decreased to $0.18644 from $0.27500 on September 1, 2020, respectively, due to reset on every fifth anniversary thereafter.
Common Share Issuances
In the fourth quarter of 2018, we completed the issuance of 297 million common shares with a value of $12.7 billion in connection with the SEP, EEP, EEM and ENF, (collectively, the Sponsored Vehicles) buy-in. For further information refer to Part II. Item 8. Financial Statements and Supplementary Data - Note 20. Noncontrolling Interests.
85
Dividends
We have paid common share dividends in every year since we became a publicly traded company in 1953. In December 2020, we announced a 3% increase in our quarterly dividend to $0.835 per common share, or $3.34 annualized, effective with the dividend payable on March 1, 2021.
For the years ended December 31, 2020 and 2019, total dividends paid were $6.6 billion and $6.0 billion, respectively, of which $6.6 billion and $6.0 billion, respectively, were paid in cash and reflected in financing activities.
On December 7, 2020, our Board of Directors declared the following quarterly dividends. All dividends are payable on March 1, 2021 to shareholders of record on February 12, 2021.
| Dividend per share | |||||
Common Shares1 | $0.83500 | ||||
| Preference Shares, Series A | $0.34375 | ||||
| Preference Shares, Series B | $0.21340 | ||||
Preference Shares, Series C2 | $0.15349 | ||||
| Preference Shares, Series D | $0.27875 | ||||
| Preference Shares, Series F | $0.29306 | ||||
| Preference Shares, Series H | $0.27350 | ||||
| Preference Shares, Series J | US$0.30540 | ||||
| Preference Shares, Series L | US$0.30993 | ||||
| Preference Shares, Series N | $0.31788 | ||||
| Preference Shares, Series P | $0.27369 | ||||
| Preference Shares, Series R | $0.25456 | ||||
| Preference Shares, Series 1 | US$0.37182 | ||||
| Preference Shares, Series 3 | $0.23356 | ||||
| Preference Shares, Series 5 | US$0.33596 | ||||
| Preference Shares, Series 7 | $0.27806 | ||||
| Preference Shares, Series 9 | $0.25606 | ||||
Preference Shares, Series 113 | $0.24613 | ||||
Preference Shares, Series 134 | $0.19019 | ||||
Preference Shares, Series 155 | $0.18644 | ||||
| Preference Shares, Series 17 | $0.32188 | ||||
| Preference Shares, Series 19 | $0.30625 | ||||
1 The quarterly dividend per common share was increased 3% to $0.835 from $0.81, effective March 1, 2021.
2 The quarterly dividend per share paid on Series C was increased to $0.25458 from $0.25305 on March 1, 2020, was decreased to $0.16779 from $0.25458 on June 1, 2020, was decreased to $0.15975 from $0.16779 on September 1, 2020 and was decreased to $0.15349 from $0.15975 on December 1, 2020, due to reset on a quarterly basis following the date of issuance of the Series C Preference Shares.
3 The quarterly dividend per share paid on Series 11 was decreased to $0.24613 from $0.275 on March 1, 2020, due to the reset of the annual dividend on March 1, 2020, and every five years thereafter.
4 The quarterly dividend per share paid on Series 13 was decreased to $0.19019 from $0.275 on June 1, 2020, due to the reset of the annual dividend on June 1, 2020, and every five years thereafter.
5 The quarterly dividend per share paid on Series 15 was decreased to $0.18644 from $0.275 on September 1, 2020, due to the reset of the annual dividend on September 1, 2020, and every five years thereafter.
86
SUMMARIZED FINANCIAL INFORMATION
On January 22, 2019, Enbridge entered into supplemental indentures with its wholly-owned subsidiaries, SEP and EEP (the Partnerships), pursuant to which Enbridge fully and unconditionally guaranteed, on a senior unsecured basis, the payment obligations of the Partnerships with respect to the outstanding series of notes issued under the respective indentures of the Partnerships. Concurrently, the Partnerships entered into a subsidiary guarantee agreement pursuant to which they fully and unconditionally guaranteed, on a senior unsecured basis, the outstanding series of senior notes of Enbridge. The Partnerships have also entered into supplemental indentures with Enbridge pursuant to which the Partnerships have issued full and unconditional guarantees, on a senior unsecured basis, of senior notes issued by Enbridge subsequent to January 22, 2019. As a result of the guarantees, holders of any of the outstanding guaranteed notes of the Partnerships (the Guaranteed Partnership Notes) are in the same position with respect to the net assets, income and cash flows of Enbridge as holders of Enbridge's outstanding guaranteed notes (the Guaranteed Enbridge Notes), and vice versa. Other than the Partnerships, Enbridge subsidiaries (including the subsidiaries of the Partnerships, collectively, the Subsidiary Non-Guarantors), are not parties to the subsidiary guarantee agreement and have not otherwise guaranteed any of Enbridge's outstanding series of senior notes.
Consenting SEP notes and EEP notes under Guarantee
SEP Notes1 | EEP Notes2 | ||||
| 4.600% Senior Notes due 2021 | 4.200% Notes due 2021 | ||||
| 4.750% Senior Notes due 2024 | 5.875% Notes due 2025 | ||||
| 3.500% Senior Notes due 2025 | 5.950% Notes due 2033 | ||||
| 3.375% Senior Notes due 2026 | 6.300% Notes due 2034 | ||||
| 5.950% Senior Notes due 2043 | 7.500% Notes due 2038 | ||||
| 4.500% Senior Notes due 2045 | 5.500% Notes due 2040 | ||||
| 7.375% Notes due 2045 | |||||
1As at December 31, 2020, the aggregate outstanding principal amount of SEP notes was approximately US$3.5 billion.
2As at December 31, 2020, the aggregate outstanding principal amount of EEP notes was approximately US$3.0 billion.
87
Enbridge Notes under Guarantees
USD Denominated1 | CAD Denominated2 | ||||
| Floating Rate Note due 2022 | 4.260% Senior Notes due 2021 | ||||
| 2.900% Senior Notes due 2022 | 3.160% Senior Notes due 2021 | ||||
| 4.000% Senior Notes due 2023 | 4.850% Senior Notes due 2022 | ||||
| 3.500% Senior Notes due 2024 | 3.190% Senior Notes due 2022 | ||||
| 2.500% Senior Notes due 2025 | 3.940% Senior Notes due 2023 | ||||
| 4.250% Senior Notes due 2026 | 3.940% Senior Notes due 2023 | ||||
| 3.700% Senior Notes due 2027 | 3.950% Senior Notes due 2024 | ||||
| 3.125% Senior Notes due 2029 | 2.440% Senior Notes due 2025 | ||||
| 4.500% Senior Notes due 2044 | 3.200% Senior Notes due 2027 | ||||
| 5.500% Senior Notes due 2046 | 6.100% Senior Notes due 2028 | ||||
| 4.000% Senior Notes due 2049 | 2.990% Senior Notes due 2029 | ||||
| 7.220% Senior Notes due 2030 | |||||
| 7.200% Senior Notes due 2032 | |||||
| 5.570% Senior Notes due 2035 | |||||
| 5.750% Senior Notes due 2039 | |||||
| 5.120% Senior Notes due 2040 | |||||
| 4.240% Senior Notes due 2042 | |||||
| 4.570% Senior Notes due 2044 | |||||
| 4.870% Senior Notes due 2044 | |||||
| 4.560% Senior Notes due 2064 | |||||
1As at December 31, 2020, the aggregate outstanding principal amount of the Enbridge US dollar denominated notes was approximately US$7.5 billion.
2As at December 31, 2020, the aggregate outstanding principal amount of the Enbridge Canadian dollar denominated notes was approximately $8.3 billion.
Rule 3-10 of the US Securities and Exchange Commission's (SEC) Regulation S-X provides an exemption from the reporting requirements of the Exchange Act for fully consolidated subsidiary issuers of guaranteed securities and subsidiary guarantors and allows for summarized financial information in lieu of filing separate financial statements for each of the Partnerships.
The following Summarized Combined Statement of Earnings and the Summarized Combined Statements of Financial Position combines the balances of EEP, SEP and Enbridge.
Summarized Combined Statement of Earnings
| Year ended December 31, 2020 | |||||
| (millions of Canadian dollars) | |||||
| Operating loss | (144) | ||||
| Earnings | 2,073 | ||||
| Earnings attributable to common shareholders | 1,696 | ||||
88
Summarized Combined Statements of Financial Position
| December 31, 2020 | December 31, 2019 | |||||||
| (millions of Canadian dollars) | ||||||||
| Accounts receivable from affiliates | 2,108 | 741 | ||||||
| Short-term loans receivable from affiliates | 4,926 | 5,652 | ||||||
| Other current assets | 375 | 487 | ||||||
| Long-term loans receivable from affiliates | 43,217 | 49,745 | ||||||
| Other long-term assets | 4,237 | 4,615 | ||||||
| Accounts payable to affiliates | 1,267 | 1,171 | ||||||
| Short-term loans payable to affiliates | 4,117 | 4,416 | ||||||
| Other current liabilities | 5,628 | 5,854 | ||||||
| Long-term loans payable to affiliates | 32,035 | 36,798 | ||||||
| Other long-term liabilities | 41,353 | 37,094 | ||||||
The Guaranteed Enbridge Notes and the Guaranteed Partnership Notes are structurally subordinated to the indebtedness of the Subsidiary Non-Guarantors in respect of the assets of those Subsidiary Non-Guarantors.
Under US bankruptcy law and comparable provisions of state fraudulent transfer laws, a guarantee can be voided, or claims may be subordinated to all other debts of that guarantor if, among other things, the guarantor, at the time the indebtedness evidenced by its guarantee or, in some states, when payments become due under the guarantee:
•received less than reasonably equivalent value or fair consideration for the incurrence of the guarantee and was insolvent or rendered insolvent by reason of such incurrence;
•was engaged in a business or transaction for which the guarantor’s remaining assets constituted unreasonably small capital; or
•intended to incur, or believed that it would incur, debts beyond its ability to pay those debts as they mature.
The guarantees of the Guaranteed Enbridge Notes contain provisions to limit the maximum amount of liability that the Partnerships could incur without causing the incurrence of obligations under the guarantee to be a fraudulent conveyance or fraudulent transfer under US federal or state law.
Each of the Partnerships is entitled to a right of contribution from the other Partnership for 50% of all payments, damages and expenses incurred by that Partnership in discharging its obligations under the guarantees for the Guaranteed Enbridge Notes.
Under the terms of the guarantee agreement and applicable supplemental indentures, the guarantees of either of the Partnerships of any Guaranteed Enbridge Notes will be unconditionally released and discharged automatically upon the occurrence of any of the following events:
•any direct or indirect sale, exchange or transfer, whether by way of merger, sale or transfer of equity interests or otherwise, to any person that is not an affiliate of Enbridge, of any of Enbridge’s direct or indirect limited partnership of other equity interests in that Partnership as a result of which the Partnership ceases to be a consolidated subsidiary of Enbridge;
•the merger of that Partnership into Enbridge or the other Partnership or the liquidation and dissolution of that Partnership;
•the repayment in full or discharge or defeasance of those Guaranteed Enbridge Notes, as contemplated by the applicable indenture or guarantee agreement;
89
•with respect to EEP, the repayment in full or discharge or defeasance of each of the consenting EEP notes listed above;
•with respect to SEP, the repayment in full or discharge or defeasance of each of the consenting SEP notes listed above; or
•with respect to any series of Guaranteed Enbridge Notes, with the consent of holders of at least a majority of the outstanding principal amount of that series of Guaranteed Enbridge Notes.
The guarantee obligations of Enbridge of the Guaranteed Partnership Notes will terminate with respect to any series of Guaranteed Partnership Notes if that series is discharged or defeased.
The Partnerships also guarantee the obligations of Enbridge under its existing credit facilities.
LEGAL AND OTHER UPDATES
LIQUIDS PIPELINES
Dakota Access Pipeline
In February 2017, the Standing Rock Sioux Tribe and the Cheyenne River Sioux Tribe filed motions with the US Court for the District of Columbia (the District Court) contesting the lawfulness of the Army Corps easement for DAPL, including the adequacy of the Army Corps’ environmental review and tribal consultation process. The Oglala Sioux and Yankton Sioux Tribes also filed lawsuits alleging similar claims.
On June 14, 2017, the District Court found the Army Corps’ environmental review to be deficient and ordered the Army Corps to conduct further study concerning spill risks from DAPL. In August 2018, the Army Corps completed on remand the further environmental review ordered by the District Court and reaffirmed the issuance of the easement for DAPL. All four plaintiff Tribes subsequently amended their complaints to include claims challenging the adequacy of the Army Corps’ August 2018 remand decision.
On March 25, 2020, in response to the Tribes’ arguments, the District Court found the Army Corps’ environmental review on remand was deficient and ordered the Army Corps to prepare an EIS to address unresolved controversy pertaining to potential spill impacts resulting from DAPL. On July 6, 2020, the District Court issued an order vacating the Army Corps’ easement for DAPL and ordering that the pipeline be shut down by August 5, 2020. Dakota Access, LLC and the Army Corps appealed the decision and filed a motion for a stay pending appeal with the US Court of Appeals for the D.C. Circuit. On August 5, 2020, the US Court of Appeals stayed the District Court’s July 6 order to shut down and empty the pipeline by August 5, but did not stay the District Court’s March 25 order requiring the Army Corps to prepare an EIS or the District Court’s July 6 order vacating the DAPL easement.
On January 26, 2021, the US Court of Appeals affirmed the District Court’s decision, holding that the Army Corps is required to prepare an EIS and that the Army Corps’ easement for DAPL is vacated. The US Court of Appeals also determined that, absent considering the closure of DAPL in the context of an injunction proceeding, the District Court could not order DAPL’s operations to cease. While not an issue before the Court, the US Court of Appeals also recognized that the Army Corps could consider whether to allow DAPL to continue to operate in the absence of an easement.
In the District Court, the plaintiff Tribes have requested that the District Court enjoin DAPL from operating until the Army Corps has completed its EIS and reissued the DAPL easement. Both Dakota Access, LLC and the Army Corps oppose the Tribes’ request for an injunction. All briefing before the District Court on whether DAPL operations should be enjoined is now complete. The parties are scheduled to appear before the District Court again on April 9, 2021.
90
Line 5 Dual Pipelines - Easement
In 2019, the Michigan Attorney General filed a complaint in the Michigan Ingham County Circuit Court that requests the Court to declare the easement granted in 1953 that we have for the operation of Line 5 in the Straits of Mackinac (the Straits) to be invalid and to prohibit continued operation of Line 5 in the Straits “as soon as possible after a reasonable notice period to allow orderly adjustments by affected parties”. Cross motions for summary dispositions were argued on May 22, 2020 and supplemental briefing on the issue of federal preemption was completed on July 6, 2020. Ruling on the motions is currently being held in abeyance by the Court pending further developments in the Federal Court case.
On November 13, 2020, the Governor of Michigan and the Director of the Michigan Department of Natural Resources notified us that the State was revoking and terminating the easement granted in 1953 that allows Line 5 to operate across the Straits. The notification letter said that the revocation resulted from “a violation of the public trust doctrine” and “a longstanding, persistent pattern of noncompliance with easement conditions and the standard of due care.” The notice demands that the portion of Line 5 that crosses the Straits must be shut down by May 2021. The State also filed a lawsuit on November 13, 2020, in the Michigan Ingham County Circuit Court for declaratory and injunctive relief seeking to validate and enforce the notice. On November 24, 2020, we filed in the US District Court for the Western District of Michigan a Notice of Removal, which removed the State’s November Complaint to Federal Court and a Complaint for Declaratory and Injunctive Relief that requests the US District Court to enjoin the Governor from taking any action to prevent or impede the operation of Line 5. This included revocation or termination of the 1953 easement for the pipeline’s crossing at the Straits because the Pipeline and Hazardous Materials Safety Administration (PHMSA) is the exclusive federal regulator of pipeline safety and the State’s notice and lawsuit violate federal law. We have made a request to the Federal Court Judge assigned to the case, Judge Neff, to file a motion to dismiss the State’s November Complaint and the State has filed a request to file a motion to remand the State’s case back to State Court and to file a motion to dismiss our Federal Complaint. The Court has scheduled a Pre-Motion Conference for February 17, 2021.
On January 12, 2021, we responded to the Governor’s Notice of Revocation and Termination of Easement. Our response: a) demonstrates compliance with the 1953 easement and 2018 Tunnel Agreement; b) rebuts falsehoods in the State’s Notice; c) shows that the State has ignored evidence that demonstrates our compliance with the Easement; and d) contends that the State is in breach of its obligations to us under the Easement and Tunnel Agreement. Our response further states that we intend to operate Line 5 until the replacement pipeline under the Straits within the Great Lakes Tunnel is placed into service, as per our existing Agreement with the State of Michigan and consistent with PMHSA federal regulatory requirements.
We will vigorously defend our ability to operate Line 5 under the 1953 easement in pending Court actions and we expect that our legal positions will prevail.
We continue to advance construction related activities on the Great Lakes tunnel project. On January 29, 2021, the Michigan Department of Environment, Great Lakes and Energy issued permits relating to wetlands and submerged lands, along with National Pollutant Discharge Elimination System permits. We continue to work with the Army Corps and the Michigan Public Service Commission on additional permits and regulatory approvals.
Line 5 Dual Pipelines - Temporary Shutdown
On June 18, 2020, during seasonal maintenance work on Line 5, we discovered that a screw anchor support had shifted from its original position. We immediately shut down the pipeline and notified the State and our federal regulator, PHMSA. The issue with the screw anchor was isolated to the east segment of Line 5 and an inspection of the west segment of Line 5 confirmed there were no issues or damage to the anchor structures or pipeline on that segment. Normal operations of the west segment of Line 5 resumed on June 20, 2020, and an investigation of the east segment of Line 5 commenced.
91
On June 22, 2020, the Michigan Attorney General, on behalf of the State, filed a motion for a Temporary Restraining Order in the Michigan Ingham County Circuit Court to cease the continued operation of the west segment of Line 5 and to ensure operation of the east segment of Line 5 was not resumed. Further, the Temporary Restraining Order was to compel "legally required information" to be shared with the State for determination that the operation of Line 5 through the Straits is safe. On June 25, 2020, an Order was issued prohibiting the operation of Line 5 pending a hearing on the State’s motion for Preliminary Injunction on June 30, 2020. On July 1, 2020, following the hearing, the Temporary Restraining Order was amended allowing the west segment of Line 5 to restart for the purposes of conducting an in-line inspection, which reconfirmed that the line is safe to operate as there was no damage to the pipeline, and the west segment resumed service. After additional information, including in-line inspection results submitted to PHMSA confirmed the east segment was safe to operate, the Court on September 9, 2020 signed an order agreed to between Enbridge and the State to allow the east segment to resume service. The east segment resumed service on September 10, 2020. On September 24, 2020, the Court signed a stipulated order fully resolving the Temporary Restraining Order and Preliminary Injunction.
OTHER LITIGATION
We and our subsidiaries are involved in various other legal and regulatory actions and proceedings which arise in the normal course of business, including interventions in regulatory proceedings and challenges to regulatory approvals and permits. While the final outcome of such actions and proceedings cannot be predicted with certainty, management believes that the resolution of such actions and proceedings will not have a material impact on our consolidated financial position or results of operations.
TAX MATTERS
We and our subsidiaries maintain tax liabilities related to uncertain tax positions. While fully supportable in our view, these tax positions, if challenged by tax authorities, may not be fully sustained on review.
CRITICAL ACCOUNTING ESTIMATES
Our consolidated financial statements are prepared in accordance with generally accepted accounting principles in the United States of America (US GAAP), which require management to make estimates, judgments and assumptions that affect the amounts reported in our consolidated financial statements and accompanying notes. In making judgments and estimates, management relies on external information and observable conditions, where possible, supplemented by internal analysis as required. We believe our most critical accounting policies and estimates discussed below have an impact across the various segments of our business.
Business Combinations
We apply the provisions of Accounting Standards Codification (ASC) 805 Business Combinations in accounting for our acquisitions. The acquired long-lived assets, intangible assets and assumed liabilities are recorded at their estimated fair values at the date of acquisition. Goodwill represents the excess of the purchase price over the fair value of net assets. While we use our best estimates and assumptions to accurately value assets acquired and liabilities assumed at the date of acquisition, as well as any contingent consideration, our estimates are inherently uncertain and subject to refinement. During the measurement period, which may be up to one year from the acquisition date, we record adjustments to the assets acquired and liabilities assumed with the corresponding offset to goodwill. Upon the conclusion of the measurement period or final determination of values of assets acquired or liabilities assumed, whichever comes first, any subsequent adjustments are recorded to our consolidated statements of operations.
92
Accounting for business combinations requires significant judgment, estimates and assumptions at the acquisition date. In developing estimates of fair values at the acquisition date, we utilize a variety of factors including market data, historical and future expected cash flows, growth rates and discount rates. The subjective nature of our assumptions increases the risk associated with estimates surrounding the projected performance of the acquired entity.
Goodwill Impairment
Goodwill represents the excess of the purchase price over the fair value of net identifiable assets on acquisition of a business. The carrying value of goodwill, which is not amortized, is assessed for impairment annually, or more frequently if events or changes in circumstances arise that suggest the carrying value of goodwill may be impaired.
We perform our impairment assessment annually on April 1 at the reporting unit level. Reporting units are determined by assessing whether the components of our operating segments constitute businesses for which discrete information is available, whether segment management regularly reviews the operating results of those components and whether the economic and regulatory characteristics are similar.
We have the option to first assess qualitative factors to determine whether it is necessary to perform the quantitative goodwill impairment assessment. When performing a qualitative assessment, we determine the drivers of fair value for each reporting unit and evaluate whether those drivers have been positively or negatively affected by relevant events and circumstances since the last fair value assessment. Our evaluation includes, but is not limited to, assessment of macroeconomic trends, regulatory environments, capital accessibility, operating income trends, and industry conditions. Based on our assessment of the qualitative factors, if we determine it is more likely than not that the fair value of the reporting unit is less than it’s carrying amount, a quantitative goodwill impairment assessment is performed.
The quantitative goodwill impairment assessment involves determining the fair value of our reporting units and comparing those values to the carrying value of each corresponding reporting unit. If the carrying value of a reporting unit, including allocated goodwill, exceeds its fair value, goodwill impairment is measured at the amount by which the reporting unit’s carrying value exceeds its fair value. This amount should not exceed the carrying amount of goodwill. Fair value of our reporting units is estimated using a combination of discounted cash flow models and earnings multiples techniques. The determination of fair value using the discounted cash flow model technique requires the use of estimates and assumptions related to discount rates, projected operating income, terminal value growth rates, capital expenditures and working capital levels. The cash flow projections include significant judgments and assumptions relating to discount rates and expected future capital expenditures. The determination of fair value using the earnings multiples technique requires assumptions to be made in relation to maintainable earnings and earnings multipliers for reporting units.
Our most recent annual assessment of the goodwill balance was performed on April 1, 2020. As at April 1, 2020, our reporting units were equivalent to our reportable segments. We did not elect to perform a qualitative assessment and instead performed a quantitative goodwill impairment assessment for the following reporting units: Liquids Pipelines, Gas Transmission and Midstream, and Gas Distribution and Storage. Our quantitative goodwill impairment assessment as at April 1, 2020 did not result in an impairment charge. Also, we did not identify any indicators of goodwill impairment during the remainder of 2020.
93
Asset Impairment
We evaluate the recoverability of our property, plant and equipment when events or circumstances such as economic obsolescence, business climate, legal or regulatory changes, or other factors indicate we may not recover the carrying amount of our assets. We continually monitor our businesses, the market and business environments to identify indicators that could suggest an asset may not be recoverable. If it is determined that the carrying value of an asset exceeds the undiscounted cash flows expected from the asset, we will assess the fair value of the asset. An impairment loss is recognized when the carrying amount of the asset exceeds its fair value.
With respect to equity method investments, we assess at each balance sheet date whether there is objective evidence that the investment is impaired by completing a quantitative or qualitative analysis of factors impacting the investment. If there is objective evidence of impairment, we determine whether the decline below carrying value is other than temporary. If the decline is determined to be other than temporary, an impairment charge is recorded in earnings with an offsetting reduction to the carrying value of the investment.
Asset fair value is determined by quoted market prices in active markets or present value techniques. The determination of the fair value using present value techniques requires the use of projections and assumptions regarding future cash flows and weighted average cost of capital. Any changes to these projections and assumptions could result in revisions to the evaluation of the recoverability of the asset and the recognition of an impairment loss in the Consolidated Statements of Earnings.
Assets held for sale
We classify assets as held for sale when management commits to a formal plan to actively market an asset or a group of assets and when management believes it is probable the sale of the assets will occur within one year. We measure assets classified as held for sale at the lower of their carrying value and their estimated fair value less costs to sell.
Regulatory Accounting
Certain of our businesses are subject to regulation by various authorities, including but not limited to, the CER, the FERC, the Alberta Energy Regulator, La Régie de l’energie du Québec and the OEB. Regulatory bodies exercise statutory authority over matters such as construction, rates and ratemaking and agreements with customers. To recognize the economic effects of the actions of the regulator, the timing of recognition of certain revenues and expenses in these operations may differ from that otherwise expected under US GAAP for non-rate-regulated entities. Key determinants in the ratemaking process are:
•Costs of providing service, including operating costs, capital invested and depreciation expense;
•Allowed rate of return, including the equity component of the capital structure and related income taxes;
•Interest costs on the debt component of the capital structure; and
•Contract and volume throughput assumptions.
The allowed rate of return is determined in accordance with the applicable regulatory model and may impact our profitability. The rates for a number of our projects are based on a cost-of-service recovery model that follows the regulators’ authoritative guidance. Under the cost-of-service tolling methodology, we calculate tolls based on forecast volumes and cost. A difference between forecast and actual results causes an over or under recovery in any given year. Regulatory assets represent amounts that are expected to be recovered from customers in future periods through rates. Regulatory liabilities represent amounts that are expected to be refunded to customers in future periods through rates or expected to be paid to cover future abandonment costs in relation to the CER’s Land Matters Consultation Initiative (LMCI) and for future removal and site restoration costs as approved by the OEB.
94
To the extent that the regulator’s actions differ from our expectations, the timing and amount of recovery or settlement of regulatory balances could differ significantly from those recorded. In the absence of rate regulation, we would generally not recognize regulatory assets or liabilities and the earnings impact would be recorded in the period the expenses are incurred or revenues are earned. A regulatory asset or liability is recognized in respect of deferred income taxes when it is expected the amounts will be recovered or settled through future regulator-approved rates.
As at December 31, 2020 and 2019, our regulatory assets totaled $5.6 billion and $5.1 billion, respectively, and regulatory liabilities totaled $3.4 billion and $3.1 billion, respectively.
Depreciation
Depreciation of property, plant and equipment, our largest asset with a net book value at December 31, 2020 and 2019, of $94.6 billion and $93.7 billion, respectively, is charged in accordance with two primary methods. For distinct assets, depreciation is generally provided on a straight-line basis over the estimated useful lives of the assets commencing when the asset is placed in service. For largely homogeneous groups of assets with comparable useful lives, the pool method of accounting is followed whereby similar assets are grouped and depreciated as a pool. When group assets are retired or otherwise disposed of, gains and losses are not reflected in earnings but are booked as an adjustment to accumulated depreciation.
When it is determined that the estimated service life of an asset no longer reflects the expected remaining period of benefit, prospective changes are made to the estimated service life. Estimates of useful lives are based on third party engineering studies, experience and/or industry practice. There are a number of assumptions inherent in estimating the service lives of our assets including the level of development, exploration, drilling, reserves and production of crude oil and natural gas in the supply areas served by our pipelines as well as the demand for crude oil and natural gas and the integrity of our systems. Changes in these assumptions could result in adjustments to the estimated service lives, which could result in material changes to depreciation expense in future periods in any of our business segments. For certain rate-regulated operations, depreciation rates are approved by the regulator and the regulator may require periodic studies or technical updates on useful lives which may change depreciation rates.
Pension and Other Postretirement Benefits
We use certain assumptions relating to the calculation of defined benefit pension and other postretirement liabilities and net periodic benefit costs. These assumptions comprise management’s best estimates of expected return on plan assets, future salary levels, other cost escalations, retirement ages of employees and other actuarial factors including discount rates and mortality. We determine discount rates by reference to rates of high-quality long-term corporate bonds with maturities that approximate the timing of future payments anticipated to be made under each of the respective plans. The expected return on plan assets is determined using market-related values and assumptions on the asset mix consistent with the investment policy relating to the assets and their projected returns. The assumptions are reviewed annually by our independent actuaries. Actual results that differ from results based on assumptions are amortized over future periods and, therefore, could materially affect the expense recognized and the recorded obligation in future periods.
95
The following sensitivity analysis identifies the impact on the December 31, 2020 Consolidated Financial Statements of a 0.5% change in key pension and other postretirement benefit obligations (OPEB) assumptions:
| Canada | United States | ||||||||||||||||||||||
| Obligation | Expense | Obligation | Expense | ||||||||||||||||||||
| (millions of Canadian dollars) | |||||||||||||||||||||||
| Pension | |||||||||||||||||||||||
| Decrease in discount rate | 400 | 35 | 71 | 5 | |||||||||||||||||||
| Decrease in expected return on assets | — | 19 | — | 6 | |||||||||||||||||||
| Decrease in rate of salary increase | (75) | (16) | (6) | (1) | |||||||||||||||||||
| OPEB | |||||||||||||||||||||||
| Decrease in discount rate | 27 | 1 | 14 | — | |||||||||||||||||||
| Decrease in expected return on assets | N/A | N/A | — | 1 | |||||||||||||||||||
Contingent Liabilities
Provisions for claims filed against us are determined on a case-by-case basis. Case estimates are reviewed on a regular basis and are updated as new information is received. The process of evaluating claims involves the use of estimates and a high degree of management judgment. Claims outstanding, the final determination of which could have a material impact on our financial results and certain subsidiaries and investments are detailed in Part II. Item 8. Financial Statements and Supplementary Data - Note 30. Commitments and Contingencies. In addition, any unasserted claims that later may become evident could have a material impact on our financial results and certain subsidiaries and investments.
Asset Retirement Obligations
ARO associated with the retirement of long-lived assets are measured at fair value and recognized as Accounts payable and other or Other long-term liabilities in the period in which they can be reasonably determined. The fair value approximates the cost a third party would charge to perform the tasks necessary to retire such assets and is recognized at the present value of expected future cash flows. Discount rates used to estimate the present value of the expected future cash flows range from 1.8% to 9.0% for the years ended December 31, 2020 and 2019. ARO is added to the carrying value of the associated asset and depreciated over the asset’s useful life. The corresponding liability is accreted over time through charges to earnings and is reduced by actual costs of decommissioning and reclamation. Our estimates of retirement costs could change as a result of changes in cost estimates and regulatory requirements. Currently, for the majority of our assets, there is insufficient data or information to reasonably determine the timing of settlement for estimating the fair value of the ARO. In these cases, the ARO cost is considered indeterminate for accounting purposes, as there is no data or information that can be derived from past practice, industry practice or the estimated economic life of the asset.
In 2009, the CER issued a decision related to the LMCI, which required holders of an authorization to operate a pipeline under the CER Act to file a proposed process and mechanism to set aside funds to pay for future abandonment costs in respect of the sites in Canada used for the operation of a pipeline. The CER's decision stated that while pipeline companies are ultimately responsible for the full costs of abandoning pipelines, abandonment costs are a legitimate cost of providing service and are recoverable from the users of the pipeline upon approval by the CER. Following the CER's final approval of the collection mechanism and the set-aside mechanism for LMCI, we began collecting and setting aside funds to cover future abandonment costs effective January 1, 2015. The funds collected are held in trust in accordance with the CER decision. The funds collected from shippers are reported within Transportation and other services revenues and Restricted long-term investments. Concurrently, we reflect the future abandonment cost as an increase to Operating and administrative expense and Other long-term liabilities.
96
CHANGES IN ACCOUNTING POLICIES
Refer to Item 8. Financial Statements and Supplementary Data - Note 3. Changes in Accounting Policies.
97
ITEM 7A. QUANTITATIVE AND QUALITATIVE DISCLOSURES ABOUT MARKET RISK
Our earnings, cash flows and other comprehensive income (OCI) are subject to movements in foreign exchange rates, interest rates, commodity prices and our share price.
The following summarizes the types of market risks to which we are exposed and the risk management instruments used to mitigate them. We use a combination of qualifying and non-qualifying derivative instruments to manage the risks noted below.
Foreign Exchange Risk
We generate certain revenues, incur expenses and hold a number of investments and subsidiaries that are denominated in currencies other than Canadian dollars. As a result, our earnings, cash flows and OCI are exposed to fluctuations resulting from foreign exchange rate variability.
We employ financial derivative instruments to hedge foreign currency denominated earnings exposure. A combination of qualifying and non-qualifying derivative instruments is used to hedge anticipated foreign currency denominated revenues and expenses and to manage variability in cash flows. We hedge certain net investments in US dollar denominated investments and subsidiaries using foreign currency derivatives and US dollar denominated debt.
Interest Rate Risk
Our earnings and cash flows are exposed to short-term interest rate variability due to the regular repricing of our variable rate debt, primarily commercial paper. We monitor our debt portfolio mix of fixed and variable rate debt instruments to manage a consolidated portfolio of floating rate debt within the Board of Directors approved policy limit of a maximum of 30% of floating rate debt as a percentage of total debt outstanding. We primarily use qualifying derivative instruments to manage interest rate risk. Pay fixed-receive floating interest rate swaps may be used to hedge against the effect of future interest rate movements. We have implemented a program to significantly mitigate the impact of short-term interest rate volatility on interest expense via execution of floating to fixed interest rate swaps with an average swap rate of 3%.
We are exposed to changes in the fair value of fixed rate debt that arise as a result of changes in market interest rates. Pay floating-receive fixed interest rate swaps are used, when applicable, to hedge against future changes to the fair value of fixed rate debt which mitigates the impact of fluctuations in fair value via execution of fixed to floating interest rate swaps. As at December 31, 2020, we do not have any pay floating-receive fixed interest rate swaps outstanding.
Our earnings and cash flows are also exposed to variability in longer term interest rates ahead of anticipated fixed rate term debt issuances. Forward starting interest rate swaps are used to hedge against the effect of future interest rate movements. We have established a program within some of our subsidiaries to mitigate our exposure to long-term interest rate variability on select forecast term debt issuances via execution of floating to fixed interest rate swaps with an average swap rate of 2.3%.
Commodity Price Risk
Our earnings and cash flows are exposed to changes in commodity prices as a result of our ownership interests in certain assets and investments, as well as through the activities of our energy services subsidiaries. These commodities include natural gas, crude oil, power and NGL. We employ financial and physical derivative instruments to fix a portion of the variable price exposures that arise from physical transactions involving these commodities. We use primarily non-qualifying derivative instruments to manage commodity price risk.
98
Equity Price Risk
Equity price risk is the risk of earnings fluctuations due to changes in our share price. We have exposure to our own common share price through the issuance of various forms of stock-based compensation, which affect earnings through revaluation of the outstanding units every period. We use equity derivatives to manage the earnings volatility derived from one form of stock-based compensation, restricted share units. We use a combination of qualifying and non-qualifying derivative instruments to manage equity price risk.
COVID-19 PANDEMIC RISK
The spread of the COVID-19 pandemic has caused significant volatility in Canada, the US and international markets. While we have taken proactive measures to deliver energy safely and reliably during this pandemic, given the ongoing dynamic nature of the circumstances surrounding COVID-19, the impact of this pandemic on our business remains uncertain.
Market Risk Management
We have a Risk Policy to minimize the likelihood that adverse cash flow impacts arising from movements in market prices will exceed a defined risk tolerance. We identify and measure all material market risks including commodity price risks, interest rate risks, foreign exchange risk and equity price risk using a standardized measurement methodology. Our market risk metric consolidates the exposure after accounting for the impact of offsetting risks and limits the consolidated cash flow volatility arising from market related risks to an acceptable approved risk tolerance threshold. Our market risk metric is Cash Flow at Risk (CFaR).
CFaR is a statistically derived measurement used to measure the maximum cash flow loss that could potentially result from adverse market price movements over a one month holding period for price sensitive non-derivative exposures and for derivative instruments we hold or issue as recorded on the Consolidated Statements of Financial Position as at December 31, 2020. CFaR assumes that no further mitigating actions are taken to hedge or otherwise minimize exposures and the selection of a one month holding period reflects the mix of price risk sensitive assets at Enbridge. As a practical matter, a large portion of Enbridge’s exposure could be hedged or unwound in a much shorter period if required to mitigate the risks.
The consolidated CFaR policy limit for Enbridge is 3.5% of its forward 12 month normalized cash flow. At December 31, 2020 and 2019 CFaR was $128 million and $113 million or 1.2% and 1.2%, respectively, of estimated 12 month forward normalized cash flow.
LIQUIDITY RISK
Liquidity risk is the risk that we will not be able to meet our financial obligations, including commitments and guarantees, as they become due. In order to mitigate this risk, we forecast cash requirements over a 12 month rolling time period to determine whether sufficient funds will be available and maintain substantial capacity under our committed bank lines of credit to address any contingencies. Our primary sources of liquidity and capital resources are funds generated from operations, the issuance of commercial paper and draws under committed credit facilities and long-term debt, which includes debentures and medium-term notes. We also maintain current shelf prospectuses with securities regulators which enables ready access to either the Canadian or US public capital markets, subject to market conditions. In addition, we maintain sufficient liquidity through committed credit facilities with a diversified group of banks and institutions which, if necessary, enables us to fund all anticipated requirements for approximately one year without accessing the capital markets. We are in compliance with all the terms and conditions of our committed credit facility agreements and term debt indentures as at December 31, 2020. As a result, all credit facilities are available to us and the banks are obligated to fund and have been funding us under the terms of the facilities.
99
CREDIT RISK
Entering into derivative instruments may result in exposure to credit risk from the possibility that a counterparty will default on its contractual obligations. In order to mitigate this risk, we enter into risk management transactions primarily with institutions that possess strong investment grade credit ratings. Credit risk relating to derivative counterparties is mitigated through maintenance and monitoring of credit exposure limits and contractual requirements, netting arrangements, and ongoing monitoring of counterparty credit exposure using external credit rating services and other analytical tools.
We generally have a policy of entering into individual International Swaps and Derivatives Association, Inc. agreements, or other similar derivative agreements, with the majority of our financial derivative counterparties. These agreements provide for the net settlement of derivative instruments outstanding with specific counterparties in the event of bankruptcy or other significant credit events and reduce our credit risk exposure on financial derivative asset positions outstanding with the counterparties in those circumstances
FAIR VALUE MEASUREMENTS
Our financial assets and liabilities measured at fair value on a recurring basis include derivative instruments. We also disclose the fair value of other financial instruments not measured at fair value. The fair value of financial instruments reflects our best estimates of market value based on generally accepted valuation techniques or models and is supported by observable market prices and rates. When such values are not available, we use discounted cash flow analysis from applicable yield curves based on observable market inputs to estimate fair value.
100
ITEM 8. FINANCIAL STATEMENTS AND SUPPLEMENTARY DATA
101
Report of Independent Registered Public Accounting Firm
To the Shareholders and Board of Directors of Enbridge Inc.
Opinions on the Financial Statements and Internal Control over Financial Reporting
We have audited the accompanying consolidated statements of financial position of Enbridge Inc. and its subsidiaries (together, the Company) as of December 31, 2020 and 2019, and the related consolidated statements of earnings, comprehensive income, changes in equity and cash flows for each of the three years in the period ended December 31, 2020, including the related notes (collectively referred to as the consolidated financial statements). We also have audited the Company's internal control over financial reporting as of December 31, 2020, based on criteria established in Internal Control – Integrated Framework (2013) issued by the Committee of Sponsoring Organizations of the Treadway Commission (COSO).
In our opinion, the consolidated financial statements referred to above present fairly, in all material respects, the financial position of the Company as of December 31, 2020 and 2019, and the results of its operations and its cash flows for each of the three years in the period ended December 31, 2020 in conformity with accounting principles generally accepted in the United States of America. Also in our opinion, the Company maintained, in all material respects, effective internal control over financial reporting as of December 31, 2020, based on criteria established in Internal Control – Integrated Framework (2013) issued by the COSO.
Basis for Opinions
The Company’s management is responsible for these consolidated financial statements, for maintaining effective internal control over financial reporting, and for its assessment of the effectiveness of internal control over financial reporting, included in Management’s Annual Report on Internal Control over Financial Reporting appearing under Item 9A. Our responsibility is to express opinions on the Company’s consolidated financial statements and on the Company's internal control over financial reporting based on our audits. We are a public accounting firm registered with the Public Company Accounting Oversight Board (United States) (PCAOB) and are required to be independent with respect to the Company in accordance with the U.S. federal securities laws and the applicable rules and regulations of the Securities and Exchange Commission and the PCAOB.
We conducted our audits in accordance with the standards of the PCAOB. Those standards require that we plan and perform the audits to obtain reasonable assurance about whether the consolidated financial statements are free of material misstatement, whether due to error or fraud, and whether effective internal control over financial reporting was maintained in all material respects.
Our audits of the consolidated financial statements included performing procedures to assess the risks of material misstatement of the consolidated financial statements, whether due to error or fraud, and performing procedures that respond to those risks. Such procedures included examining, on a test basis, evidence regarding the amounts and disclosures in the consolidated financial statements. Our audits also included evaluating the accounting principles used and significant estimates made by management, as well as evaluating the overall presentation of the consolidated financial statements. Our audit of internal control over financial reporting included obtaining an understanding of internal control over financial reporting, assessing the risk that a material weakness exists, and testing and evaluating the design and operating effectiveness of internal control based on the assessed risk. Our audits also included performing such other procedures as we considered necessary in the circumstances. We believe that our audits provide a reasonable basis for our opinions.
102
Definition and Limitations of Internal Control over Financial Reporting
A company’s internal control over financial reporting is a process designed to provide reasonable assurance regarding the reliability of financial reporting and the preparation of financial statements for external purposes in accordance with generally accepted accounting principles. A company’s internal control over financial reporting includes those policies and procedures that (i) pertain to the maintenance of records that, in reasonable detail, accurately and fairly reflect the transactions and dispositions of the assets of the company; (ii) provide reasonable assurance that transactions are recorded as necessary to permit preparation of financial statements in accordance with generally accepted accounting principles, and that receipts and expenditures of the company are being made only in accordance with authorizations of management and directors of the company; and (iii) provide reasonable assurance regarding prevention or timely detection of unauthorized acquisition, use, or disposition of the company’s assets that could have a material effect on the financial statements.
Because of its inherent limitations, internal control over financial reporting may not prevent or detect misstatements. Also, projections of any evaluation of effectiveness to future periods are subject to the risk that controls may become inadequate because of changes in conditions, or that the degree of compliance with the policies or procedures may deteriorate.
Critical Audit Matters
The critical audit matter communicated below is a matter arising from the current period audit of the consolidated financial statements that was communicated or required to be communicated to the audit committee and that (i) relates to accounts or disclosures that are material to the consolidated financial statements and (ii) involved our especially challenging, subjective, or complex judgments. The communication of critical audit matters does not alter in any way our opinion on the consolidated financial statements, taken as a whole, and we are not, by communicating the critical audit matter below, providing a separate opinion on the critical audit matter or on the accounts or disclosures to which it relates.
Goodwill Impairment Assessment
As described in Notes 2 and 16 to the consolidated financial statements, the Company’s goodwill balance was $32,688 million at December 31, 2020. Management performs an annual goodwill impairment assessment at the reporting unit level as of April 1 of each year, or more frequently if events or circumstances indicate that the carrying value of goodwill may be impaired. Management has the option to first assess qualitative factors to determine whether it is necessary to perform the quantitative goodwill impairment assessment. In making the qualitative assessment, management considers macroeconomic trends, changes to regulatory environments, capital accessibility, operating income trends, and changes to industry conditions. The quantitative goodwill impairment assessment involves determining the fair value of the Company’s reporting units and comparing those values to the carrying value of each reporting unit, including goodwill. Fair value is estimated using a combination of discounted cash flow and earnings multiples techniques. The determination of fair value using the discounted cash flow technique requires the use of estimates and assumptions related to discount rates, projected operating income, terminal value growth rates, expected future capital expenditures and working capital levels. The determination of fair value using the earnings multiples technique requires assumptions to be made in relation to maintainable earnings and earnings multipliers for reporting units. In the current year, management elected to perform the quantitative goodwill impairment assessment for the following reporting units: Liquids Pipelines, Gas Transmission and Midstream (“Gas Transmission”), and Gas Distribution and Storage (“Gas Distribution”).
The principal considerations for our determination that performing procedures relating to the goodwill impairment assessment is a critical audit matter are that there was significant judgment required by management when developing such significant assumptions as discount rates, projected operating income, expected future capital expenditures and earnings multipliers used to estimate the fair value of the Liquids Pipelines, Gas Transmission, and Gas Distribution reporting units. This led to a high degree of auditor judgment, effort and subjectivity in performing procedures to evaluate the significant assumptions used by management in their quantitative assessment of these reporting units. In addition, the audit effort involved the use of professionals with specialized skill and knowledge.
103
Addressing the matter involved performing procedures and evaluating audit evidence in connection with forming our overall opinion on the consolidated financial statements. These procedures included testing the effectiveness of controls relating to management’s goodwill impairment assessment, including controls over the determination of the fair value estimates of the Liquids Pipelines, Gas Transmission, and Gas Distribution reporting units. These procedures also included, among others, testing management’s process for developing the fair value estimates of the Liquids Pipelines, Gas Transmission, and Gas Distribution reporting units; evaluating the appropriateness of the discounted cash flow and the earnings multiples models; testing the completeness, accuracy, and relevance of underlying data used in the models; and evaluating the reasonableness of significant assumptions used by management in determining the fair values of these reporting units including discount rates, projected operating income, expected future capital expenditures and earnings multipliers. When assessing the reasonableness of projected operating income and its trends, and expected future capital expenditures, we evaluated whether these significant assumptions were reasonable considering the current and past performance of the Company’s reporting units, external industry data, and evidence obtained in other areas of the audit.
We utilized professionals with specialized skill and knowledge to assist in evaluating the appropriateness of management’s discounted cash flow and earnings multiples models and evaluating the reasonableness of assumptions used in the models, specifically discount rates and earnings multipliers.
/s/ PricewaterhouseCoopers LLP
Chartered Professional Accountants
Calgary, Alberta, Canada
February 12, 2021
We have served as the Company's auditor since 1949.
104
ENBRIDGE INC.
CONSOLIDATED STATEMENTS OF EARNINGS
| Year ended December 31, | 2020 | 2019 | 2018 | ||||||||
| (millions of Canadian dollars, except per share amounts) | |||||||||||
| Operating revenues | |||||||||||
| Commodity sales | |||||||||||
| Gas distribution sales | |||||||||||
| Transportation and other services | |||||||||||
Total operating revenues (Note 4) | |||||||||||
| Operating expenses | |||||||||||
| Commodity costs | |||||||||||
| Gas distribution costs | |||||||||||
| Operating and administrative | |||||||||||
| Depreciation and amortization | |||||||||||
Impairment of long-lived assets (Note 8 and Note 11) | |||||||||||
Impairment of goodwill (Note 8 and Note 16) | |||||||||||
| Total operating expenses | |||||||||||
| Operating income | |||||||||||
Income from equity investments (Note 13) | |||||||||||
Impairment of equity investments (Note 13) | ( | ||||||||||
| Other income/(expense) | |||||||||||
| Net foreign currency gain/(loss) | ( | ||||||||||
| Loss on dispositions | ( | ( | ( | ||||||||
| Other | |||||||||||
Interest expense (Note 18) | ( | ( | ( | ||||||||
| Earnings before income taxes | |||||||||||
Income tax expense (Note 25) | ( | ( | ( | ||||||||
Earnings | |||||||||||
Earnings attributable to noncontrolling interests and redeemable noncontrolling interests | ( | ( | ( | ||||||||
Earnings attributable to controlling interests | |||||||||||
| Preference share dividends | ( | ( | ( | ||||||||
Earnings attributable to common shareholders | |||||||||||
Earnings per common share attributable to common shareholders (Note 6) | |||||||||||
Diluted earnings per common share attributable to common shareholders (Note 6) | |||||||||||
The accompanying notes are an integral part of these consolidated financial statements.
105
ENBRIDGE INC.
CONSOLIDATED STATEMENTS OF COMPREHENSIVE INCOME
| Year ended December 31, | 2020 | 2019 | 2018 | ||||||||
| (millions of Canadian dollars) | |||||||||||
| Earnings | |||||||||||
| Other comprehensive income/(loss), net of tax | |||||||||||
| Change in unrealized loss on cash flow hedges | ( | ( | ( | ||||||||
| Change in unrealized gain/(loss) on net investment hedges | ( | ||||||||||
| Other comprehensive income/(loss) from equity investees | ( | ||||||||||
| Excluded components of fair value hedges | |||||||||||
| Reclassification to earnings of loss on cash flow hedges | |||||||||||
Reclassification to earnings of pension and other postretirement benefits amounts | |||||||||||
| Actuarial loss on pension plans and other postretirement benefits | ( | ( | ( | ||||||||
| Foreign currency translation adjustments | ( | ( | |||||||||
| Other comprehensive income/(loss), net of tax | ( | ( | |||||||||
| Comprehensive income | |||||||||||
Comprehensive income attributable to noncontrolling interests and redeemable noncontrolling interests | ( | ( | ( | ||||||||
| Comprehensive income attributable to controlling interests | |||||||||||
| Preference share dividends | ( | ( | ( | ||||||||
| Comprehensive income attributable to common shareholders | |||||||||||
The accompanying notes are an integral part of these consolidated financial statements.
106
ENBRIDGE INC.
CONSOLIDATED STATEMENTS OF CHANGES IN EQUITY
| Year ended December 31, | 2020 | 2019 | 2018 | ||||||||
(millions of Canadian dollars, except per share amounts) | |||||||||||
Preference shares (Note 21) | |||||||||||
| Balance at beginning of year | |||||||||||
| Balance at end of year | |||||||||||
Common shares (Note 21) | |||||||||||
| Balance at beginning of year | |||||||||||
| Shares issued on Sponsored Vehicles buy-in | |||||||||||
| Dividend Reinvestment and Share Purchase Plan | |||||||||||
| Shares issued on exercise of stock options | |||||||||||
| Balance at end of year | |||||||||||
| Additional paid-in capital | |||||||||||
| Balance at beginning of year | |||||||||||
| Stock-based compensation | |||||||||||
Sponsored Vehicles buy-in (Note 20) | ( | ||||||||||
| Repurchase of noncontrolling interest | |||||||||||
| Options exercised | ( | ( | ( | ||||||||
Dilution gain on Spectra Energy Partners, LP restructuring (Note 20) | |||||||||||
| Change in reciprocal interest | |||||||||||
| Other | ( | ||||||||||
Sale of noncontrolling interest in subsidiaries (Note 20) | |||||||||||
| Balance at end of year | |||||||||||
| Deficit | |||||||||||
| Balance at beginning of year | ( | ( | ( | ||||||||
| Earnings attributable to controlling interests | |||||||||||
| Preference share dividends | ( | ( | ( | ||||||||
| Common share dividends declared | ( | ( | ( | ||||||||
| Dividends paid to reciprocal shareholder | |||||||||||
| ( | — | — | |||||||||
| — | — | ( | |||||||||
| Redemption value adjustment to redeemable noncontrolling interests | ( | ||||||||||
| Other | ( | ( | |||||||||
| Balance at end of year | ( | ( | ( | ||||||||
Accumulated other comprehensive income/(loss) (Note 23) | |||||||||||
| Balance at beginning of year | ( | ( | |||||||||
Impact of Sponsored Vehicles buy-in | ( | ||||||||||
| Other comprehensive income/(loss) attributable to common shareholders, net of tax | ( | ( | |||||||||
| Other | |||||||||||
| Balance at end of year | ( | ( | |||||||||
Reciprocal shareholding (Note 13) | |||||||||||
| Balance at beginning of year | ( | ( | ( | ||||||||
| Change in reciprocal interest | |||||||||||
| Balance at end of year | ( | ( | ( | ||||||||
| Total Enbridge Inc. shareholders’ equity | |||||||||||
Noncontrolling interests (Note 20) | |||||||||||
| Balance at beginning of year | |||||||||||
| Earnings attributable to noncontrolling interests | |||||||||||
| Other comprehensive income/(loss) attributable to noncontrolling interests, net of tax | |||||||||||
| Change in unrealized gain/(loss) on cash flow hedges | ( | ( | |||||||||
| Foreign currency translation adjustments | ( | ( | |||||||||
| Reclassification to earnings of loss on cash flow hedges | |||||||||||
| ( | ( | ||||||||||
| Comprehensive income/(loss) attributable to noncontrolling interests | |||||||||||
| Distributions | ( | ( | ( | ||||||||
| Contributions | |||||||||||
Spectra Energy Partners, LP restructuring (Note 20) | ( | ||||||||||
| Sale of noncontrolling interests in subsidiaries | |||||||||||
Change in noncontrolling interests on Sponsored Vehicles buy-in (Note 20) | ( | ||||||||||
Redemption of noncontrolling interests (Note 20) | ( | ( | ( | ||||||||
| Repurchase of noncontrolling interest | ( | ||||||||||
| Dilution gain and other | ( | ( | ( | ||||||||
| Balance at end of year | |||||||||||
| Total equity | |||||||||||
| Dividends paid per common share | |||||||||||
The accompanying notes are an integral part of these consolidated financial statements.
107
ENBRIDGE INC.
CONSOLIDATED STATEMENTS OF CASH FLOWS
| Year ended December 31, | 2020 | 2019 | 2018 | ||||||||
| (millions of Canadian dollars) | |||||||||||
| Operating activities | |||||||||||
| Earnings | |||||||||||
| Adjustments to reconcile earnings to net cash provided by operating activities: | |||||||||||
| Depreciation and amortization | |||||||||||
Deferred income tax expense/(recovery) (Note 25) | ( | ||||||||||
Changes in unrealized (gain)/loss on derivative instruments, net (Note 24) | ( | ( | |||||||||
| Earnings from equity investments | ( | ( | ( | ||||||||
| Distributions from equity investments | |||||||||||
| Impairment of long-lived assets | |||||||||||
| Impairment of equity investments | |||||||||||
| Impairment of goodwill | |||||||||||
| (Gain)/loss on dispositions | ( | ||||||||||
| Other | |||||||||||
Changes in operating assets and liabilities (Note 28) | ( | ||||||||||
| Net cash provided by operating activities | |||||||||||
| Investing activities | |||||||||||
| Capital expenditures | ( | ( | ( | ||||||||
| Long-term investments and restricted long-term investments | ( | ( | ( | ||||||||
| Distributions from equity investments in excess of cumulative earnings | |||||||||||
| Additions to intangible assets | ( | ( | ( | ||||||||
| Acquisition | ( | ||||||||||
| Proceeds from dispositions | |||||||||||
| Other | ( | ( | |||||||||
| Affiliate loans, net | ( | ( | ( | ||||||||
| Net cash used in investing activities | ( | ( | ( | ||||||||
| Financing activities | |||||||||||
Net change in short-term borrowings (Note 18) | ( | ( | |||||||||
| Net change in commercial paper and credit facility draws | ( | ||||||||||
| Debenture and term note issues, net of issue costs | |||||||||||
| Debenture and term note repayments | ( | ( | ( | ||||||||
| Sale of noncontrolling interest in subsidiary | |||||||||||
| Contributions from noncontrolling interests | |||||||||||
| Distributions to noncontrolling interests | ( | ( | ( | ||||||||
| Contributions from redeemable noncontrolling interests | |||||||||||
| Distributions to redeemable noncontrolling interests | ( | ||||||||||
| Sponsored Vehicle buy-in cash payment | ( | ||||||||||
| Redemption of noncontrolling interests | ( | ( | |||||||||
| Common shares issued | |||||||||||
| Preference share dividends | ( | ( | ( | ||||||||
| Common share dividends | ( | ( | ( | ||||||||
| Other | ( | ( | ( | ||||||||
| Net cash used in financing activities | ( | ( | ( | ||||||||
| Effect of translation of foreign denominated cash and cash equivalents and restricted cash | ( | ||||||||||
| Net increase/(decrease) in cash and cash equivalents and restricted cash | ( | ||||||||||
| Cash and cash equivalents and restricted cash at beginning of year | |||||||||||
| Cash and cash equivalents and restricted cash at end of year | |||||||||||
| Supplementary cash flow information | |||||||||||
| Cash paid for income taxes | |||||||||||
| Cash paid for interest, net of amount capitalized | |||||||||||
| Property, plant and equipment non-cash accruals | |||||||||||
The accompanying notes are an integral part of these consolidated financial statements.
108
ENBRIDGE INC.
CONSOLIDATED STATEMENTS OF FINANCIAL POSITION
| December 31, | 2020 | 2019 | ||||||
| (millions of Canadian dollars; number of shares in millions) | ||||||||
| Assets | ||||||||
| Current assets | ||||||||
| Cash and cash equivalents | ||||||||
| Restricted cash | ||||||||
Accounts receivable and other (Note 9) | ||||||||
| Accounts receivable from affiliates | ||||||||
Inventory (Note 10) | ||||||||
Property, plant and equipment, net (Note 11) | ||||||||
Long-term investments (Note 13) | ||||||||
Restricted long-term investments (Note 14) | ||||||||
| Deferred amounts and other assets | ||||||||
Intangible assets, net (Note 15) | ||||||||
Goodwill (Note 16) | ||||||||
Deferred income taxes (Note 25) | ||||||||
| Total assets | ||||||||
| Liabilities and equity | ||||||||
| Current liabilities | ||||||||
Short-term borrowings (Note 18) | ||||||||
Accounts payable and other (Note 17) | ||||||||
| Accounts payable to affiliates | ||||||||
| Interest payable | ||||||||
Current portion of long-term debt (Note 18) | ||||||||
Long-term debt (Note 18) | ||||||||
| Other long-term liabilities | ||||||||
Deferred income taxes (Note 25) | ||||||||
Commitments and contingencies (Note 30) | ||||||||
| Equity | ||||||||
Share capital (Note 21) | ||||||||
| Preference shares | ||||||||
Common shares ( | ||||||||
| Additional paid-in capital | ||||||||
| Deficit | ( | ( | ||||||
Accumulated other comprehensive loss (Note 23) | ( | ( | ||||||
| Reciprocal shareholding | ( | ( | ||||||
| Total Enbridge Inc. shareholders’ equity | ||||||||
Noncontrolling interests (Note 20) | ||||||||
| Total liabilities and equity | ||||||||
Variable Interest Entities (VIE) (Note 12)
The accompanying notes are an integral part of these consolidated financial statements.
109
NOTES TO THE CONSOLIDATED FINANCIAL STATEMENTS
INDEX
| Page | ||||||||
| 1. | Business Overview | |||||||
| 2. | Significant Accounting Policies | |||||||
| 3. | Changes in Accounting Policies | |||||||
| 4. | Revenue | |||||||
| 5. | Segmented Information | |||||||
| 6. | Earnings per Common Share | |||||||
| 7. | Regulatory Matters | |||||||
| 8. | Dispositions | |||||||
| 9. | Accounts Receivable and Other | |||||||
| 10. | Inventory | |||||||
| 11. | Property, Plant and Equipment | |||||||
| 12. | Variable Interest Entities | |||||||
| 13. | Long-Term Investments | |||||||
| 14. | Restricted Long-Term Investments | |||||||
| 15. | Intangible Assets | |||||||
| 16. | Goodwill | |||||||
| 17. | Accounts Payable and Other | |||||||
| 18. | Debt | |||||||
| 19. | Asset Retirement Obligations | |||||||
| 20. | Noncontrolling Interests | |||||||
| 21. | Share Capital | |||||||
| 22. | Stock Option and Stock Unit Plans | |||||||
| 23. | Components of Accumulated Other Comprehensive Income/(Loss) | |||||||
| 24. | Risk Management and Financial Instruments | |||||||
| 25. | Income Taxes | |||||||
| 26. | Pension and Other Postretirement Benefits | |||||||
| 27. | Leases | |||||||
| 28. | Changes in Operating Assets and Liabilities | |||||||
| 29. | Related Party Transactions | |||||||
| 30. | Commitments and Contingencies | |||||||
| 31. | Guarantees | |||||||
| 32. | Quarterly Financial Data (Unaudited) | |||||||
110
1. BUSINESS OVERVIEW
The terms “we,” “our,” “us” and “Enbridge” as used in this report refer collectively to Enbridge Inc. and its subsidiaries unless the context suggests otherwise. These terms are used for convenience only and are not intended as a precise description of any separate legal entity within Enbridge.
Enbridge is a publicly traded energy transportation and distribution company. We conduct our business through five business segments: Liquids Pipelines; Gas Transmission and Midstream; Gas Distribution and Storage; Renewable Power Generation; and Energy Services. These reporting segments are strategic business units established by senior management to facilitate the achievement of our long-term objectives, to aid in resource allocation decisions and to assess operational performance.
LIQUIDS PIPELINES
Liquids Pipelines consists of pipelines and related terminals in Canada and the United States of America (US) that transport various grades of crude oil and other liquid hydrocarbons, including the Mainline System, Regional Oil Sands System, Gulf Coast and Mid-Continent, Southern Lights Pipeline, Express-Platte System, Bakken System, and Feeder Pipelines and Other.
GAS TRANSMISSION AND MIDSTREAM
Gas Transmission and Midstream consists of investments in natural gas pipelines and gathering and processing facilities in Canada and the US, including US Gas Transmission, Canadian Gas Transmission, US Midstream and Other.
GAS DISTRIBUTION AND STORAGE
Gas Distribution and Storage consists of our natural gas utility operations, the core of which is Enbridge Gas Inc. (Enbridge Gas), which serves residential, commercial and industrial customers, located throughout Ontario. Gas Distribution and Storage also includes natural gas distribution activities in Quebec and an investment in Noverco Inc. (Noverco).
RENEWABLE POWER GENERATION
Renewable Power Generation consists primarily of investments in wind and solar power generating assets, as well as geothermal, waste heat recovery, and transmission assets. In North America, assets are primarily located in the provinces of Alberta, Saskatchewan, Ontario, and Quebec and in the states of Colorado, Texas, Indiana and West Virginia. We also have offshore wind assets in operation and under development located in the United Kingdom, Germany, and France.
ENERGY SERVICES
The Energy Services businesses in Canada and the US undertake physical commodity marketing activity and logistical services to manage our volume commitments on various pipeline systems. Energy Services also provides energy marketing services to North American refiners, producers and other customers.
ELIMINATIONS AND OTHER
111
2. SIGNIFICANT ACCOUNTING POLICIES
These consolidated financial statements are prepared in accordance with accounting principles generally accepted in the United States of America (US GAAP) . Amounts are stated in Canadian dollars unless otherwise noted. As a Securities and Exchange Commission (SEC) registrant, we are permitted to use US GAAP for purposes of meeting both our Canadian and US continuous disclosure requirements.
PRINCIPLES OF CONSOLIDATION
The consolidated financial statements include our accounts and accounts of our subsidiaries and VIEs for which we are the primary beneficiary. A VIE is a legal entity that does not have sufficient equity at risk to finance its activities without additional subordinated financial support or is structured such that equity investors lack the ability to make significant decisions relating to the entity’s operations through voting rights or do not substantively participate in the gains and losses of the entity. Upon inception of a contractual agreement, we perform an assessment to determine whether the arrangement contains a variable interest in a legal entity and whether that legal entity is a VIE. The primary beneficiary has both the power to direct the activities of the VIE that most significantly impact the entity’s economic performance and the obligation to absorb losses or the right to receive benefits from the VIE entity that could potentially be significant to the VIE. Where we conclude that we are the primary beneficiary of a VIE, we consolidate the accounts of that VIE. We assess all variable interests in the entity and use our judgment when determining if we are the primary beneficiary. Other qualitative factors that are considered include decision-making responsibilities, the VIE capital structure, risk and rewards sharing, contractual agreements with the VIE, voting rights and level of involvement of other parties. We assess the primary beneficiary determination for a VIE on an ongoing basis, if there are changes in the facts and circumstances related to a VIE. If an entity is determined to not be a VIE, the voting interest entity model is applied, where an investor holding the majority voting rights consolidates the entity. The consolidated financial statements also include the accounts of any limited partnerships where we represent the general partner and, based on all facts and circumstances, control such limited partnerships, unless the limited partner has substantive participating rights or substantive kick-out rights. For certain investments where we retain an undivided interest in assets and liabilities, we record our proportionate share of assets, liabilities, revenues and expenses.
112
REGULATION
Certain parts of our businesses are subject to regulation by various authorities including, but not limited to, the Canada Energy Regulator (CER), the Federal Energy Regulatory Commission (FERC), the Alberta Energy Regulator, the Ontario Energy Board (OEB) and La Régie de l’energie du Québec. Regulatory bodies exercise statutory authority over matters such as construction, rates and ratemaking and agreements with customers. To recognize the economic effects of the actions of the regulator, the timing of recognition of certain revenues and expenses in these operations may differ from that otherwise expected under US GAAP for non rate-regulated entities.
Regulatory assets represent amounts that are expected to be recovered from customers in future periods through rates. Regulatory liabilities represent amounts that are expected to be refunded to customers in future periods through rates or expected to be paid to cover future abandonment costs in relation to the CER’s Land Matters Consultation Initiative (LMCI). Long-term regulatory assets are recorded in Deferred amounts and other assets and current regulatory assets are recorded in Accounts receivable and other. Long-term regulatory liabilities are included in Other long-term liabilities and current regulatory liabilities are recorded in Accounts payable and other. Regulatory assets are assessed for impairment if we identify an event indicative of possible impairment. The recognition of regulatory assets and liabilities is based on the actions, or expected future actions, of the regulator. To the extent that the regulator’s actions differ from our expectations, the timing and amount of recovery or settlement of regulatory balances could differ significantly from those recorded. In the absence of rate regulation, we would generally not recognize regulatory assets or liabilities and the earnings impact would be recorded in the period the expenses are incurred or revenues are earned. A regulatory asset or liability is recognized in respect of deferred income taxes when it is expected the amounts will be recovered or settled through future regulator-approved rates. We believe that the recovery of our regulatory assets as at December 31, 2020 is probable over the periods described in Note 7 - Regulatory Matters.
Allowance for funds used during construction (AFUDC) is included in the cost of property, plant and equipment and is depreciated over future periods as part of the total cost of the related asset. AFUDC includes both an interest component and, if approved by the regulator, a cost of equity component, which are both capitalized based on rates set out in a regulatory agreement. The corresponding impact on earnings is included in Interest expense for the interest component and Other income for the equity component. In the absence of rate regulation, we would capitalize interest using a capitalization rate based on our cost of borrowing, whereas the capitalized equity component, the corresponding earnings during the construction phase and the subsequent depreciation relating to the equity component would not be recognized.
Under the pool method prescribed by certain regulators, it is not possible to identify the carrying value of the equity component of AFUDC or its effect on depreciation. Similarly, gains and losses on the retirement of certain specific fixed assets in any given year cannot be identified or quantified.
With the approval of regulators, certain operations capitalize a percentage of specified operating costs. These operations are authorized to charge depreciation and earn a return on the net book value of such capitalized costs in future years. In the absence of rate regulation, a portion of such operating costs would be charged to earnings in the year incurred.
113
REVENUE RECOGNITION
For businesses that are not rate-regulated, revenues are recorded when products have been delivered or services have been performed, the amount of revenue can be reliably measured and collectability is reasonably assured. Customer credit worthiness is assessed prior to agreement signing, as well as throughout the contract duration. Certain revenues from liquids and gas pipeline businesses are recognized under the terms of committed delivery contracts rather than the cash tolls received.
Long-term take-or-pay contracts, under which shippers are obligated to pay fixed amounts rateably over the contract period regardless of volumes shipped, may contain make-up rights. Make-up rights are earned by shippers when minimum volume commitments are not utilized during the period but under certain circumstances can be used to offset overages in future periods, subject to expiry periods. We recognize revenues associated with make-up rights at the earlier of when the make-up volume is shipped, the make-up right expires or when it is determined that the likelihood that the shipper will utilize the make-up right is remote.
Certain offshore pipeline transportation contracts require Enbridge to provide transportation services for the life of the underlying producing fields. Under these arrangements, shippers pay Enbridge a fixed monthly toll for a defined period of time which may be shorter than the estimated reserve life of the underlying producing fields, resulting in a contract period which extends past the period of cash collection. Fixed monthly toll revenues are recognized ratably over the committed volume made available to shippers throughout the contract period, regardless of when cash is received. For the years ended December 31, 2020, 2019 and 2018, cash received net of revenue recognized for contracts under make-up rights and similar deferred revenue arrangements was $292 million, $169 million, and $208 million, respectively.
For rate-regulated businesses, revenues are recognized in a manner that is consistent with the underlying agreements as approved by the regulators. Natural gas utilities revenues are recorded on the basis of regular meter readings and estimates of customer usage from the last meter reading to the end of the reporting period. Estimates are based on historical consumption patterns and heating degree days experienced. Heating degree days is a measure of coldness that is indicative of volumetric requirements for natural gas utilized for heating purposes in our distribution franchise area.
Since July 1, 2011, Canadian Mainline (excluding Lines 8 and 9) earnings are governed by the Competitive Toll Settlement (CTS), under which revenues are recorded when services are performed. Effective on that date, we prospectively discontinued the application of rate-regulated accounting for those assets with the exception of flow-through income taxes covered by specific rate orders.
Our Energy Services segment enters into commodity purchase and sale arrangements that are recorded gross because the related contracts are not held for trading purposes and we are acting as the principal in the transactions. For our energy marketing contracts, an estimate of revenues and commodity costs for the month of December is included in the Consolidated Statements of Earnings for each year based on the best available volume and price data for the commodity delivered and received.
114
DERIVATIVE INSTRUMENTS AND HEDGING
Non-qualifying Derivatives
Non-qualifying derivative instruments are used primarily to economically hedge foreign exchange, interest rate and commodity price earnings exposure. Non-qualifying derivatives are measured at fair value with changes in fair value recognized in earnings in Commodity Sales, Transportation and other services revenues, Commodity costs, Operating and administrative expense, Other income/(expense) and Interest expense.
Derivatives in Qualifying Hedging Relationships
We use derivative financial instruments to manage our exposure to changes in commodity prices, foreign exchange rates, interest rates and certain compensation tied to our share price. Hedge accounting is optional and requires Enbridge to document the hedging relationship and test the hedging item’s effectiveness in offsetting changes in fair values or cash flows of the underlying hedged item on an ongoing basis. We present the earnings effects of hedging items with the hedged transaction. Derivatives in qualifying hedging relationships are categorized as cash flow hedges, fair value hedges or net investment hedges.
Cash Flow Hedges
We use cash flow hedges to manage our exposure to changes in commodity prices, foreign exchange rates, interest rates and certain compensation tied to our share price. The change in the fair value of a cash flow hedging instrument is recorded in Other comprehensive income/(loss) (OCI) and is reclassified to earnings when the hedged item impacts earnings.
If a derivative instrument designated as a cash flow hedge ceases to be effective or is terminated, hedge accounting is discontinued and the gain or loss at that date is deferred in OCI and recognized in earnings concurrently with the related transaction. If an anticipated hedged transaction is no longer probable, the gain or loss is recognized immediately in earnings. Subsequent gains and losses from derivative instruments for which hedge accounting has been discontinued are recognized in earnings in the period in which they occur.
Fair Value Hedges
We may use fair value hedges to hedge the fair value of debt instruments. The change in the fair value of the hedging instrument is recorded in earnings with changes in the fair value of the hedged risk of the asset or liability that is designated as part of the hedging relationship. If a fair value hedge is discontinued or ceases to be effective, the hedged risk of the asset or liability ceases to be remeasured at fair value and the cumulative fair value adjustment to the carrying value of the hedged item is recognized in earnings over the remaining life of the hedged item.
Net Investment Hedges
Gains and losses arising from translation of net investment in foreign operations from their functional currencies to Enbridge’s Canadian dollar presentation currency are included in cumulative translation adjustments (CTA), a component of OCI. We designate foreign currency derivatives and US dollar denominated debt as hedges of net investments in US dollar denominated foreign operations. As a result, the change in the fair value of the foreign currency derivatives as well as the translation of US dollar denominated debt are reflected in OCI. Amounts recognized previously in Accumulated other comprehensive income/(loss) (AOCI) are reclassified to earnings when there is a reduction of the hedged net investment resulting from disposal of a foreign operation.
Classification of Derivatives
We recognize the fair market value of derivative instruments on the Consolidated Statements of Financial Position as current and non-current assets or liabilities depending on the timing of the settlements and the resulting cash flows associated with the instruments. Fair value amounts related to cash flows occurring beyond one year are classified as non-current.
115
Cash inflows and outflows related to derivative instruments are classified as Operating activities on the Consolidated Statements of Cash Flows.
Balance Sheet Offset
Assets and liabilities arising from derivative instruments may be offset in the Consolidated Statements of Financial Position when we have the legal right and intention to settle them on a net basis.
Transaction Costs
Transaction costs are incremental costs directly related to the acquisition of a financial asset or the issuance of a financial liability. We incur transaction costs primarily from the issuance of debt and account for these costs as a deduction from Long-term debt on the Statements of Financial Position. These costs are amortized using the effective interest rate method over the term of the related debt instrument and are recorded in Interest expense.
EQUITY INVESTMENTS
Equity investments over which we exercise significant influence, but do not have controlling financial interests, are accounted for using the equity method. Equity investments are initially measured at cost and are adjusted for our proportionate share of undistributed equity earnings or loss. Equity investments are increased for contributions made to and decreased for distributions received from the investees. To the extent an equity investee undertakes activities necessary to commence its planned principal operations, we capitalize interest costs associated with the investment during such period.
RESTRICTED LONG-TERM INVESTMENTS
Long-term investments that are restricted as to withdrawal or usage, for the purposes of the CER’s LMCI, are presented as Restricted long-term investments on the Consolidated Statements of Financial Position.
OTHER INVESTMENTS
Generally, we classify equity investments in entities over which we do not exercise significant influence and that do not have readily determinable fair values as other investments measured at fair value measurement alternative and recorded at cost minus impairment, if any, plus or minus changes resulting from observable price changes in orderly transactions for an identical or similar investment of the same issuer. Investments in equity securities measured using the fair value measurement alternative are reviewed for impairment each reporting period and written down to their fair value if objective evidence of impairment is identified. Equity investments with readily determinable fair values are measured at fair value through net income. Dividends received from investments in equity securities are recognized in earnings when the right to receive payment is established.
Investments in debt securities are classified either as available for sale securities measured at fair value through OCI or as held to maturity securities measured at amortized cost.
NONCONTROLLING INTERESTS
Noncontrolling interests represent ownership interests attributable to third parties in certain consolidated subsidiaries. The portion of equity not owned by us in such entities is reflected as Noncontrolling interests within the equity section of the Consolidated Statements of Financial Position.
INCOME TAXES
Income taxes are accounted for using the liability method. Deferred income tax assets and liabilities are recorded based on temporary differences between the tax bases of assets and liabilities and their carrying values for accounting purposes. Deferred income tax assets and liabilities are measured using the tax rate that is expected to apply when the temporary differences reverse. For our regulated operations, a deferred income tax liability or asset is recognized with a corresponding regulatory asset or liability, respectively, to the extent taxes can be recovered through rates. Any interest and/or penalty incurred related to tax is reflected in income taxes.
116
FOREIGN CURRENCY TRANSACTIONS AND TRANSLATION
Foreign currency transactions are those transactions whose terms are denominated in a currency other than the currency of the primary economic environment in which Enbridge or a reporting subsidiary operates, referred to as the functional currency. Transactions denominated in foreign currencies are translated into the functional currency using the exchange rate prevailing at the date of the transaction. Monetary assets and liabilities denominated in foreign currencies are translated to the functional currency using the rate of exchange in effect at the balance sheet date. Exchange gains and losses resulting from translation of monetary assets and liabilities are included in the Consolidated Statements of Earnings in the period in which they arise.
Gains and losses arising from translation of foreign operations’ functional currencies to our Canadian dollar presentation currency are included in the CTA component of AOCI and are recognized in earnings upon sale of the foreign operation. Asset and liability accounts are translated at the exchange rates in effect on the balance sheet date, while revenues and expenses are translated using monthly average exchange rates.
CASH AND CASH EQUIVALENTS
Cash and cash equivalents include short-term investments with a term to maturity of three months or less when purchased.
RESTRICTED CASH
Cash and cash equivalents that are restricted as to withdrawal or usage, in accordance with specific commercial arrangements, are presented as Restricted cash on the Consolidated Statements of Financial Position.
LOANS AND RECEIVABLES
Affiliate long-term notes receivable are measured at amortized cost using the effective interest rate method, net of any impairment losses recognized. Accounts receivable and other are measured at cost.
CURRENT EXPECTED CREDIT LOSSES
For accounts receivable, a loss allowance matrix is utilized to measure lifetime expected credit losses. The matrix contemplates historical credit losses by age of receivables, adjusted for any forward-looking information and management expectations. Other loan receivables and applicable off-balance sheet commitments utilize a discounted cash flow methodology which calculates the current expected credit losses based on historical default probability rates associated with the credit rating of the counterparty and the related term of the loan or commitment, adjusted for forward-looking information and management expectations.
NATURAL GAS IMBALANCES
The Consolidated Statements of Financial Position include in-kind balances as a result of differences in gas volumes received and delivered for customers. Since settlement of certain imbalances is in-kind, changes in the balances do not have an effect on our Consolidated Statements of Earnings or Consolidated Statements of Cash Flows. Most natural gas volumes owed to or by us are valued at natural gas market index prices as at the balance sheet dates.
117
INVENTORY
Inventory is comprised of natural gas in storage held by Enbridge Gas, and crude oil and natural gas held primarily by energy services businesses in the Energy Services segment. Natural gas in storage held by Enbridge Gas is recorded at the quarterly prices approved by the OEB in the determination of distribution rates. The actual price of gas purchased may differ from the OEB approved price. The difference between the approved price and the actual cost of the gas purchased is deferred as a liability for future refund or as an asset for collection as approved by the OEB. Other commodities inventory is recorded at the lower of cost, as determined on a weighted average basis, or market value. Upon disposition, other commodities inventory is recorded to Commodity costs on the Consolidated Statements of Earnings at the weighted average cost of inventory, including any adjustments recorded to reduce inventory to market value.
PROPERTY, PLANT AND EQUIPMENT
Property, plant and equipment is recorded at historical cost. Expenditures for construction, expansion, major renewals and betterments are capitalized. Maintenance and repair costs are expensed as incurred. Expenditures for project development are capitalized if they are expected to have future benefit. We capitalize interest incurred during construction for non-rate-regulated assets. For rate-regulated assets, AFUDC is included in the cost of property, plant and equipment and is depreciated over future periods as part of the total cost of the related asset. AFUDC includes both an interest component and, if approved by the regulator, a cost of equity component.
LEASES
We recognize an arrangement as a lease when a customer has the right to obtain substantially all of the economic benefits from the use of an asset, as well as the right to direct the use of the asset. We recognize right-of-use (ROU) assets and the related lease liabilities on the statements of financial position for operating lease arrangements with a term of 12 months or longer. We do not separate non-lease components from the associated lease components of our lessee contracts and account for both components as a single lease component. We combine lease and non-lease components within a contract for operating lessor leases when certain conditions are met. ROU assets are assessed for impairment using the same approach as is applied for other long-lived assets.
Lease liabilities and ROU assets require the use of judgment and estimates, which are applied in determining the term of a lease, appropriate discount rates, whether an arrangement contains a lease, whether there are any indicators of impairment for ROU assets and whether any ROU assets should be grouped with other long-lived assets for impairment testing.
DEFERRED AMOUNTS AND OTHER ASSETS
Deferred amounts and other assets primarily include costs which regulatory authorities have permitted, or are expected to permit, to be recovered through future rates including: deferred income taxes; contractual receivables under the terms of long-term delivery contracts; derivative financial instruments; and actuarial gains and losses arising from defined benefit pension plans.
118
INTANGIBLE ASSETS
Intangible assets consist primarily of certain software costs, customer relationships and emission allowances. We capitalize costs incurred during the application development stage of internal use software projects. Customer relationships represent the underlying relationship from long-term agreements with customers that are capitalized upon acquisition. Intangible assets are generally amortized on a straight-line basis over their expected lives, commencing when the asset is available for use, with the exception of emission allowances, which are not amortized as they will be used to satisfy compliance obligations as they come due.
GOODWILL
Goodwill represents the excess of the purchase price over the fair value of net identifiable assets on acquisition of a business. The carrying value of goodwill, which is not amortized, is assessed for impairment annually, or more frequently if events or changes in circumstances arise that suggest the carrying value of goodwill may be impaired. We perform our annual review of the goodwill balance on April 1.
We perform our annual review for impairment at the reporting unit level, which is identified by assessing whether the components of our operating segments constitute businesses for which discrete information is available, whether segment management regularly reviews the operating results of those components and whether the economic and regulatory characteristics are similar.
We have the option to first assess qualitative factors to determine whether it is necessary to perform the quantitative goodwill impairment assessment. When performing a qualitative assessment, we determine the drivers of fair value for each reporting unit and evaluate whether those drivers have been positively or negatively affected by relevant events and circumstances since the last fair value assessment. Our evaluation includes, but is not limited to, assessment of macroeconomic trends, regulatory environments, capital accessibility, operating income trends, and industry conditions. Based on our assessment of the qualitative factors, if we determine it is more likely than not that the fair value of the reporting unit is less than it's carrying amount, a quantitative goodwill impairment assessment is performed.
The quantitative goodwill impairment assessment involves determining the fair value of our reporting units and comparing those values to the carrying value of each reporting unit. If the carrying value of a reporting unit, including allocated goodwill, exceeds its fair value, goodwill impairment is measured at the amount by which the reporting unit’s carrying value exceeds its fair value. This amount should not exceed the carrying amount of goodwill. Fair value of our reporting units is estimated using a combination of discounted cash flow and earnings multiples techniques. The determination of fair value using the discounted cash flow technique requires the use of estimates and assumptions related to discount rates, projected operating income, terminal value growth rates, capital expenditures and working capital levels. Cash flow projections include significant judgments and assumptions relating to discount rates and expected future capital expenditures. The determination of fair value using the earnings multiples technique requires assumptions to be made in relation to maintainable earnings and earnings multipliers for reporting units.
The allocation of goodwill to held for sale and disposed businesses is based on the relative fair value of businesses included in the relevant reporting unit.
119
IMPAIRMENT
We review the carrying values of our long-lived assets as events or changes in circumstances warrant. If it is determined that the carrying value of an asset exceeds the undiscounted cash flows expected from the asset, we calculate fair value based on the discounted cash flows and write the assets down to the extent that the carrying value exceeds the fair value.
With respect to investments in debt securities and equity investments, we assess at each balance sheet date whether there is objective evidence that a financial asset is impaired by completing a quantitative or qualitative analysis of factors impacting the investment. If there is objective evidence of impairment, we value the expected discounted cash flows using observable market inputs. We determine whether the decline below carrying value is other than temporary for equity method investments or is due to a credit loss for investments in debt securities. If the decline is determined to be other than temporary for equity method investments or is due to a credit loss for investments in debt securities, an impairment charge is recorded in earnings with an offsetting reduction to the carrying value of the asset.
ASSET RETIREMENT OBLIGATIONS
ARO associated with the retirement of long-lived assets are measured at fair value and recognized as Accounts payable and other or Other long-term liabilities in the period in which they can be reasonably determined. The fair value approximates the cost a third party would charge to perform the tasks necessary to retire such assets and is recognized at the present value of expected future cash flows. ARO are added to the carrying value of the associated asset and depreciated over the asset’s useful life. The corresponding liability is accreted over time through charges to earnings and is reduced by actual costs of decommissioning and reclamation. Our estimates of retirement costs could change as a result of changes in cost estimates and regulatory requirements. Currently, for the majority of our assets, there is insufficient data or information to reasonably determine the timing of settlement for estimating the fair value of the ARO.
PENSION AND OTHER POSTRETIREMENT BENEFITS
We sponsor defined benefit and defined contribution pension plans, and defined benefit OPEB plans, which provide group health care, life insurance benefits and other postretirement benefits.
Defined benefit pension obligation and net periodic benefit cost are estimated using the projected unit credit method, which incorporates management’s best estimates of future salary levels, other cost escalations, retirement ages of employees and other actuarial factors including discount rates and mortality. The OPEB benefit obligation and net periodic benefit cost are estimated using the projected unit credit method, where benefits are attributed to years of service, taking into consideration projection of benefit costs.
We use mortality tables issued by the Society of Actuaries in the US (revised in 2020) and the Canadian Institute of Actuaries (revised in 2014) to measure the benefit obligations of our US pension plans (the US Plans) and our Canadian pension plans (the Canadian Plans), respectively.
We determine discount rates by reference to rates of high-quality long-term corporate bonds with maturities that approximate the timing of future payments we anticipate making under each of the respective plans.
Funded pension and OPEB plan assets are measured at fair value. The expected return on funded pension and OPEB plan assets is determined using market related values and assumptions on the invested asset mix consistent with the investment policies relating to the plan assets. The market related values reflect estimated return on investments consistent with long-term historical averages for similar assets.
120
Actuarial gains and losses arise from the difference between the actual and expected rate of return on plan assets for that period (funded pension and OPEB plans) or from changes in actuarial assumptions used to determine the accrued benefit obligation, including discount rate, changes in headcount and salary inflation experience.
The excess of the fair value of a plan’s assets over the fair value of a plan’s benefit obligation is recognized as Deferred amounts and other assets in our Consolidated Statements of Financial Position. The excess of the fair value of a plan’s benefit obligation over the fair value of a plan’s assets is recognized as Accounts payable and other and Other long-term liabilities in our Consolidated Statements of Financial Position.
Net periodic benefit cost is charged to Earnings and includes:
•cost of benefits provided in exchange for employee services rendered during the year (current service cost);
•interest cost of plan obligations;
•expected return on plan assets (funded pension and OPEB plans);
•amortization of prior service costs on a straight-line basis over the expected average remaining service period of the active employee group covered by the plans; and
•amortization of cumulative unrecognized net actuarial gains and losses in excess of 10% of the greater of the accrued benefit obligation or the fair value of plan assets, over the expected average remaining service life of the active employee group covered by the plans.
Cumulative unrecognized net actuarial gains and losses and prior service costs arising from defined benefit pension plans for our non-utility operations and from defined benefit OPEB plans are presented as a component of AOCI in our Consolidated Statements of Changes in Equity. Any unrecognized actuarial gains and losses and prior service costs and credits related to those plans that arise during the period are recognized as a component of OCI, net of tax. Cumulative unrecognized net actuarial gains and losses and prior service costs arising from defined benefit pension plans for our utility operations, which have been permitted or are expected to be permitted by the Regulators, to be recovered through future rates, are presented as a component of Deferred amounts and other assets in our Consolidated Statements of
Financial Position.
Our utility operations also record regulatory adjustments to reflect the difference between certain net periodic benefit costs for accounting purposes and net periodic benefit costs for ratemaking purposes. Offsetting regulatory assets or liabilities are recorded to the extent net periodic benefit costs are expected to be collected from or refunded to customers, respectively, in future rates. In the absence of rate regulation, regulatory assets or liabilities would not be recorded and net periodic benefit costs would be charged to Earnings and OCI on an accrual basis.
STOCK-BASED COMPENSATION
Incentive Stock Options (ISO) granted are recorded using the fair value method. Under this method, compensation expense is measured at the grant date based on the fair value of the ISO granted as calculated by the Black-Scholes-Merton model and is recognized on a straight-line basis over the shorter of the vesting period or the period to early retirement eligibility, with a corresponding credit to Additional paid-in capital. Balances in Additional paid-in capital are transferred to Share capital when the options are exercised.
121
COMMITMENTS, CONTINGENCIES AND ENVIRONMENTAL LIABILITIES
We expense or capitalize, as appropriate, expenditures for ongoing compliance with environmental regulations that relate to past or current operations. We expense costs incurred for remediation of existing environmental contamination caused by past operations that do not benefit future periods by preventing or eliminating future contamination. We record liabilities for environmental matters when assessments indicate that remediation efforts are probable and the costs can be reasonably estimated. Estimates of environmental liabilities are based on currently available facts, existing technology and presently enacted laws and regulations taking into consideration the likely effects of inflation and other factors. These amounts also consider prior experience in remediating contaminated sites, other companies’ clean-up experience and data released by government organizations. Our estimates are subject to revision in future periods based on actual costs or new information and are included in Other long-term liabilities in the Consolidated Statements of Financial Position at their undiscounted amounts. There is always a potential of incurring additional costs in connection with environmental liabilities due to variations in any or all of the categories described above, including modified or revised requirements from regulatory agencies, in addition to fines and penalties, as well as expenditures associated with litigation and settlement of claims. We evaluate recoveries from insurance coverage separately from the liability and, when recovery is probable, we record and report an asset separately from the associated liability in the Consolidated Statements of Financial Position.
Liabilities for other commitments and contingencies are recognized when, after fully analyzing available information, we determine it is either probable that an asset has been impaired, or that a liability has been incurred, and the amount of impairment or loss can be reasonably estimated. When a range of probable loss can be estimated, we recognize the most likely amount, or if no amount is more likely than another, the minimum of the range of probable loss is accrued. We expense legal costs associated with loss contingencies as such costs are incurred.
3. CHANGES IN ACCOUNTING POLICIES
CHANGES IN ACCOUNTING POLICIES
There were no changes in accounting policies during the year ended December 31, 2020.
ADOPTION OF NEW ACCOUNTING STANDARDS
Reference Rate Reform
Effective July 1, 2020, we adopted Accounting Standards Update (ASU) 2020-04 on a prospective basis. The new standard was issued in March 2020 to provide temporary optional guidance in accounting for reference rate reform. The new guidance provides optional expedients and exceptions for applying generally accepted accounting principles when accounting for contract modifications, hedging relationships and other transactions impacted by rate reform, subject to meeting certain criteria. For eligible hedging relationships existing as at October 1, 2020 and prospectively, we have applied the optional expedients which allow an entity to assume that the hedged forecasted transaction in a cash flow hedge is probable of occurring and the hedged forecasted reference rate matches the hedging instrument for effectiveness assessment. ASU 2020-04 is effective until December 31, 2022. The adoption of this ASU did not have a material impact on our consolidated financial statements.
122
Clarifying Interaction between Collaborative Arrangements and Revenue from Contracts with Customers
Effective January 1, 2020, we adopted ASU 2018-18 on a retrospective basis. The new standard was issued in November 2018 to provide clarity on when transactions between entities in a collaborative arrangement should be accounted for under the new revenue standard, Accounting Standards Codification (ASC) 606. In determining whether transactions in collaborative arrangements should be accounted for under the revenue standard, the update specifies that entities shall apply unit of account guidance to identify distinct goods or services and whether such goods and services are separately identifiable from other promises in the contract. ASU 2018-18 also precludes entities from presenting transactions with a collaborative partner which are not in scope of the new revenue standard together with revenue from contracts with customers. The adoption of this ASU did not have a material impact on our consolidated financial statements.
Disclosure Effectiveness
Effective January 1, 2020, we adopted ASU 2018-13 on both a retrospective and prospective basis depending on the change. The new standard was issued to improve the disclosure requirements for fair value measurements by eliminating and modifying some disclosures requirements, while also adding new disclosure requirements. The adoption of this ASU did not have a material impact on our consolidated financial statements.
Accounting for Credit Losses
Effective January 1, 2020, we adopted ASU 2016-13 on a modified retrospective basis.
The new standard was issued in June 2016 with the intent of providing financial statement users with more useful information about the expected credit losses on financial instruments and other commitments to extend credit held by a reporting entity at each reporting date. The previous accounting treatment used the incurred loss methodology for recognizing credit losses that delayed the recognition until it was probable a loss had been incurred. The accounting update adds a new impairment model, known as the current expected credit loss model, which is based on expected losses rather than incurred losses. Under the new guidance, an entity recognizes as an allowance its estimate of expected credit losses, which the Financial Accounting Standards Board believes results in more timely recognition of such losses.
Further, ASU 2018-19 was issued in November 2018 to clarify that operating lease receivables should be accounted for under the new leases standard, ASC 842, and are not within the scope of ASC 326, Financial Instruments - Credit Losses.
For accounts receivable, a loss allowance matrix is utilized to measure lifetime expected credit losses. The matrix contemplates historical credit losses by age of receivables, adjusted for any forward-looking information and management expectations. Other loan receivables and off-balance sheet commitments in scope of the new standard utilize a discounted cash flow methodology which calculates the current expected credit losses based on historical default probability rates associated with the credit rating of the counterparty and the related term of the loan or commitment, adjusted for forward-looking information and management expectations.
On January 1, 2020, we recorded $66 million of additional Deficit on our Statements of Financial Position in connection with the adoption of ASU 2016-13. The adoption of this ASU did not have a material impact on the Consolidated Statements of Earnings, Comprehensive Income or Cash Flows during the period.
123
FUTURE ACCOUNTING POLICY CHANGES
Accounting for Convertible Instruments and Contracts in an Entity’s Own Equity
ASU 2020-06 was issued in August 2020 to simplify accounting for certain financial instruments. The ASU eliminates the current models that require separation of beneficial conversion and cash conversion features from convertible instruments and simplifies the derivative scope exception guidance pertaining to equity classification of contracts in an entity’s own equity. The ASU also introduces additional disclosures for convertible debt and freestanding instruments that are indexed to and settled in an entity’s own equity. The ASU amends the diluted earnings per share guidance, including the requirement to use if-converted method for all convertible instruments and an update for instruments that can be settled in either cash or shares. ASU 2020-06 is effective January 1, 2022 and should be applied on a full or modified retrospective basis, with early adoption permitted on January 1, 2021. We are currently assessing the impact of the new standard on our consolidated financial statements.
Clarifying Interaction between Equity Securities, Equity Method Investments and Derivatives
ASU 2020-01 was issued in January 2020 and clarifies that observable transactions should be considered for the purpose of applying the measurement alternative in accordance with ASC 321 immediately before the application or upon discontinuance of the equity method of accounting. Furthermore, the ASU clarifies that forward contracts or purchased options on equity securities are not out of scope of ASC 815 guidance only because, upon the contracts’ exercise, the equity securities could be accounted for under the equity method of accounting or fair value option. ASU 2020-01 is effective January 1, 2021, with early adoption permitted, and is applied prospectively. The adoption of ASU 2020-01 is not expected to have a material impact on our consolidated financial statements.
Accounting for Income Taxes
ASU 2019-12 was issued in December 2019 with the intent of simplifying the accounting for income taxes. The accounting update removes certain exceptions to the general principles in ASC 740 as well as provides simplification by clarifying and amending existing guidance. ASU 2019-12 is effective January 1, 2021, and entities are permitted to adopt the standard early. The adoption of ASU 2019-12 is not expected to have a material impact on our consolidated financial statements.
Disclosure Effectiveness
ASU 2018-14 was issued in August 2018 to improve disclosure requirements for employers that sponsor defined benefit pension or other postretirement plans. The amendment modifies the current guidance by adding and removing several disclosure requirements while also clarifying the guidance on current disclosure requirements. ASU 2018-14 is effective January 1, 2021, and entities are permitted to adopt the standard early. The adoption of ASU 2018-14 is not expected to have a material impact on our consolidated financial statements.
124
4. REVENUE
REVENUE FROM CONTRACTS WITH CUSTOMERS
Major Products and Services
| Liquids Pipelines | Gas Transmission and Midstream | Gas Distribution and Storage | Renewable Power Generation | Energy Services | Eliminations and Other | Consolidated | |||||||||||||||||
| Year ended December 31, 2020 | |||||||||||||||||||||||
| (millions of Canadian dollars) | |||||||||||||||||||||||
| Transportation revenue | |||||||||||||||||||||||
| Storage and other revenue | |||||||||||||||||||||||
Gas gathering and processing revenue | |||||||||||||||||||||||
| Gas distribution revenue | |||||||||||||||||||||||
Electricity and transmission revenue | |||||||||||||||||||||||
Total revenue from contracts with customers | |||||||||||||||||||||||
| Commodity sales | |||||||||||||||||||||||
Other revenue1,2 | ( | ||||||||||||||||||||||
| Intersegment revenue | ( | — | |||||||||||||||||||||
| Total revenue | ( | ||||||||||||||||||||||
| Liquids Pipelines | Gas Transmission and Midstream | Gas Distribution and Storage | Renewable Power Generation | Energy Services | Eliminations and Other | Consolidated | |||||||||||||||||
| Year ended December 31, 2019 | |||||||||||||||||||||||
| (millions of Canadian dollars) | |||||||||||||||||||||||
| Transportation revenue | |||||||||||||||||||||||
| Storage and other revenue | |||||||||||||||||||||||
Gas gathering and processing revenue | |||||||||||||||||||||||
| Gas distribution revenue | |||||||||||||||||||||||
Electricity and transmission revenue | |||||||||||||||||||||||
| Commodity sales | |||||||||||||||||||||||
Total revenue from contracts with customers | |||||||||||||||||||||||
| Commodity sales | |||||||||||||||||||||||
Other revenue1,2 | ( | ( | |||||||||||||||||||||
| Intersegment revenue | ( | — | |||||||||||||||||||||
| Total revenue | ( | ||||||||||||||||||||||
125
| Liquids Pipelines | Gas Transmission and Midstream | Gas Distribution and Storage | Renewable Power Generation | Energy Services | Eliminations and Other | Consolidated | |||||||||||||||||
| Year ended December 31, 2018 | |||||||||||||||||||||||
| (millions of Canadian dollars) | |||||||||||||||||||||||
| Transportation revenue | |||||||||||||||||||||||
| Storage and other revenue | |||||||||||||||||||||||
Gas gathering and processing revenue | |||||||||||||||||||||||
| Gas distribution revenue | |||||||||||||||||||||||
Electricity and transmission revenue | |||||||||||||||||||||||
| Commodity sales | |||||||||||||||||||||||
Total revenue from contracts with customers | |||||||||||||||||||||||
| Commodity sales | |||||||||||||||||||||||
Other revenue1 | ( | ( | |||||||||||||||||||||
| Intersegment revenue | ( | — | |||||||||||||||||||||
| Total revenue | ( | ||||||||||||||||||||||
1 Includes mark-to-market gains/(losses) from our hedging program for the year ended December 31, 2020 of $265 million gain, (2019 - $346 million gain, 2018 - $1.1 billion loss).
2 Includes revenues from lease contracts. Refer to Note 27 Leases.
We disaggregate revenue into categories which represent our principal performance obligations within each business segment. These revenue categories represent the most significant revenue streams in each segment and consequently are considered to be the most relevant revenue information for management to consider in evaluating performance.
Contract Balances
| Contract Receivables | Contract Assets | Contract Liabilities | |||||||||
| (millions of Canadian dollars) | |||||||||||
| Balance as at December 31, 2020 | |||||||||||
| Balance as at December 31, 2019 | |||||||||||
Contract receivables represent the amount of receivables derived from contracts with customers.
Contract assets represent the amount of revenue which has been recognized in advance of payments received for performance obligations we have fulfilled (or partially fulfilled) and prior to the point in time at which our right to the payment is unconditional. Amounts included in contract assets are transferred to accounts receivable when our right to the consideration becomes unconditional.
Contract liabilities represent payments received for performance obligations which have not been fulfilled. Contract liabilities primarily relate to make-up rights and deferred revenue. Revenue recognized during the year ended December 31, 2020 included in contract liabilities at the beginning of the period is $174 million. Increases in contract liabilities from cash received, net of amounts recognized as revenue during the year ended December 31, 2020 were $591 million.
126
Performance Obligations
| Segment | Nature of Performance Obligation | ||||
| Liquids Pipelines | •Transportation and storage of crude oil and natural gas liquids (NGLs) | ||||
| Gas Transmission and Midstream | •Transportation, storage, gathering, compression and treating of natural gas | ||||
•Transportation of NGLs | |||||
•Sale of crude oil, natural gas and NGLs | |||||
| Gas Distribution and Storage | •Supply and delivery of natural gas | ||||
•Transportation of natural gas | |||||
•Storage of natural gas | |||||
| Renewable Power Generation | •Generation and transmission of electricity | ||||
•Delivery of electricity from renewable energy generation facilities | |||||
There was no material revenue recognized in the year ended December 31, 2020 from performance obligations satisfied in previous periods.
Payment Terms
Payments are received monthly from customers under long-term transportation, commodity sales, and gas gathering and processing contracts. Payments from Gas Distribution and Storage customers are received on a continuous basis based on established billing cycles.
Certain contracts in the US offshore business provide for us to receive a series of fixed monthly payments (FMPs) for a specified period which is less than the period during which the performance obligations are satisfied. As a result, a portion of the FMPs are recorded as contract liabilities. The FMPs are not considered to be a financing arrangement because the payments are scheduled to match the production profiles of offshore oil and gas fields, which generate greater revenue in the initial years of their productive lives.
Revenue to be Recognized from Unfulfilled Performance Obligations
Total revenue from performance obligations expected to be fulfilled in future periods is $59.5 billion, of which $6.8 billion is expected to be recognized during the year ended December 31, 2021.
The revenues excluded from the amounts above based on optional exemptions available under ASC 606, as explained below, represent a significant portion of our overall revenues and revenues from contracts with customers. Certain revenues such as flow-through operating costs charged to shippers are recognized at the amount for which we have the right to invoice our customers and are excluded from the amounts of revenue to be recognized in the future from unfulfilled performance obligations above. Variable consideration is excluded from the amounts above due to the uncertainty of the associated consideration, which is generally resolved when actual volumes and prices are determined. For example, we consider interruptible transportation service revenues to be variable revenues since volumes cannot be estimated. Additionally, the effect of escalation on certain tolls which are contractually escalated for inflation has not been reflected in the amounts above as it is not possible to reliably estimate future inflation rates. Revenues for periods extending beyond the current rate settlement term for regulated contracts where the tolls are periodically reset by the regulator are excluded from the amounts above since future tolls remain unknown. Finally, revenues from contracts with customers which have an original expected duration of one year or less are excluded from the amounts above.
127
SIGNIFICANT JUDGMENTS MADE IN RECOGNIZING REVENUE
Long-Term Transportation Agreements
For long-term transportation agreements, significant judgments pertain to the period over which revenue is recognized and whether the agreement provides for make-up rights for the shippers. Transportation revenue earned from firm contracted capacity arrangements is recognized ratably over the contract period. Transportation revenue from interruptible or volumetric-based arrangements is recognized when services are performed.
Estimates of Variable Consideration
Revenue from arrangements subject to variable consideration is recognized only to the extent that it is probable that a significant reversal in the amount of cumulative revenue recognized will not occur when the uncertainty associated with the variable consideration is subsequently resolved. Uncertainties associated with variable consideration relate principally to differences between estimated and actual volumes and prices. These uncertainties are resolved each month when actual volumes are sold or transported and actual tolls and prices are determined.
Recognition and Measurement of Revenue
| Liquids Pipelines | Gas Transmission and Midstream | Gas Distribution and Storage | Renewable Power Generation | Consolidated | |||||||||||||
| Year ended December 31, 2020 | |||||||||||||||||
| (millions of Canadian dollars) | |||||||||||||||||
Revenue from products transferred at a point in time | |||||||||||||||||
Revenue from products and services transferred over time2 | |||||||||||||||||
Total revenue from contracts with customers | |||||||||||||||||
| Liquids Pipelines | Gas Transmission and Midstream | Gas Distribution and Storage | Renewable Power Generation | Consolidated | |||||||||||||
| Year ended December 31, 2019 | |||||||||||||||||
| (millions of Canadian dollars) | |||||||||||||||||
| Revenue from products transferred at a point in time | |||||||||||||||||
Revenue from products and services transferred over time2 | |||||||||||||||||
Total revenue from contracts with customers | |||||||||||||||||
| Liquids Pipelines | Gas Transmission and Midstream | Gas Distribution and Storage | Renewable Power Generation | Consolidated | |||||||||||||
| Year ended December 31, 2018 | |||||||||||||||||
| (millions of Canadian dollars) | |||||||||||||||||
Revenue from products transferred at a point in time1 | |||||||||||||||||
Revenue from products and services transferred over time2 | |||||||||||||||||
Total revenue from contracts with customers | |||||||||||||||||
1 Revenue from sales of crude oil, natural gas and NGLs. Revenue from commodity sales where the commodity sold is not immediately consumed prior to use is recognized at the point in time when the contractually specified volume of the commodity has been delivered.
2 Revenue from crude oil and natural gas pipeline transportation, storage, natural gas gathering, compression and treating, natural gas distribution, natural gas storage services and electricity sales.
128
Performance Obligations Satisfied Over Time
For arrangements involving the transportation and sale of petroleum products and natural gas where the transportation services or commodities are simultaneously received and consumed by the shipper or customer, we recognize revenue over time using an output method based on volumes of commodities delivered or transported. The measurement of the volumes transported or delivered corresponds directly to the benefits received by the shippers or customers during that period.
Determination of Transaction Prices
Prices for gas processing and transportation services are determined based on the capital cost of the facilities, pipelines and associated infrastructure required to provide such services plus a rate of return on capital invested that is determined either through negotiations with customers or through regulatory processes for those operations that are subject to rate regulation.
Prices for commodities sold are determined by reference to market price indices plus or minus a negotiated differential and in certain cases a marketing fee.
Prices for natural gas sold and distribution services provided by regulated natural gas distribution operations are prescribed by regulation.
5. SEGMENTED INFORMATION
Segmented information for the years ended December 31, 2020, 2019 and 2018 is as follows:
| Year ended December 31, 2020 | Liquids Pipelines | Gas Transmission and Midstream | Gas Distribution and Storage | Renewable Power Generation | Energy Services | Eliminations and Other | Consolidated | ||||||||||||||||
(millions of Canadian dollars) | |||||||||||||||||||||||
Revenues | ( | ||||||||||||||||||||||
Commodity and gas distribution costs | ( | ( | ( | ( | ( | ||||||||||||||||||
Operating and administrative | ( | ( | ( | ( | ( | ( | ( | ||||||||||||||||
Income/(loss) from equity investments | ( | ( | |||||||||||||||||||||
| Impairment of equity investments | ( | ( | |||||||||||||||||||||
Other income/(expense) | ( | ||||||||||||||||||||||
| Earnings/(loss) before interest, income tax expense, and depreciation and amortization | ( | ( | |||||||||||||||||||||
| Depreciation and amortization | ( | ||||||||||||||||||||||
Interest expense | ( | ||||||||||||||||||||||
Income tax expense | ( | ||||||||||||||||||||||
Earnings | |||||||||||||||||||||||
Capital expenditures1 | |||||||||||||||||||||||
Total property, plant and equipment, net | |||||||||||||||||||||||
129
| Year ended December 31, 2019 | Liquids Pipelines | Gas Transmission and Midstream | Gas Distribution and Storage | Renewable Power Generation | Energy Services | Eliminations and Other | Consolidated | ||||||||||||||||
| (millions of Canadian dollars) | |||||||||||||||||||||||
| Revenues | ( | ||||||||||||||||||||||
Commodity and gas distribution costs | ( | ( | ( | ( | ( | ||||||||||||||||||
| Operating and administrative | ( | ( | ( | ( | ( | ( | ( | ||||||||||||||||
| Impairment of long-lived assets | ( | ( | ( | ( | |||||||||||||||||||
Income/(loss) from equity investments | ( | ||||||||||||||||||||||
| Other income/(expense) | ( | ||||||||||||||||||||||
| Earnings before interest, income tax expense, and depreciation and amortization | |||||||||||||||||||||||
| Depreciation and amortization | ( | ||||||||||||||||||||||
| Interest expense | ( | ||||||||||||||||||||||
| Income tax expense | ( | ||||||||||||||||||||||
| Earnings | |||||||||||||||||||||||
Capital expenditures1 | |||||||||||||||||||||||
| Total property, plant and equipment, net | |||||||||||||||||||||||
| Year ended December 31, 2018 | Liquids Pipelines | Gas Transmission and Midstream | Gas Distribution and Storage | Renewable Power Generation | Energy Services | Eliminations and Other | Consolidated | ||||||||||||||||
| (millions of Canadian dollars) | |||||||||||||||||||||||
| Revenues | ( | ||||||||||||||||||||||
Commodity and gas distribution costs | ( | ( | ( | ( | ( | ( | |||||||||||||||||
| Operating and administrative | ( | ( | ( | ( | ( | ( | ( | ||||||||||||||||
| Impairment of long-lived assets | ( | ( | ( | ( | ( | ||||||||||||||||||
Impairment of goodwill | ( | ( | |||||||||||||||||||||
Income/(loss) from equity investments | ( | ||||||||||||||||||||||
| Other income/(expense) | ( | ( | ( | ( | ( | ||||||||||||||||||
Earnings/(loss) before interest, income tax expense, and depreciation and amortization | ( | ||||||||||||||||||||||
| Depreciation and amortization | ( | ||||||||||||||||||||||
| Interest expense | ( | ||||||||||||||||||||||
| Income tax expense | ( | ||||||||||||||||||||||
| Earnings | |||||||||||||||||||||||
Capital expenditures1 | |||||||||||||||||||||||
| Total property, plant and equipment, net | |||||||||||||||||||||||
1Includes allowance for equity funds used during construction.
The measurement basis for preparation of segmented information is consistent with the significant accounting policies (Note 2).
Our largest non-affiliated customer accounted for approximately 13.6 % of our third-party revenues for the year ended December 31, 2020. No non-affiliated customer exceeded 10% of our third-party revenues for the years ended December 31, 2019 and 2018.
130
GEOGRAPHIC INFORMATION
Revenues1
| Year ended December 31, | 2020 | 2019 | 2018 | ||||||||
| (millions of Canadian dollars) | |||||||||||
| Canada | |||||||||||
| US | |||||||||||
1 Revenues are based on the country of origin of the product or service sold.
Property, Plant and Equipment1
| December 31, | 2020 | 2019 | ||||||
| (millions of Canadian dollars) | ||||||||
| Canada | ||||||||
| US | ||||||||
1 Amounts are based on the location where the assets are held.
6. EARNINGS PER COMMON SHARE
BASIC
Earnings per common share is calculated by dividing earnings attributable to common shareholders by the weighted average number of common shares outstanding. The weighted average number of common shares outstanding has been reduced by our pro-rata weighted average interest in our own common shares of approximately 5 million as at December 31, 2020, 6 million as at December 31, 2019, and 12 million as at December 31, 2018, resulting from our reciprocal investment in Noverco.
DILUTED
The treasury stock method is used to determine the dilutive impact of stock options. This method assumes any proceeds from the exercise of stock options would be used to purchase common shares at the average market price during the period.
Weighted average shares outstanding used to calculate basic and diluted earnings per share are as follows:
| December 31, | 2020 | 2019 | 2018 | ||||||||
| (number of shares in millions) | |||||||||||
| Weighted average shares outstanding | |||||||||||
| Effect of dilutive options | |||||||||||
| Diluted weighted average shares outstanding | |||||||||||
For the years ended December 31, 2020, 2019 and 2018, 29.8 million, 17.8 million and 26.8 million, respectively, of anti-dilutive stock options with a weighted average exercise price of $51.42 , $53.56 and $50.38 , respectively, were excluded from the diluted earnings per common share calculation.
131
7. REGULATORY MATTERS
We record assets and liabilities that result from regulated ratemaking processes that would not be recorded under US GAAP for non-regulated entities. See Note 2 - Significant Accounting Policies for further discussion. Our significant regulated businesses and the related accounting impacts are described below.
Under the current authorized rate structure for certain operations, income tax costs are recovered in rates based on the current income tax payable and do not include accruals for deferred income tax. However, as income taxes become payable as a result of the reversal of temporary differences that created the deferred income taxes, it is expected that rates will be adjusted to recover these taxes. Since most of these temporary differences are related to property, plant and equipment costs, this recovery is expected to occur over the life of the related assets.
LIQUIDS PIPELINES
Canadian Mainline
Canadian Mainline includes the Canadian portion of Enbridge's mainline system and is subject to regulation by the CER. Tolls, excluding Lines 8 and 9, are currently governed by the 10-year CTS that is in place until June 30, 2021, which establishes a Canadian Local Toll (CLT) for all volumes shipped on the Canadian Mainline and an International Joint Tariff for all volumes shipped from western Canadian receipt points to delivery points on Enbridge’s Lakehead System, as well as delivery points on the Canadian Mainline downstream of the Lakehead System. The CTS was negotiated with shippers in accordance with CER guidelines, was approved by the CER in June 2011, and took effect July 1, 2011. Under the CTS, we have a regulatory asset of $1.9 billion as at December 31, 2020 (2019 - $1.8 billion) to offset deferred income taxes, as a CER rate order governing flow-through income tax treatment permits future recovery. No other material regulatory assets or liabilities are recognized under the terms of the CTS.
Southern Lights Pipeline
The US and Canadian portions of the Southern Lights Pipeline are regulated by the FERC and CER, respectively. Shippers on the Southern Lights Pipeline are subject to long-term transportation contracts under a cost-of-service toll methodology. Toll adjustments are filed annually with the regulators and provide for the recovery of allowable operating and debt financing costs, plus a pre-determined after-tax return on equity (ROE) of 10%.
GAS TRANSMISSION AND MIDSTREAM
British Columbia Pipeline and Maritimes & Northeast Canada
British Columbia Pipeline and Maritimes & Northeast Canada
British Columbia (BC) Pipeline and Maritimes & Northeast (M&N) Canada are regulated by the CER. Rates are approved by the CER through negotiated toll settlement agreements based on cost-of-service. Both BC Pipeline and M&N Canada are currently operating under the terms of their 2020-2021 and 2019-2021 toll settlements, respectively, which stipulate an allowable ROE and the continuation and establishment of certain deferral and variance accounts.
US Gas Transmission
Most of our US gas transmission and storage services are regulated by the FERC and may also be subject to the jurisdiction of various other federal, state and local agencies. The FERC regulates natural gas transmission in US interstate commerce including the establishment of rates for services, while rates for intrastate commerce and/or gathering services are regulated by the state gas commissions. Cost-of-service is the basis for the calculation of regulated tariff rates, although the FERC also allows the use of negotiated and discounted rates within contracts with shippers that may result in a rate that is above or below the FERC-regulated recourse rate for that service.
132
GAS DISTRIBUTION AND STORAGE
Enbridge Gas
Enbridge Gas' distribution rates, commencing in 2019, are set under a five-year Incentive Regulation (IR) framework using a price cap mechanism. The price cap mechanism establishes new rates each year through an annual base rate escalation at inflation less a 0.3 % stretch factor, annual updates for certain costs to be passed through to customers, and where applicable, the recovery of material discrete incremental capital investments beyond those that can be funded through base rates. The IR framework includes the continuation and establishment of certain deferral and variance accounts, as well as an earnings sharing mechanism that requires Enbridge Gas to share equally with customers any earnings in excess of 150 basis points over the annual OEB approved ROE.
FINANCIAL STATEMENT EFFECTS
Accounting for rate-regulated activities has resulted in the recognition of the following regulatory assets and liabilities in the Consolidated Statements of Financial Position:
| December 31, | 2020 | 2019 | Recovery/Refund Period Ends | ||||||||
| (millions of Canadian dollars) | |||||||||||
| Current regulatory assets | |||||||||||
Federal carbon receivables1 | 2020 | ||||||||||
| Under-recovery of fuel costs | 2021 | ||||||||||
| Other current regulatory assets | 2021 | ||||||||||
Total current regulatory assets2 | |||||||||||
| Long-term regulatory assets | |||||||||||
Deferred income taxes3 | Various | ||||||||||
Long-term debt4 | 2022-2046 | ||||||||||
Pension plan receivable5 | Various | ||||||||||
Negative salvage6 | Various | ||||||||||
Accounting policy changes7 | Various | ||||||||||
| Other long-term regulatory assets | Various | ||||||||||
Total long-term regulatory assets2 | |||||||||||
| Total regulatory assets | |||||||||||
| Current regulatory liabilities | |||||||||||
| Purchase gas variance | 2021 | ||||||||||
| Other current regulatory liabilities | 2021 | ||||||||||
Total current regulatory liabilities8 | |||||||||||
| Long-term regulatory liabilities | |||||||||||
Future removal and site restoration reserves9 | Various | ||||||||||
Regulatory liability related to US income taxes10 | Various | ||||||||||
Pipeline future abandonment costs (Note 14) | Various | ||||||||||
| Other long-term regulatory liabilities | Various | ||||||||||
Total long-term regulatory liabilities8 | |||||||||||
| Total regulatory liabilities | |||||||||||
1The federal carbon balance is the difference between actual carbon costs and carbon costs recovered in rates, as well as the administration costs associated with the impacts of the federal carbon program requirements. This balance has been recovered from customers in the fourth quarter of 2020 in accordance with the OEB's approval.
2 Current regulatory assets are included in Accounts receivable and other, while long-term regulatory assets are included in Deferred amounts and other assets.
3 The deferred income taxes balance represents the regulatory offset to deferred income tax liabilities to the extent that it is expected to be included in future regulator-approved rates and recovered from customers. The recovery period depends on the timing of the reversal of the temporary differences. In the absence of rate-regulated accounting, this regulatory balance and the related earnings impact would not be recorded.
4 The debt balance represents our regulatory offset to the fair value adjustment to debt acquired in our merger with Spectra Energy Corp. (Spectra Energy). The offset is viewed as a proxy for the regulatory asset that would be recorded in the event such debt was extinguished at an amount higher than the carrying value.
133
5 The pension plan balance represents the regulatory offset to our pension liability to the extent that it is expected to be included in regulator-approved future rates and recovered from customers. The settlement period for this balance is not determinable. In the absence of rate-regulated accounting, this regulatory balance and the related pension expense would be recorded in earnings and OCI.
6 The negative salvage balance represents the recovery in future rates of the actual cost of removal of previously retired or decommissioned plant assets, as approved by the FERC.
7 The accounting policy changes deferral reflects unamortized accumulated actuarial gains/losses and past service costs incurred by Union Gas Limited, relating to the period up to our merger with Spectra Energy, which were previously recorded in AOCI. The amortization of this balance is recognized as a component of accrual-based pension expenses, which are included in Other income/(expense) and recovered in rates, as previously approved by the OEB.
8 Current regulatory liabilities are included in Accounts payable and other, while long-term regulatory liabilities are included in Other long-term liabilities.
9 Future removal and site restoration reserves consists of amounts collected from customers, with the approval of the OEB, to fund future costs of removal and site restoration relating to property, plant and equipment. These costs are collected as part of the depreciation expense charged on property, plant and equipment that is reflected in rates. The settlement of this balance will occur over the long-term as costs are incurred. In the absence of rate-regulated accounting, depreciation rates would not include a charge for removal and site restoration and costs would be charged to earnings as incurred with recognition of revenue for amounts previously collected.
10 The regulatory liability related to US income taxes resulted from the US tax reform legislation dated December 22, 2017. These balances will be refunded to customers in accordance with the respective rate settlements approved by the FERC.
8. DISPOSITIONS
DISPOSITIONS
Line 10 Crude Oil Pipeline
In the first quarter of 2018, we satisfied the condition as set out in our agreements for the sale of our Line 10 crude oil pipeline (Line 10), which originates near Hamilton, Ontario and terminates at West Seneca, New York. Our subsidiaries, Enbridge Pipelines Inc. and Enbridge Energy Partners, L.P. (EEP), owned the Canadian and US portions of Line 10, respectively, and the related assets were included in our Liquids Pipelines segment.
Upon the reclassification and subsequent remeasurement of Line 10 assets as held for sale, a loss of $154 million was included within Impairment of long-lived assets in the Consolidated Statements of Earnings for the year ended December 31, 2018.
The transaction closed on June 1, 2020. No gain or loss on disposition was recorded.
Montana-Alberta Tie Line
In the fourth quarter of 2019, we committed to a plan to sell the Montana-Alberta Tie Line (MATL) transmission asset, a 345 kilometer transmission line from Great Falls, Montana to Lethbridge, Alberta. MATL was included in our Renewable Power Generation segment. The purchase and sale agreement was signed in January 2020.
Upon the reclassification and subsequent remeasurement of MATL assets as held for sale, a loss of $297 million was included within Impairment of long-lived assets in the Consolidated Statements of Earnings for the year ended December 31, 2019.
On May 1, 2020 we closed the sale of MATL for cash proceeds of approximately $189 million. After closing adjustments, a gain on disposal of $4 million was included in Other income/(expense) in the Consolidated Statements of Earnings.
134
Ozark Gas Transmission
In the first quarter of 2020, we agreed to sell our Ozark Gas Transmission and Ozark Gas Gathering assets (Ozark assets). The Ozark assets are composed of a transmission system that extends from southeastern Oklahoma through Arkansas to southeastern Missouri, and a fee-based gathering system that accesses Fayetteville Shale and Arkoma production. These assets were included in our Gas Transmission and Midstream segment.
On April 1, 2020 we closed the sale of the Ozark assets for cash proceeds of approximately $63 million. After closing adjustments, a gain on disposal of $1 million was included in Other income/(expense) in the Consolidated Statements of Earnings.
Canadian Natural Gas Gathering and Processing Businesses
On July 4, 2018, we entered into agreements to sell our Canadian natural gas gathering and processing businesses to Brookfield Infrastructure Partners L.P. and its institutional partners for a cash purchase price of approximately $4.3 billion, subject to customary closing adjustments. Separate agreements were entered into for those facilities currently governed by provincial regulations and those governed by federal regulations (collectively, Canadian Natural Gas Gathering and Processing Businesses assets); these assets were part of our Gas Transmission and Midstream segment.
As the Canadian Natural Gas Gathering and Processing Businesses assets represented a portion of a reporting unit, we allocated a portion of the goodwill of the reporting unit of these assets using a relative fair value approach. As a result of the goodwill allocation, the carrying value of Canadian Natural Gas Gathering and Processing Businesses assets was greater than the sale price consideration less the cost to sell and we recorded a goodwill impairment of $1.0 billion on the Consolidated Statements of Earnings for the year ended December 31, 2018. The held for sale classification represented a triggering event and required us to perform a goodwill impairment test for the related reporting unit. The results of the test did not indicate any additional goodwill impairment. Goodwill of $366 million and $55 million was allocated to the provincially and federally regulated facilities, respectively and was held for sale until closing.
On October 1, 2018, we closed the sale of the provincially regulated facilities for proceeds of approximately $2.5 billion. After closing adjustments, a gain on disposal of $34 million before tax was included in Other income/(expense) in the Consolidated Statements of Earnings for the year ended December 31, 2018.
On December 31, 2019, we closed the sale of the federally regulated facilities for proceeds of approximately $1.7 billion. After closing adjustments, a loss on disposal of $268 million before tax was included in Other income/(expense) in the Consolidated Statements of Earnings for the year ended December 31, 2019. As these assets represented a portion of a reporting unit, we allocated a portion of the goodwill of the reporting unit to these assets using a relative fair value approach.
St. Lawrence Gas Company, Inc.
In August 2017, we entered into an agreement to sell the issued and outstanding shares of St. Lawrence Gas Company, Inc. (St. Lawrence Gas). St. Lawrence Gas assets were included in the Gas Distribution and Storage segment. On November 1, 2019 we closed the sale of St. Lawrence Gas for cash proceeds of approximately $72 million. After closing adjustments, a loss on disposal of $10 million was included in Other income/(expense) in the Consolidated Statements of Earnings for the year ended December 31, 2019.
135
Enbridge Gas New Brunswick
In December 2018, we entered into an agreement for the sale of Enbridge Gas New Brunswick Limited Partnership and Enbridge Gas New Brunswick Inc. (collectively, EGNB). EGNB assets were a part of our Gas Distribution and Storage segment. On October 1, 2019 we closed the sale of EGNB to Liberty Utilities (Canada) LP, a wholly-owned subsidiary of Algonquin Power and Utilities Corp. for cash proceeds of approximately $331 million. After closing adjustments, a loss on disposal of $3 million was included in Other income/(expense) in the Consolidated Statements of Earnings for the year ended December 31, 2019.
As EGNB assets represented a portion of a reporting unit, we allocated a portion of the goodwill of the reporting unit to these assets using a relative fair value approach. As such, allocated goodwill of $133 million was included in assets subsequently disposed.
Renewable Assets
On August 1, 2018, we closed the sale of a 49 % interest in all of our Canadian renewable assets, a 49 % interest in two US renewable assets and 49 % of our interest in the Hohe See Offshore wind power project and its subsequent expansion (collectively, the Renewable Assets) to Canada Pension Plan Investment Board (CPP Investments). Total cash proceeds from the transaction were $1.75 billion. In addition, CPP Investments have been funding their pro-rata share of the remaining capital expenditures on the Hohe See Offshore wind power project. We maintain a 51 % interest in the Renewable Assets and will continue to manage, operate and provide administrative services for these assets.
A loss on disposal of $20 million was included in Other income/(expense) in the Consolidated Statements of Earnings for the year ended December 31, 2018 for the sale of 49 % of our interest in the Hohe See Offshore wind power project and its subsequent expansion. Subsequent to the sale, the remaining interests in these assets continue to be accounted for as an equity method investment, and are a part of our Renewable Power Generation segment.
Gains of $62 million and $17 million were included in Additional paid-in capital in the Consolidated Statements of Financial Position for the year ended December 31, 2018 for the sale of 49 % interest in the Canadian and US renewable assets, respectively.
Also, a deferred income tax recovery of $267 million ($196 million attributable to us) was recorded in the year ended December 31, 2018 as a result of the sale.
Midcoast Operating, L.P.
On August 1, 2018, we closed the sale of Midcoast Operating, L.P. and its subsidiaries (MOLP) to AL Midcoast Holdings, LLC (an affiliate of ArcLight Capital Partners, LLC) for total cash proceeds of $1.4 billion. After closing adjustments recorded in the fourth quarter of 2018, a loss on disposal of $41 million was included in Other income/(expense) in the Consolidated Statements of Earnings. MOLP conducted our US natural gas and natural gas liquids gathering, processing, transportation and marketing businesses, and was a part of our Gas Transmission and Midstream segment.
As a result of entering into a definitive sales agreement, the fair value of the assets held for sale as at March 31, 2018 were revised based on the sale price. Accordingly, we recorded a loss of $913 million included within Impairment of long-lived assets on the Consolidated Statements of Earnings for the year ended December 31, 2018.
In the second quarter of 2018, our equity method investment in the Texas Express NGL pipeline system, also met the conditions for assets held for sale. The $447 million carrying value of Texas Express NGL pipeline system equity investment and an allocated goodwill of $262 million, were included within the disposal group as at June 30, 2018 and subsequently disposed on August 1, 2018.
136
Upon closing of the sale, we also recorded a liability of $387 million for future volume commitments retained by us. The associated loss is included in the loss on disposal of $41 million discussed above. As at December 31, 2020 and December 31, 2019 respectively, $225 million and $299 million were included in liabilities on the Consolidated Statements of Financial Position.
Sandpiper Project
During the year ended December 31, 2018 we sold unused pipe related to the Sandpiper Project for cash proceeds of approximately $38 million. A gain on disposal of $29 million before tax was included in Operating and administrative expense in the Consolidated Statements of Earnings for the year ended December 31, 2018. These assets were a part of our Liquids Pipelines segment.
9. ACCOUNTS RECEIVABLE AND OTHER
| December 31, | 2020 | 2019 | ||||||
| (millions of Canadian dollars) | ||||||||
Trade receivables and unbilled revenues1 | ||||||||
| Short-term portion of derivative assets | ||||||||
| Taxes receivable | ||||||||
| Other | ||||||||
1 Net of allowance for expected credit losses of $70 million as at December 31, 2020 and allowance for doubtful accounts of $50 million as at December 31, 2019.
10. INVENTORY
| December 31, | 2020 | 2019 | ||||||
| (millions of Canadian dollars) | ||||||||
| Natural gas | ||||||||
| Crude oil | ||||||||
| Other commodities | ||||||||
11. PROPERTY, PLANT AND EQUIPMENT
| Weighted Average | |||||||||||
| December 31, | Depreciation Rate | 2020 | 2019 | ||||||||
| (millions of Canadian dollars) | |||||||||||
| Pipelines | % | ||||||||||
| Facilities and equipment | % | ||||||||||
Land and right-of-way1 | % | ||||||||||
| Gas mains, services and other | % | ||||||||||
| Storage | % | ||||||||||
| Wind turbines, solar panels and other | % | ||||||||||
| Other | % | ||||||||||
| Under construction | % | ||||||||||
| Total property, plant and equipment | |||||||||||
| Total accumulated depreciation | ( | ( | |||||||||
| Property, plant and equipment, net | |||||||||||
1 The measurement of weighted average depreciation rate excludes non-depreciable assets.
Depreciation expense for the years ended December 31, 2020, 2019 and 2018 was $3.4 billion, $3.0 billion and $2.9 billion, respectively.
137
IMPAIRMENT
Access Northeast Project
In 2019, we announced that we terminated the agreements with Eversource Energy and National Grid USA Service Company, Inc. related to the Access Northeast project. As a result, we recognized an impairment loss of $105 million for the year ended December 31, 2019, which is included in Impairment of long-lived assets in the Consolidated Statements of Earnings. Access Northeast is part of our Gas Transmission and Midstream segment.
Impairment charges were based on the amount by which the carrying values of the assets exceeded fair value, determined using expected discounted future cash flows.
12. VARIABLE INTEREST ENTITIES
CONSOLIDATED VARIABLE INTEREST ENTITIES
Enbridge Canadian Renewable LP (ECRLP)
ECRLP, an entity which we have a 51 % ownership in, is a VIE as its limited partners lack substantive kick-out rights or participating rights. Because we have the power to direct the activities of ECRLP, we are exposed to potential losses, and we have the right to receive benefits from ECRLP, we are considered the primary beneficiary.
Renewable Power Generation
Through various subsidiaries, we have a majority ownership interest in Magic Valley, Wildcat, Keechi Wind Project (Keechi), New Creek and Chapman Ranch wind facilities. These wind facilities are considered VIEs due to the members’ lack of substantive kick-out rights and participating rights. We are the primary beneficiary of these VIEs by virtue of our power to direct the activities that most significantly impact the economic performance of the wind facilities, and our obligation to absorb losses and the right to receive benefits that are significant.
Enbridge Holdings (DakTex) L.L.C.
Enbridge Holdings (DakTex) L.L.C. (DakTex) is owned 75 % by a wholly-owned subsidiary of Enbridge and 25 % by EEP, through which we have an effective 27.6 % interest in the equity investment, Bakken Pipeline System (Note 13). EEP is the primary beneficiary because it has the power to direct DakTex’s activities that most significantly impact its economic performance. We consolidate EEP and by extension, also consolidate DakTex.
Other Limited Partnerships
By virtue of limited partners' lack of substantive kick-out rights and participating rights, substantially all limited partnerships wholly-owned by us and/or our subsidiaries are considered VIEs, including EEP and Spectra Energy Partners, LP (SEP). As these wholly-owned limited partnership entities are directed by us with no third parties having the ability to direct any of the significant activities, we are considered the primary beneficiary.
138
The following table includes assets to be used to settle liabilities of our consolidated VIEs and liabilities of our consolidated VIEs for which creditors do not have recourse to our general credit as the primary beneficiary. These assets and liabilities are included in the Consolidated Statements of Financial Position.
| December 31, | 2020 | 2019 | ||||||
| (millions of Canadian dollars) | ||||||||
| Assets | ||||||||
| Cash and cash equivalents | ||||||||
| Restricted cash | ||||||||
| Accounts receivable and other | ||||||||
| Inventory | ||||||||
| Property, plant and equipment, net | ||||||||
| Long-term investments | ||||||||
| Restricted long-term investments | ||||||||
| Deferred amounts and other assets | ||||||||
| Intangible assets, net | ||||||||
| Liabilities | ||||||||
| Accounts payable and other | ||||||||
| Other long-term liabilities | ||||||||
| Deferred income taxes | ||||||||
| Net assets before noncontrolling interests | ||||||||
We do not have an obligation to provide financial support to any of our consolidated VIEs.
UNCONSOLIDATED VARIABLE INTEREST ENTITIES
We currently hold several equity investments in limited partnerships that are assessed to be VIEs due to limited partners not having substantive kick-out rights or participating rights. We have determined that we do not have the power to direct the activities of the VIEs that most significantly impact the VIEs’ economic performance. Specifically, the power to direct the activities of a majority of these VIEs is shared amongst the partners. Each partner has representatives that make up an executive committee that makes significant decisions for the VIE and none of the partners may make major decisions unilaterally.
The carrying amount of our interest in VIEs that are unconsolidated and our estimated maximum exposure to loss as at December 31, 2020 and 2019 are presented below:
Carrying Amount of Investment | Enbridge’s Maximum Exposure to | |||||||
| December 31, 2020 | in VIE | Loss | ||||||
| (millions of Canadian dollars) | ||||||||
Aux Sable Liquid Products L.P.1 | ||||||||
Éolien Maritime France SAS2 | ||||||||
Enbridge Renewable Infrastructure Investments S.a.r.l.3 | ||||||||
Enbridge Éolien France 2 S.a.r.l4 | ||||||||
PennEast Pipeline Company, LLC5 | ||||||||
Rampion Offshore Wind Limited6 | ||||||||
Vector Pipeline L.P.7 | ||||||||
Other8 | ||||||||
139
Carrying Amount of Investment | Enbridge’s Maximum Exposure to | |||||||
| December 31, 2019 | in VIE | Loss | ||||||
| (millions of Canadian dollars) | ||||||||
Aux Sable Liquid Products L.P.1 | ||||||||
Éolien Maritime France SAS2 | ||||||||
Enbridge Renewable Infrastructure Investments S.a.r.l.3 | ||||||||
Gray Oak Holdings LLC9 | ||||||||
PennEast Pipeline Company, LLC5 | ||||||||
Rampion Offshore Wind Limited6 | ||||||||
Vector Pipeline L.P.7 | ||||||||
Other8 | ||||||||
1At December 31, 2020 and 2019, the maximum exposure to loss includes a guarantee issued by us for our respective share of the VIE’s borrowing on a bank credit facility.
2At December 31, 2020 and 2019, the maximum exposure to loss includes the portion of our parental guarantee that has been committed in project construction contracts for which we would be liable in the event of default by the VIE and an outstanding affiliate loan receivable for $132 million and $166 million held by us as at December 31, 2020 and 2019, respectively.
3At December 31, 2020 and 2019, the maximum exposure to loss includes the portion of our parental guarantee that has been committed in project construction contracts for which we would be liable in the event of default by the VIE and an outstanding affiliate loan receivable for $904 million and $766 million held by us as at December 31, 2020 and 2019, respectively.
4At December 31, 2020, the maximum exposure to loss includes our portion of project construction costs.
5At December 31, 2020 and 2019, the maximum exposure to loss includes the remaining expected contributions to the joint venture.
6At December 31, 2020 and 2019, the maximum exposure to loss includes the portion of our parental guarantee that has been committed in project construction contracts for which we would be liable in the event of default by the VIE.
7At December 31, 2020 and 2019, the maximum exposure to loss includes the carrying value of an outstanding affiliate loan receivable for $84 million and $92 million held by us as at December 31, 2020 and 2019, respectively, in addition an outstanding credit facility for $105 million as at December 31, 2020.
8At December 31, 2020 and 2019, the maximum exposure to loss is limited to our equity investment as these companies are in operation and self-sustaining.
9At December 31, 2019, the maximum exposure to loss includes our portion of project construction costs.
We do not have an obligation to and did not provide any additional financial support to the VIEs during the years ended December 31, 2020 and 2019.
Enbridge Éolien France 2 S.a.r.l (EEF2)
In September 2020, Enbridge closed a share purchase agreement with EDF Renouvelables to acquire a 50 % interest in Parc Eoilen Offshore de Provence Grand Large, which is developing and constructing an offshore wind facility. Subsequently, on September 18, 2020, Enbridge sold half of its interest to CPP Investments.
EEF2 is a VIE as it does not have sufficient equity at risk to finance its activities and requires subordinated financial support from Enbridge and other partners. We have determined that we do not have the power to direct the activities of EEF2 that most significantly impact its economic performance. Specifically, the power to direct the activities of the VIE is shared amongst the partners. Each partner has representatives that make up an executive committee that makes the significant decisions for the VIE and none of the partners may make significant decisions unilaterally. Therefore, the VIE is accounted for as an unconsolidated VIE.
Gray Oak Holdings LLC
In December 2018, Enbridge acquired an effective 22.8 % interest in the Gray Oak crude oil pipeline through acquisition of a 35 % membership interest in Gray Oak Holdings LLC (Gray Oak Holdings), which operates the Gray Oak crude oil pipeline from Texas to the Gulf coast of the US.
140
13. LONG-TERM INVESTMENTS
| Ownership | |||||||||||
| December 31, | Interest | 2020 | 2019 | ||||||||
| (millions of Canadian dollars) | |||||||||||
| EQUITY INVESTMENTS | |||||||||||
| Liquids Pipelines | |||||||||||
MarEn Bakken Company LLC1 | % | ||||||||||
| Gray Oak Holdings LLC | % | ||||||||||
| Seaway Crude Holdings LLC | % | ||||||||||
Illinois Extension Pipeline Company, L.L.C.2 | % | ||||||||||
| Other | 30.0% - 43.8% | ||||||||||
| Gas Transmission and Midstream | |||||||||||
Alliance Pipeline3 | % | ||||||||||
Aux Sable4 | 42.7% - 50.0% | ||||||||||
DCP Midstream, LLC5 | % | ||||||||||
| Gulfstream Natural Gas System, L.L.C. | % | ||||||||||
| Nexus Gas Transmission, LLC | % | ||||||||||
| PennEast Pipeline Company, LLC | % | ||||||||||
| Sabal Trail Transmission, LLC | % | ||||||||||
| Southeast Supply Header, LLC | % | ||||||||||
| Steckman Ridge, LP | % | ||||||||||
Vector Pipeline6 | % | ||||||||||
| Offshore - various joint ventures | 22.0% - 74.3% | ||||||||||
| Other | 33.3% - 50.0% | ||||||||||
| Gas Distribution and Storage | |||||||||||
| Noverco Common Shares | % | ||||||||||
| Other | % | ||||||||||
| Renewable Power Generation | |||||||||||
Éolien Maritime France SAS | % | ||||||||||
| Enbridge Renewable Infrastructure Investments S.a.r.l. | % | ||||||||||
| Rampion Offshore Wind Limited | % | ||||||||||
| Other | 21.0% - 50.0% | ||||||||||
| Eliminations and Other | |||||||||||
| Other | 30% - 50% | ||||||||||
| OTHER LONG-TERM INVESTMENTS | |||||||||||
| Gas Distribution and Storage | |||||||||||
| Noverco Preferred Shares | |||||||||||
| Green Power and Transmission | |||||||||||
| Emerging Technologies and Other | |||||||||||
| Eliminations and Other | |||||||||||
| Other | |||||||||||
1Owns 49 % interest in Bakken Pipeline Investments L.L.C., which owns 75 % of the Bakken Pipeline System resulting in a 27.6 % effective interest in the Bakken Pipeline System.
2Owns the Southern Access Extension Project.
3Includes Alliance Pipeline Limited Partnership in Canada and Alliance Pipeline L.P. in the US.
141
4Includes Aux Sable Canada LP in Canada and Aux Sable Liquid Products LP and Aux Sable Midstream LLC in the US.
5Our ownership in DCP Midstream, LLC (DCP Midstream) holds an interest of 56.5 % in DCP Midstream, LP.
6Includes Vector Pipeline Limited Partnership in Canada and Vector Pipeline L.P. in the US.
Equity investments include the unamortized excess of the purchase price over the underlying net book value of the investees’ assets at the purchase date. As at December 31, 2020, this was comprised of $1.8 billion in Goodwill and $657 million in amortizable assets. As at December 31, 2019, this was comprised of $2.1 billion in Goodwill and $681 million in amortizable assets.
For the years ended December 31, 2020, 2019 and 2018, distributions received from equity investments were $2.1 billion, $2.2 billion and $2.8 billion, respectively.
Summarized combined financial information of our interest in unconsolidated equity investments (presented at 100%) is as follows:
| Year Ended December 31, | |||||||||||
| 2020 | 2019 | 2018 | |||||||||
| (millions of Canadian dollars) | |||||||||||
| Operating revenues | |||||||||||
| Operating expenses | |||||||||||
| Earnings | |||||||||||
Earnings attributable to Enbridge | |||||||||||
| December 31, 2020 | December 31, 2019 | |||||||
| (millions of Canadian dollars) | ||||||||
| Current assets | ||||||||
| Non-current assets | ||||||||
| Current liabilities | ||||||||
| Non-current liabilities | ||||||||
| Noncontrolling interests | ||||||||
Noverco Inc.
As at December 31, 2020 and 2019, we owned an equity interest in Noverco through our ownership of 38.9 10 years plus a margin of 4.38 %.
As at December 31, 2020 and 2019, Noverco owned an approximate 0.2 % and 0.5 % reciprocal shareholding in our common shares, respectively. Noverco sold 1.0 million common shares in March 2020, 5.7 million common shares in August 2020 and 11.6 million common shares in January 2019. Shares sold were treated as treasury stock on the Consolidated Statements of Changes in Equity.
As a result of Noverco’s reciprocal shareholding in our common shares, as at December 31, 2020 and 2019, we had an indirect pro-rata interest of 0.1 % and 0.2 %, respectively, in our own shares. Both the equity investment in Noverco and shareholders’ equity have been reduced by the reciprocal shareholding of $29 million and $51 million as at December 31, 2020 and 2019. Noverco records dividends paid by us as dividend income and we eliminate these dividends from our equity earnings of Noverco. We record our pro-rata share of dividends paid by us to Noverco as a reduction of dividends paid and an increase in our investment in Noverco.
142
Impairment of Equity Investments
Steckman Ridge, LP
Steckman Ridge, LP (Steckman Ridge) is engaged in the storage of natural gas, is owned 50 % by Enbridge and is recorded as an equity method investment. During the third quarter, Steckman Ridge’s forecasted performance was adjusted for the expectation that future available capacity will be re-contracted at lower than expected rates and an other than temporary impairment loss on our investment of $221 million for the year ended December 31, 2020 was recorded based on a discounted cash flow analysis. The carrying value of this investment as at December 31, 2020 and 2019 was $90 million and $222 million, respectively.
Southeast Supply Header, L.L.C.
Southeast Supply Header, L.L.C. (SESH) provides natural gas transmission services from east Texas and northern Louisiana to the southeast markets of the Gulf Coast. SESH is owned 50 % by Enbridge and is recorded as an equity method investment. The forecasted performance of SESH was revised in the third quarter to reflect downward revisions to future negotiated rates as well as higher than expected available capacity levels, caused primarily by a significant contract expiry. An other than temporary impairment loss on our investment of $394 million for the year ended December 31, 2020 was recorded based on a discounted cash flow analysis. The carrying value of this investment as at December 31, 2020 and 2019 was $84 million and $484 million, respectively.
DCP Midstream, LLC
DCP Midstream, a 50 % owned equity method investment of Enbridge, holds an equity interest in DCP Midstream, LP. A decline in the market price of DCP Midstream, LP’s publicly traded units during the first quarter of 2020 resulted in an other than temporary impairment loss on our investment in DCP Midstream of $1.7 billion for the year ended December 31, 2020. In addition, we incurred losses of $324 million through our equity earnings pick up in relation to asset and goodwill impairment losses recorded by DCP Midstream, LP. The carrying value of our investment in DCP Midstream as at December 31, 2020 and 2019 was $331 million and $2.2 billion, respectively.
14. RESTRICTED LONG-TERM INVESTMENTS
Effective January 1, 2015, we began collecting and setting aside funds to cover future pipeline abandonment costs for all CER regulated pipelines as a result of the CER’s regulatory requirements under LMCI. The funds collected are held in trusts in accordance with the CER decision. The funds collected from shippers are reported within Transportation and other services revenues on the Consolidated Statements of Earnings and Restricted long-term investments on the Consolidated Statements of Financial Position. Concurrently, we reflect the future abandonment cost as an increase to Operating and administrative expense on the Consolidated Statements of Earnings and Other long-term liabilities on the Consolidated Statements of Financial Position.
We routinely invest excess cash and various restricted balances in securities such as commercial paper, bankers acceptances, corporate debt securities, Canadian equity securities, treasury bills and money market securities in the US and Canada.
143
15. INTANGIBLE ASSETS
The following table provides the weighted average amortization rate, gross carrying value, accumulated amortization and net carrying value for each of our major classes of intangible assets:
| Weighted Average | Accumulated | ||||||||||||||||||||||
| December 31, 2020 | Amortization Rate | Cost | Amortization | Net | |||||||||||||||||||
| (millions of Canadian dollars) | |||||||||||||||||||||||
| Customer relationships | % | ( | |||||||||||||||||||||
| Power purchase agreements | % | ( | |||||||||||||||||||||
Project agreement1 | % | ( | |||||||||||||||||||||
| Software | % | ( | |||||||||||||||||||||
Other intangible assets2 | % | ( | |||||||||||||||||||||
| ( | |||||||||||||||||||||||
Weighted Average | Accumulated | ||||||||||||||||||||||
| December 31, 2019 | Amortization Rate | Cost | Amortization | Net | |||||||||||||||||||
(millions of Canadian dollars) | |||||||||||||||||||||||
Customer relationships | % | ( | |||||||||||||||||||||
Power purchase agreements | % | ( | |||||||||||||||||||||
Project agreement1 | % | ( | |||||||||||||||||||||
Software | % | ( | |||||||||||||||||||||
Other intangible assets2 | % | ( | |||||||||||||||||||||
| ( | |||||||||||||||||||||||
1 Represents a project agreement acquired from the merger of Enbridge and Spectra Energy.
2 The measurement of weighted average amortization rate excludes non-depreciable intangible assets.
For the years ended December 31, 2020, 2019 and 2018, our amortization expense related to intangible assets totaled $294 million, $296 million and $281 million, respectively. The following table presents our expected amortization expense associated with existing intangible assets for the years indicated as follows:
| 2021 | 2022 | 2023 | 2024 | 2025 | |||||||||||||
Forecast of amortization expense (millions of Canadian dollars) | |||||||||||||||||
144
16. GOODWILL
| Liquids Pipelines | Gas Transmission and Midstream | Gas Distribution and Storage | Energy Services | Consolidated | |||||||||||||
| (millions of Canadian dollars) | |||||||||||||||||
| Balance at January 1, 2019 | |||||||||||||||||
| Foreign exchange and other | ( | ( | ( | ||||||||||||||
Balance at December 31, 20191,2 | |||||||||||||||||
| Foreign exchange and other | ( | ( | ( | ||||||||||||||
| Acquisition | |||||||||||||||||
Balance at December 31, 20201,2 | |||||||||||||||||
1 Gross cost of goodwill as at December 31, 2020 and 2019 was $34.3 billion and $34.7 billion, respectively.
2 Accumulated impairment as at December 31, 2020 and 2019 was $1.6
17. ACCOUNTS PAYABLE AND OTHER
| December 31, | 2020 | 2019 | ||||||
| (millions of Canadian dollars) | ||||||||
| Trade payables and operating accrued liabilities | ||||||||
| Construction payables and contractor holdbacks | ||||||||
| Current derivative liabilities | ||||||||
| Dividends payable | ||||||||
| Taxes payable | ||||||||
| Current deferred credits | ||||||||
| Other | ||||||||
145
18. DEBT
| Weighted Average | |||||||||||||||||||||||
| December 31, | Interest Rate9 | Maturity | 2020 | 2019 | |||||||||||||||||||
| (millions of Canadian dollars) | |||||||||||||||||||||||
| Enbridge Inc. | |||||||||||||||||||||||
| US dollar senior notes | % | 2022-2049 | |||||||||||||||||||||
Medium-term notes | % | 2021-2064 | |||||||||||||||||||||
Fixed-to-fixed subordinated term notes1 | % | 2080 | |||||||||||||||||||||
Fixed-to-floating rate subordinated term notes2 | % | 2077-2078 | |||||||||||||||||||||
Floating rate notes3 | 2022 | ||||||||||||||||||||||
| Commercial paper and credit facility draws | % | 2021-2024 | |||||||||||||||||||||
Other4 | |||||||||||||||||||||||
| Enbridge (U.S.) Inc. | |||||||||||||||||||||||
| Commercial paper and credit facility draws | % | 2022-2024 | |||||||||||||||||||||
Other4 | |||||||||||||||||||||||
| Enbridge Energy Partners, L.P. | |||||||||||||||||||||||
| Senior notes | % | 2021-2045 | |||||||||||||||||||||
| Enbridge Gas Inc. | |||||||||||||||||||||||
Medium-term notes | % | 2021-2050 | |||||||||||||||||||||
Debentures | % | 2024-2025 | |||||||||||||||||||||
Commercial paper and credit facility draws | % | 2022 | |||||||||||||||||||||
| Enbridge Pipelines (Southern Lights) L.L.C. | |||||||||||||||||||||||
| Senior notes | % | 2040 | |||||||||||||||||||||
| Enbridge Pipelines Inc. | |||||||||||||||||||||||
Medium-term notes5 | % | 2022-2049 | |||||||||||||||||||||
Debentures | % | 2024 | |||||||||||||||||||||
| Commercial paper and credit facility draws | % | 2022 | |||||||||||||||||||||
| Enbridge Southern Lights LP | |||||||||||||||||||||||
Senior notes | % | 2040 | |||||||||||||||||||||
| Spectra Energy Capital, LLC | |||||||||||||||||||||||
Senior notes | % | 2032-2038 | |||||||||||||||||||||
| Spectra Energy Partners, LP | |||||||||||||||||||||||
| Senior secured notes | |||||||||||||||||||||||
| Senior notes | % | 2021-2048 | |||||||||||||||||||||
| Floating rate notes | |||||||||||||||||||||||
| Westcoast Energy Inc. | |||||||||||||||||||||||
Medium-term notes | % | 2021-2041 | |||||||||||||||||||||
Debentures | % | 2025-2026 | |||||||||||||||||||||
| Fair value adjustment | |||||||||||||||||||||||
Other6 | ( | ( | |||||||||||||||||||||
Total debt7 | |||||||||||||||||||||||
| Current maturities | ( | ( | |||||||||||||||||||||
Short-term borrowings8 | ( | ( | |||||||||||||||||||||
| Long-term debt | |||||||||||||||||||||||
1For the initial 10 years, the notes carry a fixed interest rate. Subsequently, the interest rate will be set to equal to the Five-Year US Treasury Rate plus a margin of 5.31 % from years 10 to 30 and a margin of 6.06 % from years 30 to 60.
2For the initial 10 years, the notes carry a fixed interest rate. Subsequently, the interest rate will be floating and set to equal to the Canadian Dollar Offered Rate (CDOR) or the London Interbank Offered Rate (LIBOR) plus a margin. The notes would be converted automatically into Conversion Preference Shares in the event of bankruptcy and related events.
3The notes carry an interest rate equal to the three-month LIBOR plus a margin of 50 basis points.
4Primarily capital lease obligations.
5Included in medium-term notes is $100 million with a maturity date of 2112.
6Primarily unamortized discounts, premiums and debt issuance costs.
72020 - $35.4 billion and US$24.4 billion; 2019 - $33.4 billion and US$23.9 billion. Totals exclude capital lease obligations, unamortized discounts, premiums and debt issuance costs and fair value adjustment.
8Weighted average interest rates on outstanding commercial paper were 0.3 % as at December 31, 2020 (2019 - 2.0 %).
9Calculated based on term notes, debentures, commercial paper and credit facility draws outstanding as at December 31, 2020.
As at December 31, 2020, all outstanding debt was unsecured.
146
CREDIT FACILITIES
The following table provides details of our committed credit facilities as at December 31, 2020:
| Total | ||||||||||||||
| Maturity | Facilities | Draws1 | Available | |||||||||||
| (millions of Canadian dollars) | ||||||||||||||
| Enbridge Inc. | 2021-2024 | |||||||||||||
| Enbridge (U.S.) Inc. | 2022-2024 | |||||||||||||
| Enbridge Pipelines Inc. | 20222 | |||||||||||||
| Enbridge Gas Inc. | 20222 | |||||||||||||
| Total committed credit facilities | ||||||||||||||
1Includes facility draws and commercial paper issuances that are back-stopped by the credit facility.
2Maturity date is inclusive of the one-year term out option.
On February 24, 2020, Enbridge Inc. entered into a two year, non-revolving credit facility for US$1.0 billion with a syndicate of lenders.
On February 25, 2020, Enbridge Inc. entered into two, one year, non-revolving, bilateral credit facilities for a total of US$500 million.
On March 31, 2020, Enbridge Inc. entered into a one year, revolving, syndicated credit facility for $1.7 billion. On April 9, 2020, Enbridge Inc. exercised an accordion provision and increased the facility to $3.0 billion.
On July 23 and 24, 2020, we extended approximately $10.0 billion of our 364 day extendible credit facilities to July 2022, inclusive of a one-year term out provision.
On February 10, 2021, we entered into a three year, sustainability linked credit facility for $1.0 billion with a syndicate of lenders. As a result of the sustainability linked credit facility and other financing activities completed in 2020, and our current liquidity position, we concurrently cancelled a one year, revolving, syndicated credit facility for $3.0 billion ahead of its scheduled March 2021 maturity.
In addition to the committed credit facilities noted above, we maintain $849 million of uncommitted demand letter of credit facilities, of which $533 million were unutilized as at December 31, 2020. As at December 31, 2019, we had $916 million of uncommitted demand letter of credit facilities, of which $476 million were unutilized.
Our credit facilities carry a weighted average standby fee of 0.3 % per annum on the unused portion and draws bear interest at market rates. Certain credit facilities serve as a back-stop to the commercial paper programs and we have the option to extend such facilities, which are currently scheduled to mature from 2021 to 2024.
As at December 31, 2020 and 2019, commercial paper and credit facility draws, net of short-term borrowings and non-revolving credit facilities that mature within one year, of $9.9 billion and $9.0 billion, respectively, are supported by the availability of long-term committed credit facilities and, therefore, have been classified as long-term debt.
147
LONG-TERM DEBT ISSUANCES
During the year ended December 31, 2020, we completed the following long-term debt issuances totaling $2.5 billion and US$2.1 billion:
| Company | Issue Date | Principal Amount | ||||||||||||
| (millions of Canadian dollars unless otherwise stated) | ||||||||||||||
Enbridge Inc. | ||||||||||||||
| February 2020 | Floating rate notes due February 20221 | US$ | ||||||||||||
| May 2020 | 3.20% medium-term notes due June 2027 | $ | ||||||||||||
| May 2020 | 2.44% medium-term notes due June 2025 | $ | ||||||||||||
| July 2020 | Fixed-to-fixed subordinated term notes due July 20802 | US$ | ||||||||||||
Enbridge Gas Inc. | ||||||||||||||
| April 2020 | 2.90% medium-term notes due April 2030 | $ | ||||||||||||
| April 2020 | 3.65% medium-term notes due April 2050 | $ | ||||||||||||
| Spectra Energy Partners, LP | ||||||||||||||
| October 2020 | 3.10% senior notes due October 20403 | US$ | ||||||||||||
1Notes mature in two years and carry an interest rate set to equal the three-month LIBOR plus a margin of 50 basis points.
2Notes mature in 60 years and are callable on or after year 10. For the initial 10 years, the notes carry a fixed interest rate of 5.75 %. Subsequently, the interest rate will be set to equal the Five-Year US Treasury Rate plus a margin of 5.31 % from years 10 to 30 and a margin of 6.06 % from years 30 to 60.
3Issued through Texas Eastern Transmission, L.P., a wholly-owned operating subsidiary of SEP.
LONG-TERM DEBT REPAYMENTS
During the year ended December 31, 2020, we completed the following long-term debt repayments totaling $1.7 billion and US$2.1 billion, respectively:
| Company | Repayment Date | Principal Amount | ||||||||||||
| (millions of Canadian dollars unless otherwise stated) | ||||||||||||||
| Enbridge Inc. | ||||||||||||||
| January 2020 | Floating rate notes | US$ | ||||||||||||
| March 2020 | 4.53% medium-term notes | $ | ||||||||||||
| June 2020 | Floating rate notes | US$ | ||||||||||||
| November 2020 | 4.85% medium-term notes | $ | ||||||||||||
| Enbridge Gas Inc. | ||||||||||||||
| November 2020 | 4.04% medium-term notes | $ | ||||||||||||
| Enbridge Pipelines (Southern Lights) L.L.C. | ||||||||||||||
| June and December 2020 | 3.98% senior notes | US$ | ||||||||||||
| Enbridge Pipelines Inc. | ||||||||||||||
| April 2020 | 4.45% medium-term notes | $ | ||||||||||||
| Enbridge Southern Lights LP | ||||||||||||||
| June and December 2020 | 4.01% senior notes | $ | ||||||||||||
| Spectra Energy Partners, LP | ||||||||||||||
| January 2020 | 6.09% senior secured notes | US$ | ||||||||||||
| June 2020 | Floating rate notes | US$ | ||||||||||||
| October 2020 | 4.13% senior notes due 2020 | US$ | ||||||||||||
| Westcoast Energy Inc. | ||||||||||||||
| January 2020 | 9.90% debentures | $ | ||||||||||||
| July 2020 | 4.57% medium-term notes | $ | ||||||||||||
DEBT COVENANTS
Our credit facility agreements and term debt indentures include standard events of default and covenant provisions whereby accelerated repayment and/or termination of the agreements may result if we were to default on payment or violate certain covenants. As at December 31, 2020, we were in compliance with all debt covenants.
148
INTEREST EXPENSE
| Year ended December 31, | 2020 | 2019 | 2018 | ||||||||
| (millions of Canadian dollars) | |||||||||||
| Debentures and term notes | |||||||||||
| Commercial paper and credit facility draws | |||||||||||
| Amortization of fair value adjustment | ( | ( | ( | ||||||||
| Capitalized interest | ( | ( | ( | ||||||||
19. ASSET RETIREMENT OBLIGATIONS
Our ARO relate mostly to the retirement of pipelines, renewable power generation assets, obligations related to right-of way agreements and contractual leases for land use.
The liability for the expected cash flows as recognized in the financial statements reflected discount rates ranging from 1.8 % to 9.0 %.
A reconciliation of movements in our ARO liabilities is as follows:
| December 31, | 2020 | 2019 | ||||||
| (millions of Canadian dollars) | ||||||||
| Obligations at beginning of year | ||||||||
| Liabilities disposed | ( | |||||||
| Liabilities incurred | ||||||||
| Liabilities settled | ( | ( | ||||||
| Change in estimate and other | ( | |||||||
| Foreign currency translation adjustment | ( | ( | ||||||
| Accretion expense | ||||||||
| Obligations at end of year | ||||||||
| Presented as follows: | ||||||||
Accounts payable and other | ||||||||
Other long-term liabilities | ||||||||
20. NONCONTROLLING INTERESTS
NONCONTROLLING INTERESTS
The following table provides additional information regarding Noncontrolling interests as presented in our Consolidated Statements of Financial Position:
| December 31, | 2020 | 2019 | ||||||
| (millions of Canadian dollars) | ||||||||
| Algonquin Gas Transmission, L.L.C | ||||||||
| Maritimes & Northeast Pipeline, L.L.C | ||||||||
| Renewable energy assets | ||||||||
Westcoast Energy Inc.1 | ||||||||
1Represents 12 million and 16.6 million cumulative redeemable preferred shares as at December 31, 2020 and 2019, respectively.
149
Westcoast Preferred Shares Redemption
On March 20, 2019, Westcoast Energy Inc. (Westcoast) exercised its right to redeem all of its outstanding 5.5 % Cumulative Redeemable First Preferred Shares, Series 7 (Series 7 Shares) and all of its outstanding 5.6 % Cumulative Redeemable First Preferred Shares, Series 8 (Series 8 Shares) at a price of $25.00 per Series 7 Share and $25.00 per Series 8 Share, respectively, for a total payment of $300 million. In addition, payment of $4 million was made for all accrued and unpaid dividends. As a result, we recorded a $300 million decrease in Noncontrolling interests for the year ended December 31, 2019.
On December 16, 2020, Westcoast declared its intent to exercise its right to redeem all of its outstanding Cumulative Redeemable First Preferred Shares, Series 10 (Series 10 Shares) on January 15, 2021 at a price of $25.00 per Series 10 Share, for a par value of $115 million. This amount was included in Accounts payable and other in the Consolidated Statements of Financial Position as at December 31, 2020. As a result, we recorded a decrease of $112 million, which represents the par value less related issuance costs, in Noncontrolling interests for the year ended December 31, 2020.
US Sponsored Vehicles Buy-in
On August 24, 2018, we entered into a definitive agreement with SEP under which we agreed to acquire all of the outstanding public common units of SEP not already owned by us or our subsidiaries on the basis of 1.111 of our common shares for each common unit of SEP. Upon the closing of the transaction on December 17, 2018, we acquired all of the public common units of SEP and SEP became an indirect, wholly-owned subsidiary of Enbridge. The transaction was valued at $3.9 billion based on the closing price of our common shares on the New York Stock Exchange (NYSE) on December 14, 2018. As a result of this buy-in, we recorded a decrease in Noncontrolling interests, Additional paid-in capital and Deferred income tax liabilities of $3.0 billion, $642 million and $167 million, respectively.
On September 17, 2018, we entered into definitive agreements with each of EEP and Enbridge Energy Management, L.L.C. (EEM) under which we agreed to acquire all of the outstanding public class A common units of EEP and all of the outstanding public listed shares of EEM not already owned by us or our subsidiaries. Under the agreements, EEP public unitholders received 0.335 of our common shares for each class A common unit of EEP, and EEM public shareholders received 0.335 of our common shares for each listed share of EEM. Upon the closing of the respective transactions on December 20, 2018, we acquired all of the public Class A common units of EEP and shares of EEM, and both EEP and EEM became indirect, wholly-owned subsidiaries of Enbridge. The EEP and EEM transactions were valued at $3.0 billion and $1.3 billion, respectively, based on the closing price of our common shares on the NYSE on December 19, 2018. As a result of the buy-ins, collectedly for EEP and EEM, we recorded an increase in Noncontrolling interests and a decrease in Additional paid-in capital and Deferred income tax liabilities of $185 million, $3.7 billion and $707 million, respectively.
Canadian Sponsored Vehicle Buy-in
On September 17, 2018, we entered into a definitive agreement with Enbridge Income Fund Holdings Inc. (ENF) under which we would acquire all of the outstanding public common shares of ENF not already owned by us or our subsidiaries on the basis of 0.735 of our common shares and cash of $0.45 for each common share of ENF. Upon the closing of the transaction on November 8, 2018, we acquired all of the public common shares of ENF and ENF become a wholly-owned subsidiary of Enbridge. The transaction, excluding the cash component, was valued at $4.5 billion based on the closing price of our common shares on the Toronto Stock Exchange on November 7, 2018. As a result of this buy-in, we recorded a decrease in Redeemable noncontrolling interests and Additional paid-in capital of $4.5 billion and $25 million, respectively, with nil deferred tax impact. As at December 31, 2018, the balance of Redeemable noncontrolling interests was nil .
150
Renewable Assets
On August 1, 2018, we closed the sale of a 49 % interest in all of our Canadian renewable assets and a 49 % interest in two US renewable assets to CPP Investments (Note 8). As a result, we recorded an increase in Noncontrolling interests, Additional paid-in capital and Deferred income tax liabilities of $1.2 billion, $79 million and $27 million, respectively, in the third quarter of 2018.
SEP Incentive Distribution Rights
On January 22, 2018, Enbridge and SEP announced the execution of a definitive agreement, resulting in us converting all of our ownership of incentive distribution rights (IDRs) and general partner economic interests in SEP into 172.5 million newly issued SEP common units. As part of the transaction, all of the IDRs were eliminated. As a result of this restructuring, in 2018 we recorded a decrease in Noncontrolling interests of $1.5 billion and increases in Additional paid-in capital and Deferred income tax liabilities of $1.1 billion and $333 million, respectively. Subsequently in 2018, we acquired all of the outstanding common units of SEP (refer to US Sponsored Vehicles Buy-in above).
21. SHARE CAPITAL
Our authorized share capital consists of an unlimited number of common shares with no par value and an unlimited number of preference shares.
COMMON SHARES
| 2020 | 2019 | 2018 | ||||||||||||||||||
| Number | Number | Number | ||||||||||||||||||
| December 31, | of Shares | Amount | of Shares | Amount | of Shares | Amount | ||||||||||||||
| (millions of Canadian dollars; number of shares in millions) | ||||||||||||||||||||
| Balance at beginning of year | ||||||||||||||||||||
Common shares issued in Sponsored Vehicle buy-in (Note 20) | ||||||||||||||||||||
| Dividend Reinvestment and Share Purchase Plan | ||||||||||||||||||||
Shares issued on exercise of stock options | ||||||||||||||||||||
| Balance at end of year | ||||||||||||||||||||
151
PREFERENCE SHARES
| 2020 | 2019 | 2018 | ||||||||||||||||||
| Number | Number | Number | ||||||||||||||||||
| December 31, | of Shares | Amount | of Shares | Amount | of Shares | Amount | ||||||||||||||
| (millions of Canadian dollars; number of shares in millions) | ||||||||||||||||||||
| Preference Shares, Series A | ||||||||||||||||||||
| Preference Shares, Series B | ||||||||||||||||||||
| Preference Shares, Series C | ||||||||||||||||||||
| Preference Shares, Series D | ||||||||||||||||||||
| Preference Shares, Series F | ||||||||||||||||||||
| Preference Shares, Series H | ||||||||||||||||||||
| Preference Shares, Series J | ||||||||||||||||||||
| Preference Shares, Series L | ||||||||||||||||||||
| Preference Shares, Series N | ||||||||||||||||||||
| Preference Shares, Series P | ||||||||||||||||||||
| Preference Shares, Series R | ||||||||||||||||||||
| Preference Shares, Series 1 | ||||||||||||||||||||
| Preference Shares, Series 3 | ||||||||||||||||||||
| Preference Shares, Series 5 | ||||||||||||||||||||
| Preference Shares, Series 7 | ||||||||||||||||||||
| Preference Shares, Series 9 | ||||||||||||||||||||
| Preference Shares, Series 11 | ||||||||||||||||||||
| Preference Shares, Series 13 | ||||||||||||||||||||
| Preference Shares, Series 15 | ||||||||||||||||||||
| Preference Shares, Series 17 | ||||||||||||||||||||
| Preference Shares, Series 19 | ||||||||||||||||||||
| Issuance costs | ( | ( | ( | |||||||||||||||||
| Balance at end of year | ||||||||||||||||||||
152
Characteristics of the preference shares are as follows:
| Dividend Rate | Dividend1 | Per Share Base Redemption Value2 | Redemption and Conversion Option Date2,3 | Right to Convert Into3,4 | |||||||||||||
| (Canadian dollars unless otherwise stated) | |||||||||||||||||
| Preference Shares, Series A | % | $ | $ | — | — | ||||||||||||
| Preference Shares, Series B | % | $ | $ | June 1, 2022 | Series C | ||||||||||||
Preference Shares, Series C5 | 3-month treasury bill plus 2.40% | $ | June 1, 2022 | Series B | |||||||||||||
| Preference Shares, Series D | % | $ | $ | March 1, 2023 | Series E | ||||||||||||
| Preference Shares, Series F | % | $ | $ | June 1, 2023 | Series G | ||||||||||||
| Preference Shares, Series H | % | $ | $ | September 1, 2023 | Series I | ||||||||||||
| Preference Shares, Series J | % | US$ | US$ | June 1, 2022 | Series K | ||||||||||||
| Preference Shares, Series L | % | US$ | US$ | September 1, 2022 | Series M | ||||||||||||
| Preference Shares, Series N | % | $ | $ | December 1, 2023 | Series O | ||||||||||||
| Preference Shares, Series P | % | $ | $ | March 1, 2024 | Series Q | ||||||||||||
| Preference Shares, Series R | % | $ | $ | June 1, 2024 | Series S | ||||||||||||
| Preference Shares, Series 1 | % | US$ | US$ | June 1, 2023 | Series 2 | ||||||||||||
| Preference Shares, Series 3 | % | $ | $ | September 1, 2024 | Series 4 | ||||||||||||
| Preference Shares, Series 5 | % | US$ | US$ | March 1, 2024 | Series 6 | ||||||||||||
| Preference Shares, Series 7 | % | $ | $ | March 1, 2024 | Series 8 | ||||||||||||
| Preference Shares, Series 9 | % | $ | $ | December 1, 2024 | Series 10 | ||||||||||||
Preference Shares, Series 116 | % | $ | $ | March 1, 2025 | Series 12 | ||||||||||||
Preference Shares, Series 136 | % | $ | $ | June 1, 2025 | Series 14 | ||||||||||||
Preference Shares, Series 156 | % | $ | $ | September 1, 2025 | Series 16 | ||||||||||||
| Preference Shares, Series 17 | % | $ | $ | March 1, 2022 | Series 18 | ||||||||||||
| Preference Shares, Series 19 | % | $ | $ | March 1, 2023 | Series 20 | ||||||||||||
1The holder is entitled to receive a fixed, cumulative, quarterly preferential dividend, as declared by the Board of Directors. With the exception of Series A and Series C Preference Shares, such fixed dividend rate resets every five years beginning on the initial redemption and conversion option date. The Series 17 and Series 19 Preference Shares contain a feature where the fixed dividend rate, when reset every five years , will not be less than 5.15 % and 4.90 %, respectively. No other series of Preference Shares has this feature.
2Series A Preference Shares may be redeemed any time at our option. For all other series of Preference Shares, we, may at our option, redeem all or a portion of the outstanding Preference Shares for the Base Redemption Value per share plus all accrued and unpaid dividends on the Redemption Option Date and on every fifth anniversary thereafter.
3The holder will have the right, subject to certain conditions, to convert their shares into Cumulative Redeemable Preference Shares of a specified series on a one -for-one basis on the Conversion Option Date and every fifth anniversary thereafter at an ascribed issue price equal to the Base Redemption Value.
4With the exception of Series A Preference Shares, after the redemption and conversion option dates, holders may elect to receive quarterly floating rate cumulative dividends per share at a rate equal to: $25 x (number of days in quarter/number of days in a year) x three-month Government of Canada treasury bill rate + 2.4 % (Series C), 2.4 % (Series E), 2.5 % (Series G), 2.1 % (Series I), 2.7 % (Series O), 2.5 % (Series Q), 2.5 % (Series S), 2.4 % (Series 4), 2.6 % (Series 8), 2.7 % (Series 10), 2.6 % (Series 12), 2.7 % (Series 14), 2.7 % (Series 16), 4.1 % (Series 18) or 3.2 % (Series 20); or US$25 x (number of days in quarter/number of days in a year) x three-month US Government treasury bill rate + 3.1 % (Series K), 3.2 % (Series M), 3.1 % (Series 2) or 2.8 % (Series 6).
5The floating quarterly dividend amount for the Series C Preference Shares was increased to $0.25458 from $0.25305 on March 1, 2020, was decreased to $0.16779 from $0.25458 on June 1, 2020, was decreased to $0.15975 from $0.16779 on September 1, 2020 and was decreased to $0.15349 from $0.15975 on December 1, 2020, due to reset on a quarterly basis following the issuance thereof.
153
DIVIDEND REINVESTMENT AND SHARE PURCHASE PLAN
On November 2, 2018, we announced the suspension of our dividend reinvestment and share purchase plan (DRIP), effective immediately. Prior to the announcement, our shareholders were able to participate in the DRIP, which enabled participants to reinvest their dividends in our common shares at a 2 % discount to market price and to make additional optional cash payments to purchase common shares at the market price, free of brokerage or other charges. Refer to Item 7. Management's Discussion and Analysis of Financial Condition and Results of Operations - Liquidity and Capital Resources - Dividends for details on dividends paid.
SHAREHOLDER RIGHTS PLAN
The Shareholder Rights Plan is designed to encourage the fair treatment of our shareholders in connection with any takeover offer. Rights issued under the plan become exercisable when a person and any related parties acquires or announces its intention to acquire 20 % or more of our outstanding common shares without complying with certain provisions set out in the plan or without approval of our Board of Directors. Should such an acquisition occur, each rights holder, other than the acquiring person and related parties, will have the right to purchase our common shares at a 50 % discount to the market price at that time.
22. STOCK OPTION AND STOCK UNIT PLANS
We maintain four long-term incentive compensation plans: the ISO Plan, the Performance Stock Options (PSO) Plan, the PSU Plan and the RSU Plan. Total stock-based compensation expense recorded for the years ended December 31, 2020, 2019 and 2018 was $145 million, $117 million and $106 million, respectively. Disclosure of activity and assumptions for material stock-based compensation plans are included below.
INCENTIVE STOCK OPTIONS
Certain key employees are granted ISOs to purchase common shares at the grant date market price. ISOs vest in equal annual installments over a -year period and expire 10 years after the issue date.
| December 31, 2020 | Number | Weighted Average Exercise Price | Weighted Average Remaining Contractual Life (years) | Aggregate Intrinsic Value | ||||||||||
| (options in thousands; intrinsic value in millions of Canadian dollars; weighted average exercise price in Canadian dollars) | ||||||||||||||
| Options outstanding at beginning of year | ||||||||||||||
| Options granted | ||||||||||||||
Options exercised1 | ( | |||||||||||||
| Options cancelled or expired | ( | |||||||||||||
| Options outstanding at end of year | ||||||||||||||
Options vested at end of year2 | ||||||||||||||
1The total intrinsic value of ISOs exercised during the years ended December 31, 2020, 2019 and 2018 was $13 million, $58 million and $42 million, respectively, and cash received on exercise was $4 million, $1 million and $15 million, respectively.
2The total fair value of ISOs vested during the years ended December 31, 2020, 2019 and 2018 was $30 million, $32 million and $36 million, respectively.
154
Weighted average assumptions used to determine the fair value of ISOs granted using the Black-Scholes-Merton option pricing model are as follows:
| Year ended December 31, | 2020 | 2019 | 2018 | ||||||||
Fair value per option (Canadian dollars)1 | |||||||||||
| Valuation assumptions | |||||||||||
Expected option term (years)2 | |||||||||||
Expected volatility3 | % | % | % | ||||||||
Expected dividend yield4 | % | % | % | ||||||||
Risk-free interest rate5 | % | % | % | ||||||||
1Options granted to US employees are based on NYSE prices. The option value and assumptions shown are based on a weighted average of the US and the Canadian options. The fair values per option for the years ended December 31, 2020, 2019 and 2018 were $3.75 , $4.04 and $3.75 , respectively, for Canadian employees and US$3.62 , US$4.09 and US$3.30 , respectively, for US employees.
2The expected option term is six years based on historical exercise practice and five years for retirement eligible employees.
3Expected volatility is determined with reference to historic daily share price volatility and consideration of the implied volatility observable in call option values near the grant date.
4The expected dividend yield is the current annual dividend at the grant date divided by the current stock price.
5The risk-free interest rate is based on the Government of Canada’s Canadian Bond Yields and the US Treasury Bond Yields.
Compensation expense recorded for the years ended December 31, 2020, 2019 and 2018 for ISOs was $24 million, $32 million and $28 million, respectively. As at December 31, 2020, unrecognized compensation expense related to non-vested stock-based compensation arrangements granted under the ISO Plan was $13 million. The expense is expected to be fully recognized over a weighted average period of approximately two years .
PERFORMANCE STOCK UNITS
Under PSU awards for certain key employees, cash awards are paid following a three-year performance cycle. Awards are calculated by multiplying the number of units outstanding at the end of the performance period by Enbridge's weighted average share price for 20 days prior to the maturity of the grant and by a performance multiplier. The performance multiplier ranges from zero , if our performance fails to meet threshold performance levels, to a maximum of two if we perform within the highest range of the performance targets. The performance multiplier is derived through a calculation of our Total Shareholder Return percentile rank, in each case relative to a specified peer group of companies and our distributable cash flow, adjusted for unusual, non-operating or non-recurring items, relative to targets established at the time of grant. To calculate the 2020 expense, a multiplier of 1.5 was used for 2020 PSU grants, 1.0 for 2019 PSU grants and 1.8 for the 2018 PSU grants.
| December 31, 2020 | Number | Weighted Average Remaining Contractual Life (years) | Aggregate Intrinsic Value | ||||||||
| (units in thousands; intrinsic value in millions of Canadian dollars) | |||||||||||
| Units outstanding at beginning of year | |||||||||||
| Units granted | |||||||||||
| Units cancelled | ( | ||||||||||
Units matured1 | ( | ||||||||||
| Dividend reinvestment | |||||||||||
| Units outstanding at end of year | |||||||||||
1The total amount paid during the years ended December 31, 2020, 2019 and 2018 for PSUs was $14 million, $19 million and $18 million, respectively.
155
Compensation expense recorded for the years ended December 31, 2020, 2019 and 2018 for PSUs was $76 million, $40 million and $15 million, respectively. As at December 31, 2020, unrecognized compensation expense related to non-vested PSUs was $46 million. The expense is expected to be fully recognized over a weighted average period of approximately two years .
RESTRICTED STOCK UNITS
Under RSU awards, cash awards are paid to certain of our employees following a 35 -month maturity period. RSU holders receive cash equal to our weighted average share price for 20 days prior to the maturity of the grant multiplied by the units outstanding on the maturity date.
| December 31, 2020 | Number | Weighted Average Remaining Contractual Life (years) | Aggregate Intrinsic Value | ||||||||
| (units in thousands; intrinsic value in millions of Canadian dollars) | |||||||||||
| Units outstanding at beginning of year | |||||||||||
| Units granted | |||||||||||
| Units cancelled | ( | ||||||||||
Units matured1 | ( | ||||||||||
| Dividend reinvestment | |||||||||||
| Units outstanding at end of year | |||||||||||
1The total amount paid during the years ended December 31, 2020, 2019 and 2018 for RSUs was $27 million, $34 million and $41 million, respectively.
Compensation expense recorded for the years ended December 31, 2020, 2019 and 2018 for RSUs was $44 million, $41 million and $32 million, respectively. As at December 31, 2020, unrecognized compensation expense related to non-vested RSUs was $50 million. The expense is expected to be fully recognized over a weighted average period of approximately two years .
23. COMPONENTS OF ACCUMULATED OTHER COMPREHENSIVE INCOME/(LOSS)
Changes in AOCI attributable to our common shareholders for the years ended December 31, 2020, 2019 and 2018 are as follows:
Cash Flow Hedges | Excluded Components of Fair Value Hedges | Net Investment Hedges | Cumulative Translation Adjustment | Equity Investees | Pension and OPEB Adjustment | Total | |||||||||||||||||
| (millions of Canadian dollars) | |||||||||||||||||||||||
| Balance at January 1, 2020 | ( | ( | ( | ( | |||||||||||||||||||
Other comprehensive income/(loss) retained in AOCI | ( | ( | ( | ( | ( | ||||||||||||||||||
Other comprehensive (income)/loss reclassified to earnings | |||||||||||||||||||||||
Interest rate contracts1 | — | — | — | — | — | ||||||||||||||||||
Foreign exchange contracts3 | — | — | — | — | — | ||||||||||||||||||
Other contracts4 | ( | — | — | — | — | — | ( | ||||||||||||||||
Amortization of pension and OPEB actuarial loss and prior service costs5 | — | — | — | — | — | ||||||||||||||||||
| ( | ( | ( | ( | ( | |||||||||||||||||||
| Tax impact | |||||||||||||||||||||||
| Income tax on amounts retained in AOCI | — | ( | — | ||||||||||||||||||||
| Income tax on amounts reclassified to earnings | ( | — | — | — | — | ( | ( | ||||||||||||||||
| ( | — | ||||||||||||||||||||||
| Balance at December 31, 2020 | ( | ( | ( | ( | |||||||||||||||||||
156
Cash Flow Hedges | Net Investment Hedges | Cumulative Translation Adjustment | Equity Investees | Pension and OPEB Adjustment | Total | |||||||||||||||
| (millions of Canadian dollars) | ||||||||||||||||||||
| Balance at January 1, 2019 | ( | ( | ( | |||||||||||||||||
Other comprehensive income/(loss) retained in AOCI | ( | ( | ( | ( | ||||||||||||||||
Other comprehensive (income)/loss reclassified to earnings | ||||||||||||||||||||
Interest rate contracts1 | — | — | — | — | ||||||||||||||||
Commodity contracts2 | ( | — | — | — | — | ( | ||||||||||||||
Foreign exchange contracts3 | — | — | — | — | ||||||||||||||||
Other contracts4 | ( | — | — | — | — | ( | ||||||||||||||
Amortization of pension and OPEB actuarial loss and prior service costs5 | — | — | — | — | ||||||||||||||||
| ( | ( | ( | ( | |||||||||||||||||
| Tax impact | ||||||||||||||||||||
| Income tax on amounts retained in AOCI | ( | — | ||||||||||||||||||
| Income tax on amounts reclassified to earnings | ( | — | — | — | ( | ( | ||||||||||||||
| ( | — | |||||||||||||||||||
| Other | — | ( | ||||||||||||||||||
| Balance at December 31, 2019 | ( | ( | ( | ( | ||||||||||||||||
Cash Flow Hedges | Net Investment Hedges | Cumulative Translation Adjustment | Equity Investees | Pension and OPEB Adjustment | Total | |||||||||||||||
| (millions of Canadian dollars) | ||||||||||||||||||||
| Balance at January 1, 2018 | ( | ( | ( | ( | ||||||||||||||||
Other comprehensive income/(loss) retained in AOCI | ( | ( | ( | |||||||||||||||||
Other comprehensive (income)/loss reclassified to earnings | ||||||||||||||||||||
Interest rate contracts1 | — | — | — | — | ||||||||||||||||
Commodity contracts2 | ( | — | — | — | — | ( | ||||||||||||||
Foreign exchange contracts3 | — | — | — | — | ||||||||||||||||
Other contracts4 | — | — | — | — | ||||||||||||||||
Amortization of pension and OPEB actuarial loss and prior service costs5 | — | — | — | — | ||||||||||||||||
| ( | ( | ( | ||||||||||||||||||
| Tax impact | ||||||||||||||||||||
| Income tax on amounts retained in AOCI | — | |||||||||||||||||||
Income tax on amounts reclassified to earnings | ( | — | — | — | ( | ( | ||||||||||||||
| — | ||||||||||||||||||||
Sponsored Vehicles buy-in6 | ( | — | ( | ( | ||||||||||||||||
| Balance at December 31, 2018 | ( | ( | ( | |||||||||||||||||
1Reported within Interest expense in the Consolidated Statements of Earnings.
2Reported within Transportation and other services revenue, Commodity sales revenues, Commodity costs and Operating and administrative expense in the Consolidated Statements of Earnings.
3Reported within Transportation and other services revenues and Net foreign currency gain/(loss) in the Consolidated Statements of Earnings.
4Reported within Operating and administrative expense in the Consolidated Statements of Earnings.
5These components are included in the computation of net benefit costs and are reported within Other income/(expense) in the Consolidated Statements of Earnings.
6Represents the historical noncontrolling interests and redeemable noncontrolling interests related to the Sponsored Vehicles reclassified to AOCI, upon the completion of the buy-in.
157
24. RISK MANAGEMENT AND FINANCIAL INSTRUMENTS
MARKET RISK
Our earnings, cash flows and OCI are subject to movements in foreign exchange rates, interest rates, commodity prices and our share price (collectively, market risks). Formal risk management policies, processes and systems have been designed to mitigate these risks.
The following summarizes the types of market risks to which we are exposed and the risk management instruments used to mitigate them. We use a combination of qualifying and non-qualifying derivative instruments to manage the risks noted below.
Foreign Exchange Risk
We generate certain revenues, incur expenses and hold a number of investments and subsidiaries that are denominated in currencies other than Canadian dollars. As a result, our earnings, cash flows and OCI are exposed to fluctuations resulting from foreign exchange rate variability.
We employ financial derivative instruments to hedge foreign currency denominated earnings exposure. A combination of qualifying and non-qualifying derivative instruments is used to hedge anticipated foreign currency denominated revenues and expenses and to manage variability in cash flows. We hedge certain net investments in US dollar denominated investments and subsidiaries using foreign currency derivatives and US dollar denominated debt.
Interest Rate Risk
Our earnings and cash flows are exposed to short-term interest rate variability due to the regular repricing of our variable rate debt, primarily commercial paper. We monitor our debt portfolio mix of fixed and variable rate debt instruments to manage a consolidated portfolio of floating rate debt within the Board of Directors approved policy limit of a maximum of 30% of floating rate debt as a percentage of total debt outstanding. We primarily use qualifying derivative instruments to manage interest rate risk. Pay fixed-receive floating interest rate swaps may be used to hedge against the effect of future interest rate movements. We have implemented a program to significantly mitigate the impact of short-term interest rate volatility on interest expense via execution of floating to fixed interest rate swaps with an average swap rate of 3%.
We are exposed to changes in the fair value of fixed rate debt that arise as a result of changes in market interest rates. Pay floating-receive fixed interest rate swaps are used, when applicable, to hedge against future changes to the fair value of fixed rate debt which mitigates the impact of fluctuations in fair value via execution of fixed to floating interest rate swaps. As at December 31, 2020, we do not have any pay floating-receive fixed interest rate swaps outstanding.
Our earnings and cash flows are also exposed to variability in longer term interest rates ahead of anticipated fixed rate term debt issuances. Forward starting interest rate swaps are used to hedge against the effect of future interest rate movements. We have established a program within some of our subsidiaries to mitigate our exposure to long-term interest rate variability on select forecast term debt issuances via execution of floating to fixed interest rate swaps with an average swap rate of 2.3%.
Commodity Price Risk
Our earnings and cash flows are exposed to changes in commodity prices as a result of our ownership interests in certain assets and investments, as well as through the activities of our energy services subsidiaries. These commodities include natural gas, crude oil, power and NGL. We employ financial and physical derivative instruments to fix a portion of the variable price exposures that arise from physical transactions involving these commodities. We use primarily non-qualifying derivative instruments to manage commodity price risk.
158
Equity Price Risk
Equity price risk is the risk of earnings fluctuations due to changes in our share price. We have exposure to our own common share price through the issuance of various forms of stock-based compensation, which affect earnings through revaluation of the outstanding units every period. We use equity derivatives to manage the earnings volatility derived from one form of stock-based compensation, restricted share units. We use a combination of qualifying and non-qualifying derivative instruments to manage equity price risk.
COVID-19 PANDEMIC RISK
The spread of the COVID-19 pandemic has caused significant volatility in Canada, the US and international markets. While we have taken proactive measures to deliver energy safely and reliably during this pandemic, given the ongoing dynamic nature of the circumstances surrounding COVID-19, the impact of this pandemic on our business remains uncertain.
TOTAL DERIVATIVE INSTRUMENTS
The following table summarizes the Consolidated Statements of Financial Position location and carrying value of our derivative instruments.
We generally have a policy of entering into individual International Swaps and Derivatives Association, Inc. agreements, or other similar derivative agreements, with the majority of our financial derivative counterparties. These agreements provide for the net settlement of derivative instruments outstanding with specific counterparties in the event of bankruptcy or other significant credit events and reduce our credit risk exposure on financial derivative asset positions outstanding with the counterparties in those circumstances. The following table summarizes the maximum potential settlement amounts in the event of these specific circumstances. All amounts are presented gross in the Consolidated Statements of Financial Position.
159
The following table summarizes the maximum potential settlement amounts in the event of these specific circumstances. All amounts are presented gross in the Consolidated Statements of Financial Position.
| December 31, 2020 | Derivative Instruments Used as Cash Flow Hedges | Derivative Instruments Used as Net Investment Hedges | Derivative Instruments Used as Fair Value Hedges | Non- Qualifying Derivative Instruments | Total Gross Derivative Instruments as Presented | Amounts Available for Offset | Total Net Derivative Instruments | |||||||||||||||||||
| (millions of Canadian dollars) | ||||||||||||||||||||||||||
| Accounts receivable and other | ||||||||||||||||||||||||||
| Foreign exchange contracts | ( | |||||||||||||||||||||||||
| Interest rate contracts | ||||||||||||||||||||||||||
| Commodity contracts | ( | |||||||||||||||||||||||||
| Other contracts | ||||||||||||||||||||||||||
1 | ( | |||||||||||||||||||||||||
Deferred amounts and other assets | ||||||||||||||||||||||||||
| Foreign exchange contracts | ( | |||||||||||||||||||||||||
| Interest rate contracts | ( | |||||||||||||||||||||||||
| Commodity contracts | ( | |||||||||||||||||||||||||
| Other contracts | ||||||||||||||||||||||||||
| ( | ||||||||||||||||||||||||||
| Accounts payable and other | ||||||||||||||||||||||||||
| Foreign exchange contracts | ( | ( | ( | ( | ( | |||||||||||||||||||||
| Interest rate contracts | ( | ( | ( | ( | ||||||||||||||||||||||
| Commodity contracts | ( | ( | ( | ( | ||||||||||||||||||||||
| Other contracts | ( | ( | ( | ( | ||||||||||||||||||||||
| ( | ( | ( | ( | 2 | ( | |||||||||||||||||||||
| Other long-term liabilities | ||||||||||||||||||||||||||
| Foreign exchange contracts | ( | ( | ( | ( | ||||||||||||||||||||||
| Interest rate contracts | ( | ( | ( | ( | ||||||||||||||||||||||
| Commodity contracts | ( | ( | ( | ( | ||||||||||||||||||||||
| Other contracts | ||||||||||||||||||||||||||
| ( | ( | ( | ( | ( | ||||||||||||||||||||||
| Total net derivative asset/(liability) | ||||||||||||||||||||||||||
| Foreign exchange contracts | ( | ( | ( | — | ( | |||||||||||||||||||||
| Interest rate contracts | ( | ( | ( | — | ( | |||||||||||||||||||||
| Commodity contracts | ( | ( | ( | — | ( | |||||||||||||||||||||
| Other contracts | ( | ( | ( | — | ( | |||||||||||||||||||||
| ( | ( | ( | ( | — | ( | |||||||||||||||||||||
1Reported within Accounts receivable and other (2020 - $323 million; 2019 - $327 million) and Accounts receivable from affiliates (2020 - nil ; 2019 - $1 million) on the Consolidated Statements of Financial Position.
2Reported within Accounts payable and other (2020 - $894 million; 2019 - $920 million) and Accounts payable to affiliates (2020 - nil ; 2019 - $16 million) on the Consolidated Statements of Financial Position.
160
| December 31, 2019 | Derivative Instruments Used as Cash Flow Hedges | Derivative Instruments Used as Net Investment Hedges | Non- Qualifying Derivative Instruments | Total Gross Derivative Instruments as Presented | Amounts Available for Offset | Total Net Derivative Instruments | ||||||||||||||
| (millions of Canadian dollars) | ||||||||||||||||||||
| Accounts receivable and other | ||||||||||||||||||||
| Foreign exchange contracts | ( | |||||||||||||||||||
| Commodity contracts | ( | |||||||||||||||||||
| Other contracts | ||||||||||||||||||||
| ( | ||||||||||||||||||||
Deferred amounts and other assets | ||||||||||||||||||||
| Foreign exchange contracts | ( | |||||||||||||||||||
| Commodity contracts | ( | |||||||||||||||||||
| Other contracts | ||||||||||||||||||||
| ( | ||||||||||||||||||||
| Accounts payable and other | ||||||||||||||||||||
| Foreign exchange contracts | ( | ( | ( | ( | ( | |||||||||||||||
| Interest rate contracts | ( | ( | ( | |||||||||||||||||
| Commodity contracts | ( | ( | ( | |||||||||||||||||
| ( | ( | ( | ( | ( | ||||||||||||||||
| Other long-term liabilities | ||||||||||||||||||||
| Foreign exchange contracts | ( | ( | ( | |||||||||||||||||
| Interest rate contracts | ( | ( | ( | |||||||||||||||||
| Commodity contracts | ( | ( | ( | ( | ||||||||||||||||
| ( | ( | ( | ( | |||||||||||||||||
Total net derivative asset/(liability) | ||||||||||||||||||||
| Foreign exchange contracts | ( | ( | ( | — | ( | |||||||||||||||
| Interest rate contracts | ( | ( | — | ( | ||||||||||||||||
| Commodity contracts | ( | ( | ( | — | ( | |||||||||||||||
| Other contracts | — | |||||||||||||||||||
| ( | ( | ( | ( | — | ( | |||||||||||||||
161
The following table summarizes the maturity and notional principal or quantity outstanding related to our derivative instruments.
| 2020 | 2019 | ||||||||||||||||||||||||||||||||||
| As at December 31, | 2021 | 2022 | 2023 | 2024 | 2025 | Thereafter | Total | Total | |||||||||||||||||||||||||||
Foreign exchange contracts - US dollar forwards - purchase (millions of US dollars) | |||||||||||||||||||||||||||||||||||
Foreign exchange contracts - US dollar forwards - sell (millions of US dollars) | |||||||||||||||||||||||||||||||||||
Foreign exchange contracts - British pound (GBP) forwards - sell (millions of GBP) | |||||||||||||||||||||||||||||||||||
Foreign exchange contracts - Euro forwards - sell (millions of Euro) | |||||||||||||||||||||||||||||||||||
Foreign exchange contracts - Japanese yen forwards - purchase (millions of yen) | |||||||||||||||||||||||||||||||||||
Interest rate contracts - short-term pay fixed rate (millions of Canadian dollars) | |||||||||||||||||||||||||||||||||||
Interest rate contracts - long-term pay fixed rate (millions of Canadian dollars) | |||||||||||||||||||||||||||||||||||
Equity contracts (millions of Canadian dollars) | |||||||||||||||||||||||||||||||||||
Commodity contracts - natural gas (billions of cubic feet) | ( | ||||||||||||||||||||||||||||||||||
Commodity contracts - crude oil (millions of barrels) | |||||||||||||||||||||||||||||||||||
Commodity contracts - NGL (millions of barrels) | |||||||||||||||||||||||||||||||||||
Commodity contracts - power (megawatt per hour (MW/H) | ( | ( | ( | ( | ( | ( | 1 | ( | 1 | ||||||||||||||||||||||||||
1Total is an average net purchase/(sell) of power.
162
The Effect of Derivative Instruments on the Statements of Earnings and Comprehensive Income
The following table presents the effect of cash flow hedges and net investment hedges on our consolidated earnings and consolidated comprehensive income, before the effect of income taxes:
| 2020 | 2019 | 2018 | |||||||||
| (millions of Canadian dollars) | |||||||||||
Amount of unrealized gain/(loss) recognized in OCI | |||||||||||
Cash flow hedges | |||||||||||
Foreign exchange contracts | ( | ( | |||||||||
Interest rate contracts | ( | ( | ( | ||||||||
Commodity contracts | ( | ||||||||||
Other contracts | ( | ( | |||||||||
| Fair value hedges | |||||||||||
| Foreign exchange contracts | |||||||||||
Net investment hedges | |||||||||||
Foreign exchange contracts | |||||||||||
| ( | ( | ( | |||||||||
Amount of (gain)/loss reclassified from AOCI to earnings | |||||||||||
Foreign exchange contracts1 | |||||||||||
Interest rate contracts2 | |||||||||||
Commodity contracts3 | ( | ( | |||||||||
Other contracts4 | ( | ( | |||||||||
1Reported within Transportation and other services revenues and Net foreign currency gain/(loss) in the Consolidated Statements of Earnings.
2Reported within Interest expense in the Consolidated Statements of Earnings.
3Reported within Transportation and other services revenue, Commodity sales revenues, Commodity costs and Operating and administrative expense in the Consolidated Statements of Earnings.
4Reported within Operating and administrative expenses in the Consolidated Statements of Earnings.
We estimate that a loss of $127 million from AOCI related to cash flow hedges will be reclassified to earnings in the next 12 months. Actual amounts reclassified to earnings depend on the foreign exchange rates, interest rates and commodity prices in effect when derivative contracts that are currently outstanding mature. For all forecasted transactions, the maximum term over which we are hedging exposures to the variability of cash flows is 36 months as at December 31, 2020.
Fair Value Derivatives
For interest rate derivative instruments that are designated and qualify as fair value hedges, the gain or loss on the derivative as well as the offsetting loss or gain on the hedged item attributable to the hedged risk is included in Interest expense in the Consolidated Statements of Earnings.
| Year ended December 31, | 2020 | 2019 | ||||||
| (millions of Canadian dollars) | ||||||||
| Unrealized loss on derivative | ( | |||||||
| Unrealized gain on hedged item | ||||||||
| Realized loss on derivative | ( | |||||||
| Realized loss on hedged item | ||||||||
163
Non-Qualifying Derivatives
The following table presents the unrealized gains and losses associated with changes in the fair value of our non-qualifying derivatives:
| Year ended December 31, | 2020 | 2019 | 2018 | ||||||||
| (millions of Canadian dollars) | |||||||||||
Foreign exchange contracts1 | ( | ||||||||||
Interest rate contracts2 | ( | ||||||||||
Commodity contracts3 | ( | ( | |||||||||
Other contracts4 | ( | ( | |||||||||
| Total unrealized derivative fair value gain/(loss), net | ( | ||||||||||
1For the respective annual periods, reported within Transportation and other services revenue (2020 - $533 million gain; 2019 - $930 million gain; 2018 - $1,108 million loss) and Net foreign currency gain/(loss) (2020 - $369 million gain; 2019 - $696 million gain; 2018 - $282 million loss) in the Consolidated Statements of Earnings.
2Reported as an increase within Interest expense in the Consolidated Statements of Earnings.
3For the respective annual periods, reported within Transportation and other services revenue (2020 - $2 million loss; 2019 - $26 million loss; 2018 - $66 million gain), Commodity sales (2020 - $321 million loss; 2019 - $544 million loss; 2018 - $599 million gain), Commodity costs (2020 - $207 million gain; 2019 - $459 million gain; 2018 - $193 million loss) and Operating and administrative expense (2020 - $2 million gain; 2019 - $49 million gain; 2018 - $13 million gain) in the Consolidated Statements of Earnings.
LIQUIDITY RISK
Liquidity risk is the risk that we will not be able to meet our financial obligations, including commitments and guarantees, as they become due. In order to mitigate this risk, we forecast cash requirements over a 12 -month rolling time period to determine whether sufficient funds will be available and maintain substantial capacity under our committed bank lines of credit to address any contingencies. Our primary sources of liquidity and capital resources are funds generated from operations, the issuance of commercial paper and draws under committed credit facilities and long-term debt, which includes debentures and medium-term notes. We also maintain current shelf prospectuses with securities regulators which enables ready access to either the Canadian or US public capital markets, subject to market conditions. In addition, we maintain sufficient liquidity through committed credit facilities with a diversified group of banks and institutions which, if necessary, enables us to fund all anticipated requirements for approximately one year without accessing the capital markets. We are in compliance with all the terms and conditions of our committed credit facility agreements and term debt indentures as at December 31, 2020. As a result, all credit facilities are available to us and the banks are obligated to fund and have been funding us under the terms of the facilities.
CREDIT RISK
Entering into derivative instruments may result in exposure to credit risk from the possibility that a counterparty will default on its contractual obligations. In order to mitigate this risk, we enter into risk management transactions primarily with institutions that possess strong investment grade credit ratings. Credit risk relating to derivative counterparties is mitigated through maintenance and monitoring of credit exposure limits and contractual requirements, netting arrangements, and ongoing monitoring of counterparty credit exposure using external credit rating services and other analytical tools.
164
We have credit concentrations and credit exposure, with respect to derivative instruments, in the following counterparty segments:
| December 31, | 2020 | 2019 | ||||||
| (millions of Canadian dollars) | ||||||||
| Canadian financial institutions | ||||||||
| US financial institutions | ||||||||
| European financial institutions | ||||||||
| Asian financial institutions | ||||||||
Other1 | ||||||||
1Other is comprised of commodity clearing house and physical natural gas and crude oil counterparties.
As at December 31, 2020, we provided letters of credit totaling nil in lieu of providing cash collateral to our counterparties pursuant to the terms of the relevant International Swaps and Derivatives Association agreements. We held no cash collateral on derivative asset exposures as at December 31, 2020 and December 31, 2019.
Gross derivative balances have been presented without the effects of collateral posted. Derivative assets are adjusted for non-performance risk of our counterparties using their credit default swap spread rates, and are reflected at fair value. For derivative liabilities, our non-performance risk is considered in the valuation.
Credit risk also arises from trade and other long-term receivables, and is mitigated through credit exposure limits and contractual requirements, assessment of credit ratings and netting arrangements. Within Enbridge Gas, credit risk is mitigated by the utilities' large and diversified customer base and the ability to recover an estimate for doubtful accounts through the ratemaking process. We actively monitor the financial strength of large industrial customers and, in select cases, have obtained additional security to minimize the risk of default on receivables. Generally, we classify and provide for receivables older than 30 days as past due. The maximum exposure to credit risk related to non-derivative financial assets is their carrying value.
FAIR VALUE MEASUREMENTS
Our financial assets and liabilities measured at fair value on a recurring basis include derivative instruments. We also disclose the fair value of other financial instruments not measured at fair value. The fair value of financial instruments reflects our best estimates of market value based on generally accepted valuation techniques or models and is supported by observable market prices and rates. When such values are not available, we use discounted cash flow analysis from applicable yield curves based on observable market inputs to estimate fair value.
FAIR VALUE OF FINANCIAL INSTRUMENTS
We categorize our derivative instruments measured at fair value into one of three different levels depending on the observability of the inputs employed in the measurement.
Level 1
Level 1 includes derivatives measured at fair value based on unadjusted quoted prices for identical assets and liabilities in active markets that are accessible at the measurement date. An active market for a derivative is considered to be a market where transactions occur with sufficient frequency and volume to provide pricing information on an ongoing basis. Our Level 1 instruments consist primarily of exchange traded derivatives used to mitigate the risk of crude oil price fluctuations.
165
Level 2
Level 2 includes derivative valuations determined using directly or indirectly observable inputs other than quoted prices included within Level 1. Derivatives in this category are valued using models or other industry standard valuation techniques derived from observable market data. Such valuation techniques include inputs such as quoted forward prices, time value, volatility factors and broker quotes that can be observed or corroborated in the market for the entire duration of the derivative. Derivatives valued using Level 2 inputs include non-exchange traded derivatives such as over-the-counter foreign exchange forward and cross currency swap contracts, interest rate swaps, physical forward commodity contracts, as well as commodity swaps for which observable inputs can be obtained.
We have also categorized the fair value of our held to maturity preferred share investment and long-term debt as Level 2. The fair value of our held to maturity preferred share investment is primarily based on the yield of certain Government of Canada bonds. The fair value of our long-term debt is based on quoted market prices for instruments of similar yield, credit risk and tenor.
Level 3
Level 3 includes derivative valuations based on inputs which are less observable, unavailable or where the observable data does not support a significant portion of the derivatives’ fair value. Generally, Level 3 derivatives are longer dated transactions, occur in less active markets, occur at locations where pricing information is not available or have no binding broker quote to support Level 2 classification. We have developed methodologies, benchmarked against industry standards, to determine fair value for these derivatives based on extrapolation of observable future prices and rates. Derivatives valued using Level 3 inputs primarily include long-dated derivative power contracts and NGL and natural gas contracts, basis swaps, commodity swaps, power and energy swaps, as well as physical forward commodity contracts. We do not have any other financial instruments categorized in Level 3.
We use the most observable inputs available to estimate the fair value of our derivatives. When possible, we estimate the fair value of our derivatives based on quoted market prices. If quoted market prices are not available, we use estimates from third party brokers. For non-exchange traded derivatives classified in Levels 2 and 3, we use standard valuation techniques to calculate the estimated fair value. These methods include discounted cash flows for forwards and swaps and Black-Scholes-Merton pricing models for options. Depending on the type of derivative and nature of the underlying risk, we use observable market prices (interest, foreign exchange, commodity and share price) and volatility as primary inputs to these valuation techniques. Finally, we consider our own credit default swap spread as well as the credit default swap spreads associated with our counterparties in our estimation of fair value.
166
We have categorized our derivative assets and liabilities measured at fair value as follows:
| December 31, 2020 | Level 1 | Level 2 | Level 3 | Total Gross Derivative Instruments | ||||||||||
| (millions of Canadian dollars) | ||||||||||||||
| Financial assets | ||||||||||||||
| Current derivative assets | ||||||||||||||
| Foreign exchange contracts | ||||||||||||||
| Interest rate contracts | ||||||||||||||
| Commodity contracts | ||||||||||||||
| Long-term derivative assets | ||||||||||||||
| Foreign exchange contracts | ||||||||||||||
| Interest rate contracts | ||||||||||||||
| Commodity contracts | ||||||||||||||
| Financial liabilities | ||||||||||||||
| Current derivative liabilities | ||||||||||||||
| Foreign exchange contracts | ( | ( | ||||||||||||
| Interest rate contracts | ( | ( | ||||||||||||
| Commodity contracts | ( | ( | ( | ( | ||||||||||
| Other contracts | ( | ( | ||||||||||||
| ( | ( | ( | ( | |||||||||||
| Long-term derivative liabilities | ||||||||||||||
| Foreign exchange contracts | ( | ( | ||||||||||||
| Interest rate contracts | ( | ( | ||||||||||||
| Commodity contracts | ( | ( | ( | ( | ||||||||||
| ( | ( | ( | ( | |||||||||||
| Total net financial asset/(liability) | ||||||||||||||
| Foreign exchange contracts | ( | ( | ||||||||||||
| Interest rate contracts | ( | ( | ||||||||||||
| Commodity contracts | ( | ( | ||||||||||||
| Other contracts | ( | ( | ||||||||||||
| ( | ( | ( | ||||||||||||
167
| December 31, 2019 | Level 1 | Level 2 | Level 3 | Total Gross Derivative Instruments | ||||||||||
| (millions of Canadian dollars) | ||||||||||||||
| Financial assets | ||||||||||||||
| Current derivative assets | ||||||||||||||
| Foreign exchange contracts | ||||||||||||||
| Commodity contracts | ||||||||||||||
| Other contracts | ||||||||||||||
| Long-term derivative assets | ||||||||||||||
| Foreign exchange contracts | ||||||||||||||
| Commodity contracts | ||||||||||||||
| Other contracts | ||||||||||||||
| Financial liabilities | ||||||||||||||
| Current derivative liabilities | ||||||||||||||
| Foreign exchange contracts | ( | ( | ||||||||||||
| Interest rate contracts | ( | ( | ||||||||||||
| Commodity contracts | ( | ( | ( | ( | ||||||||||
| ( | ( | ( | ( | |||||||||||
| Long-term derivative liabilities | ||||||||||||||
| Foreign exchange contracts | ( | ( | ||||||||||||
| Interest rate contracts | ( | ( | ||||||||||||
| Commodity contracts | ( | ( | ( | |||||||||||
| ( | ( | ( | ||||||||||||
| Total net financial asset/(liability) | ||||||||||||||
| Foreign exchange contracts | ( | ( | ||||||||||||
| Interest rate contracts | ( | ( | ||||||||||||
| Commodity contracts | ( | ( | ( | |||||||||||
| Other contracts | ||||||||||||||
| ( | ( | ( | ( | |||||||||||
The significant unobservable inputs used in the fair value measurement of Level 3 derivative instruments were as follows:
| December 31, 2020 | Fair Value | Unobservable Input | Minimum Price/Volatility | Maximum Price/Volatility | Weighted Average Price/Volatility | Unit of Measurement | ||||||||||||||
| (fair value in millions of Canadian dollars) | ||||||||||||||||||||
Commodity contracts - financial1 | ||||||||||||||||||||
| Natural gas | Forward gas price | $/mmbtu2 | ||||||||||||||||||
| Crude | ( | Forward crude price | $/barrel | |||||||||||||||||
| NGL | ( | Forward NGL price | $/gallon | |||||||||||||||||
| Power | ( | Forward power price | $/MW/H | |||||||||||||||||
Commodity contracts - physical1 | ||||||||||||||||||||
| Natural gas | Forward gas price | $/mmbtu2 | ||||||||||||||||||
| Crude | ( | Forward crude price | $/barrel | |||||||||||||||||
| NGL | Forward NGL price | $/gallon | ||||||||||||||||||
| ( | ||||||||||||||||||||
1Financial and physical forward commodity contracts are valued using a market approach valuation technique.
2One million British thermal units (mmbtu).
168
If adjusted, the significant unobservable inputs disclosed in the table above would have a direct impact on the fair value of our Level 3 derivative instruments. The significant unobservable inputs used in the fair value measurement of Level 3 derivative instruments include forward commodity prices, and for option contracts, price volatility. Changes in forward commodity prices could result in significantly different fair values for our Level 3 derivatives. Changes in price volatility would change the value of the option contracts. Generally, a change in the estimate of forward commodity prices is unrelated to a change in the estimate of price volatility.
Changes in net fair value of derivative assets and liabilities classified as Level 3 in the fair value hierarchy were as follows:
| Year ended December 31, | 2020 | 2019 | ||||||
| (millions of Canadian dollars) | ||||||||
| Level 3 net derivative liability at beginning of period | ( | ( | ||||||
| Total gain/(loss) | ||||||||
Included in earnings1 | ( | |||||||
Included in OCI | ( | |||||||
| Settlements | ( | ( | ||||||
| Level 3 net derivative liability at end of period | ( | ( | ||||||
1Reported within Transportation and other services revenue, Commodity costs and Operating and administrative expenses in the Consolidated Statements of Earnings.
There were no transfers into or out of Level 3 as at December 31, 2020 or 2019.
NET INVESTMENT HEDGES
We have designated a portion of our US dollar denominated debt, as well as a portfolio of foreign exchange forward contracts, as a hedge of our net investment in US dollar denominated investments and subsidiaries.
During the years ended December 31, 2020 and 2019, we recognized an unrealized foreign exchange gain of $117 million and a gain of $317 million, respectively, on the translation of US dollar denominated debt and an unrealized gain on the change in fair value of our outstanding foreign exchange forward contracts of $13 million and $2 million, respectively, in OCI. During the years ended December 31, 2020 and 2019, we recognized a realized loss of $15 million and nil , respectively, in OCI associated with the settlement of foreign exchange forward contracts and also recognized a realized loss of nil and loss of nil , respectively, in OCI associated with the settlement of US dollar denominated debt that had matured during the period.
FAIR VALUE OF OTHER FINANCIAL INSTRUMENTS
Our other long-term investments in other entities with no actively quoted prices are classified as Fair Value Measurement Alternative (FVMA) investments and are recorded at cost less impairment. The carrying value of FVMA and other long-term investments totaled $52 million and $99 million as at December 31, 2020 and 2019, respectively.
In the first quarter of 2020, we recorded an other than temporary impairment loss of $1.7 billion on one of our equity method investments, DCP Midstream (Note 13). To calculate the impairment loss, we compared the carrying value of the DCP Midstream investment to its fair value at March 31, 2020. The fair value was based on the market price of DCP Midstream, LP's publicly-traded units as at March 31, 2020 and thus represented a Level 2 measurement. The carrying value of DCP Midstream was $331 million as at December 31, 2020.
169
In the third quarter of 2020, we recorded other than temporary impairment losses on two of our equity method investments, SESH and Steckman Ridge (Note 13). To calculate the impairment losses, we compared the carrying values of the investments to their fair values. The fair values were determined based on a discounted cash flow model using inputs not observable in the market, and thus represent Level 3 measurements. We applied an 8 % weighted average cost of capital and a long-term revenue growth rate of 0.5 % to estimate the fair value of SESH, and a 9 % weighted average cost of capital and a long-term revenue growth rate of 1 % to estimate the fair value of Steckman Ridge. The carrying value of SESH and Steckman Ridge was $84 million and $90 million as at December 31, 2020, respectively.
We have Restricted long-term investments held in trust totaling $553 million and $434 million as at December 31, 2020 and 2019, respectively, which are recognized at fair value.
We have a held to maturity preferred share investment carried at its amortized cost of $567 million and $580 million as at December 31, 2020 and 2019, respectively. These preferred shares are entitled to a cumulative preferred dividend based on the yield of 10 -year Government of Canada bonds plus a margin of 4.38 %. The fair value of this preferred share investment approximates its face value of $567 million and $580 million as at December 31, 2020 and 2019.
As at December 31, 2020 and 2019, our long-term debt had a carrying value of $66.1 billion and $64.4 billion, respectively, before debt issuance costs and a fair value of $75.1 billion and $70.5 billion, respectively. We also have non-current notes receivable carried at book value and recorded in Deferred amounts and other assets in the Consolidated Statements of Financial Position. As at December 31, 2020 and 2019, the non-current notes receivable had a carrying value of $1.1 billion and $1.0 billion, respectively, which also approximates their fair value.
The fair value of other financial assets and liabilities other than derivative instruments, other long-term investments, restricted long-term investments and long-term debt approximate their cost due to the short period to maturity.
170
25. INCOME TAXES
INCOME TAX RATE RECONCILIATION
| Year ended December 31, | 2020 | 2019 | 2018 | ||||||||
| (millions of Canadian dollars) | |||||||||||
| Earnings before income taxes | |||||||||||
| Canadian federal statutory income tax rate | % | % | % | ||||||||
| Expected federal taxes at statutory rate | |||||||||||
| Increase/(decrease) resulting from: | |||||||||||
Provincial and state income taxes1 | ( | ||||||||||
Foreign and other statutory rate differentials2 | ( | ||||||||||
| Impact of US tax reform | ( | ||||||||||
Effects of rate-regulated accounting3 | ( | ( | ( | ||||||||
Foreign allowable interest deductions4 | ( | ( | ( | ||||||||
Part VI.1 tax, net of federal Part I deduction5 | |||||||||||
Impairment of goodwill | |||||||||||
| US BEAT | |||||||||||
Non-taxable portion of gain on sale of investment to unrelated party6 | |||||||||||
Valuation allowance7 | ( | ( | |||||||||
Intercorporate investments8 | ( | ( | |||||||||
Noncontrolling interests | ( | ( | ( | ||||||||
Other | ( | ( | ( | ||||||||
| Income tax expense | |||||||||||
| Effective income tax rate | % | % | % | ||||||||
1.The change in provincial and state income taxes from 2019 to 2020 reflects the decrease in earnings from operations and the impact of state tax apportionment and rate changes in both the US and Canada.
2.The change in foreign and other statutory rate differentials from 2019 to 2020 reflects the decrease in earnings from US operations.
3.The amount in 2019 included the federal component of the tax benefit of the write-off of regulatory assets.
4.The decrease in foreign allowable interest deductions in 2019 was due to changes in the related loan portfolio and tax legislative changes in Canada, the US, and Europe.
5.Part VI.1 tax is a tax levied on preferred share dividends paid in Canada.
6.The amount represents the federal component of the non-taxable portion of the gain on the sales of the Canadian Natural Gas Gathering and Processing Businesses in 2018.
7.The decrease in 2020 is due to the federal component of the tax effect of a valuation allowance on the deferred tax assets that, in 2019, were not more likely than not to be realized.
8.The amounts in 2019 and 2018 relate to the federal component of changes in assertions regarding the manner of recovery of intercorporate investments such that deferred tax related to outside basis temporary differences was required to be recorded for MATL and for Renewable Assets, respectively.
171
COMPONENTS OF PRETAX EARNINGS AND INCOME TAXES
| Year ended December 31, | 2020 | 2019 | 2018 | ||||||||
| (millions of Canadian dollars) | |||||||||||
| Earnings before income taxes | |||||||||||
| Canada | |||||||||||
| US | |||||||||||
| Other | |||||||||||
| Current income taxes | |||||||||||
| Canada | |||||||||||
| US | |||||||||||
| Other | |||||||||||
| Deferred income taxes | |||||||||||
| Canada | ( | ||||||||||
| US | |||||||||||
| Other | ( | ||||||||||
| ( | |||||||||||
| Income tax expense | |||||||||||
COMPONENTS OF DEFERRED INCOME TAXES
Deferred tax assets and liabilities are recognized for the future tax consequences of differences between carrying amounts of assets and liabilities and their respective tax bases. Major components of deferred income tax assets and liabilities are as follows:
| December 31, | 2020 | 2019 | ||||||
| (millions of Canadian dollars) | ||||||||
| Deferred income tax liabilities | ||||||||
| Property, plant and equipment | ( | ( | ||||||
| Investments | ( | ( | ||||||
| Regulatory assets | ( | ( | ||||||
| Other | ( | ( | ||||||
| Total deferred income tax liabilities | ( | ( | ||||||
| Deferred income tax assets | ||||||||
| Financial instruments | ||||||||
| Pension and OPEB plans | ||||||||
| Loss carryforwards | ||||||||
| Other | ||||||||
| Total deferred income tax assets | ||||||||
| Less valuation allowance | ( | ( | ||||||
| Total deferred income tax assets, net | ||||||||
| Net deferred income tax liabilities | ( | ( | ||||||
| Presented as follows: | ||||||||
| Total deferred income tax assets | ||||||||
| Total deferred income tax liabilities | ( | ( | ||||||
| Net deferred income tax liabilities | ( | ( | ||||||
A valuation allowance has been established for certain loss and credit carryforwards, and outside basis temporary differences on investments that reduce deferred income tax assets to an amount that will more likely than not be realized.
172
As at December 31, 2020 and 2019, we recognized the benefit of unused tax loss carryforwards of $2.6 billion and $3.2 billion, respectively, in Canada which expire in 2026 and beyond.
As at December 31, 2020 and 2019, we recognized the benefit of unused tax loss carryforwards of $5.8 billion and $3.6 billion, respectively, in the US which expire in 2023 and beyond.
We have not provided for deferred income taxes on the difference between the carrying value of substantially all of our foreign subsidiaries and their corresponding tax basis as the earnings of those subsidiaries are intended to be permanently reinvested in their operations. As such these investments are not anticipated to give rise to income taxes in the foreseeable future. The difference between the carrying values of the investments and their tax bases is largely a result of unremitted earnings and currency translation adjustments. The unremitted earnings and currency translation adjustment for which no deferred taxes have been recognized in respect of foreign subsidiaries were $5.5 billion and $5.3 billion for the period December 31, 2020 and 2019, respectively. If such earnings are remitted, in the form of dividends or otherwise, we may be subject to income taxes and foreign withholding taxes. The determination of the amount of unrecognized deferred income tax liabilities on such amounts is not practicable.
Enbridge and certain of our subsidiaries are subject to taxation in Canada, the US and other foreign jurisdictions. The material jurisdictions in which we are subject to potential examinations include the US (Federal) and Canada (Federal, Alberta and Ontario). We are open to examination by Canadian tax authorities for the 2013 to 2020 tax years and by US tax authorities for the 2017 to 2020 tax years. We are currently under examination for income tax matters in Canada for the 2014 to 2017 tax years. We are not currently under examination for income tax matters in any other material jurisdiction where we are subject to income tax.
UNRECOGNIZED TAX BENEFITS
| Year ended December 31, | 2020 | 2019 | ||||||
| (millions of Canadian dollars) | ||||||||
| Unrecognized tax benefits at beginning of year | ||||||||
| Gross increases for tax positions of current year | ||||||||
| Gross decreases for tax positions of prior year | ( | ( | ||||||
| Change in translation of foreign currency | ( | ( | ||||||
| Lapses of statute of limitations | ( | ( | ||||||
| Unrecognized tax benefits at end of year | ||||||||
The unrecognized tax benefits as at December 31, 2020, if recognized, would impact our effective income tax rate. We do not anticipate further adjustments to the unrecognized tax benefits during the next 12 months that would have a material impact on our consolidated financial statements.
We recognize accrued interest and penalties related to unrecognized tax benefits as a component of income taxes. Interest and penalties included in income taxes for the years ended December 31, 2020 and 2019 were $3 million expense and $3 million expense, respectively, of interest and penalties. As at December 31, 2020 and 2019, interest and penalties of $17 million and $15 million, respectively, have been accrued.
173
26. PENSION AND OTHER POSTRETIREMENT BENEFITS
PENSION PLANS
We sponsor Canadian and US contributory and non-contributory registered defined benefit and defined contribution pension plans, which provide benefits covering substantially all employees. The Canadian Plans provide defined benefit and defined contribution pension benefits to our Canadian employees. The US Plans provide defined benefit pension benefits to our US employees. We also sponsor supplemental non-contributory defined benefit pension plans, which provide non-registered benefits for certain employees in Canada and the US.
Defined Benefit Pension Plan Benefits
Benefits payable from the defined benefit pension plans are based on each plan participant’s years of service and final average remuneration. Some benefits are partially inflation-indexed after a plan participant’s retirement. Our contributions are made in accordance with independent actuarial valuations. Participant contributions to contributory defined benefit pension plans are based upon each plan participant’s current eligible remuneration.
Defined Contribution Pension Plan Benefits
Our contributions are based on each plan participant’s current eligible remuneration. Our contributions for some defined contribution pension plans are also based on age and years of service. Our defined contribution pension benefit costs are equal to the amount of contributions required to be made by us.
174
Benefit Obligations, Plan Assets and Funded Status
The following table details the changes in the projected benefit obligation, the fair value of plan assets and the recorded assets or liabilities for our defined benefit pension plans:
| Canada | US | ||||||||||||||||
| December 31, | 2020 | 2019 | 2020 | 2019 | |||||||||||||
| (millions of Canadian dollars) | |||||||||||||||||
| Change in projected benefit obligation | |||||||||||||||||
| Projected benefit obligation at beginning of year | |||||||||||||||||
| Service cost | |||||||||||||||||
| Interest cost | |||||||||||||||||
| Participant contributions | |||||||||||||||||
Actuarial loss1 | |||||||||||||||||
| Benefits paid | ( | ( | ( | ( | |||||||||||||
Plan settlements2 | ( | ( | |||||||||||||||
| Transfers out | ( | ( | |||||||||||||||
| Foreign currency exchange rate changes | ( | ( | |||||||||||||||
| Other | ( | ( | |||||||||||||||
Projected benefit obligation at end of year3 | |||||||||||||||||
| Change in plan assets | |||||||||||||||||
| Fair value of plan assets at beginning of year | |||||||||||||||||
| Actual return on plan assets | |||||||||||||||||
| Employer contributions | |||||||||||||||||
| Participant contributions | |||||||||||||||||
| Benefits paid | ( | ( | ( | ( | |||||||||||||
Plan settlements2 | ( | ( | |||||||||||||||
| Transfers out | ( | ||||||||||||||||
| Foreign currency exchange rate changes | ( | ( | |||||||||||||||
| Other | ( | ( | |||||||||||||||
Fair value of plan assets at end of year4 | |||||||||||||||||
| Underfunded status at end of year | ( | ( | ( | ( | |||||||||||||
| Presented as follows: | |||||||||||||||||
| Deferred amounts and other assets | |||||||||||||||||
| Accounts payable and other | ( | ( | ( | ( | |||||||||||||
| Other long-term liabilities | ( | ( | ( | ( | |||||||||||||
| ( | ( | ( | ( | ||||||||||||||
1Primarily due to decrease in the discount rate used to measure the benefit obligations.
2Plan settlements for the Canadian Plans are related to the disposition of our federally regulated BC Field Services business.
3The accumulated benefit obligation for our Canadian pension plans was $4.5 billion and $4.0 billion as at December 31, 2020 and 2019, respectively. The accumulated benefit obligation for our US pension plans was $1.2 billion as at December 31, 2020 and 2019.
4Assets in the amount of $11 million (2019 - $10 million) and $59 million (2019 - $51 million), related to our Canadian and US non-registered supplemental pension plan obligations, are held in grantor trusts and rabbi trusts that, in accordance with federal tax regulations, are not restricted from creditors. These assets are committed for the future settlement of benefit obligations included in the underfunded status as at the end of the year, however they are excluded from plan assets for accounting purposes.
175
Certain of our pension plans have projected and accumulated benefit obligations in excess of the fair value of plan assets. For these plans, the projected benefit obligation, accumulated benefit obligation and fair value of plan assets were as follows:
| Canada | US | ||||||||||||||||
| December 31, | 2020 | 2019 | 2020 | 2019 | |||||||||||||
| (millions of Canadian dollars) | |||||||||||||||||
| Projected benefit obligation | |||||||||||||||||
| Accumulated benefit obligation | |||||||||||||||||
| Fair value of plan assets | |||||||||||||||||
Amount Recognized in Accumulated Other Comprehensive Income
The amount of pre-tax AOCI relating to our pension plans are as follows:
| Canada | US | ||||||||||||||||
| December 31, | 2020 | 2019 | 2020 | 2019 | |||||||||||||
| (millions of Canadian dollars) | |||||||||||||||||
| Net actuarial loss | |||||||||||||||||
| Prior service credit | ( | ( | |||||||||||||||
Total amount recognized in AOCI1 | |||||||||||||||||
1 Excludes amounts related to cumulative translation adjustment.
Net Periodic Benefit Cost and Other Amounts Recognized in Comprehensive Income
The components of net periodic benefit cost and other amounts recognized in pre-tax Comprehensive income related to our pension plans are as follows:
| Canada | US | |||||||||||||||||||||||||
| Year ended December 31, | 2020 | 2019 | 2018 | 2020 | 2019 | 2018 | ||||||||||||||||||||
| (millions of Canadian dollars) | ||||||||||||||||||||||||||
| Service cost | ||||||||||||||||||||||||||
Interest cost1 | ||||||||||||||||||||||||||
Expected return on plan assets1 | ( | ( | ( | ( | ( | ( | ||||||||||||||||||||
Amortization/settlement of net actuarial loss1 | ||||||||||||||||||||||||||
Amortization/curtailment of prior service (credit)/ cost1 | ( | ( | ||||||||||||||||||||||||
| Net periodic benefit cost | ( | |||||||||||||||||||||||||
| Defined contribution benefit cost | ||||||||||||||||||||||||||
| Net pension cost recognized in Earnings | ( | |||||||||||||||||||||||||
| Amount recognized in OCI: | ||||||||||||||||||||||||||
| Effect of plan combination | ( | |||||||||||||||||||||||||
| Amortization/settlement of net actuarial loss | ( | ( | ( | ( | ( | ( | ||||||||||||||||||||
Amortization/curtailment of prior service credit/(cost) | ( | |||||||||||||||||||||||||
| Net actuarial loss arising during the year | ||||||||||||||||||||||||||
| Total amount recognized in OCI | ||||||||||||||||||||||||||
| Total amount recognized in Comprehensive income | ||||||||||||||||||||||||||
1 Reported within Other income/(expense) in the Consolidated Statements of Earnings.
176
Actuarial Assumptions
The weighted average assumptions made in the measurement of the projected benefit obligation and net periodic benefit cost of our pension plans are as follows:
| Canada | US | ||||||||||||||||||||||
| 2020 | 2019 | 2018 | 2020 | 2019 | 2018 | ||||||||||||||||||
| Projected benefit obligation | |||||||||||||||||||||||
| Discount rate | % | % | % | % | % | % | |||||||||||||||||
| Rate of salary increase | % | % | % | % | % | % | |||||||||||||||||
| Cash balance interest credit rate | N/A | N/A | N/A | % | % | % | |||||||||||||||||
| Net periodic benefit cost | |||||||||||||||||||||||
| Discount rate | % | % | % | % | % | % | |||||||||||||||||
| Rate of return on plan assets | % | % | % | % | % | % | |||||||||||||||||
| Rate of salary increase | % | % | % | % | % | % | |||||||||||||||||
| Cash balance interest credit rate | N/A | N/A | N/A | % | % | % | |||||||||||||||||
OTHER POSTRETIREMENT BENEFIT PLANS
We sponsor funded and unfunded defined benefit OPEB Plans, which provide non-contributory supplemental health, dental, life and health spending account benefit coverage for certain qualifying retired employees.
177
Benefit Obligations, Plan Assets and Funded Status
The following table details the changes in the accumulated postretirement benefit obligation, the fair value of plan assets and the recorded assets or liabilities for our defined benefit OPEB plans:
| Canada | US | ||||||||||||||||
| December 31, | 2020 | 2019 | 2020 | 2019 | |||||||||||||
| (millions of Canadian dollars) | |||||||||||||||||
Change in accumulated postretirement benefit obligation | |||||||||||||||||
Accumulated postretirement benefit obligation at beginning of year | |||||||||||||||||
| Service cost | |||||||||||||||||
| Interest cost | |||||||||||||||||
| Participant contributions | |||||||||||||||||
Actuarial loss1 | |||||||||||||||||
| Benefits paid | ( | ( | ( | ( | |||||||||||||
| Plan amendments | ( | ||||||||||||||||
| Foreign currency exchange rate changes | ( | ( | |||||||||||||||
| Other | ( | ||||||||||||||||
Accumulated postretirement benefit obligation at end of year | |||||||||||||||||
| Change in plan assets | |||||||||||||||||
| Fair value of plan assets at beginning of year | |||||||||||||||||
| Actual return on plan assets | |||||||||||||||||
| Employer contributions | |||||||||||||||||
| Participant contributions | |||||||||||||||||
| Benefits paid | ( | ( | ( | ( | |||||||||||||
| Foreign currency exchange rate changes | ( | ( | |||||||||||||||
| Other | |||||||||||||||||
| Fair value of plan assets at end of year | |||||||||||||||||
| Underfunded status at end of year | ( | ( | ( | ( | |||||||||||||
| Presented as follows: | |||||||||||||||||
| Deferred amounts and other assets | |||||||||||||||||
| Accounts payable and other | ( | ( | ( | ( | |||||||||||||
| Other long-term liabilities | ( | ( | ( | ( | |||||||||||||
| ( | ( | ( | ( | ||||||||||||||
Certain of our OPEB plans have an accumulated benefit obligation in excess of the fair value of plan assets. For these plans, the accumulated benefit obligation and fair value of plan assets were as follows:
| Canada | US | ||||||||||||||||
| December 31, | 2020 | 2019 | 2020 | 2019 | |||||||||||||
| (millions of Canadian dollars) | |||||||||||||||||
| Accumulated benefit obligation | |||||||||||||||||
| Fair value of plan assets | |||||||||||||||||
178
Amount Recognized in Accumulated Other Comprehensive Income
The amount of pre-tax AOCI relating to our OPEB plans are as follows:
| Canada | US | ||||||||||||||||
| December 31, | 2020 | 2019 | 2020 | 2019 | |||||||||||||
| (millions of Canadian dollars) | |||||||||||||||||
| Net actuarial (gain)/loss | ( | ( | ( | ||||||||||||||
| Prior service credit | ( | ( | ( | ( | |||||||||||||
Total amount recognized in AOCI1 | ( | ( | ( | ||||||||||||||
1 Excludes amounts related to cumulative translation adjustment.
Net Periodic Benefit Cost and Other Amounts Recognized in Comprehensive Income
The components of net periodic benefit cost and other amounts recognized in pre-tax Comprehensive income related to our OPEB plans are as follows:
| Canada | US | ||||||||||||||||||||||
| Year ended December 31, | 2020 | 2019 | 2018 | 2020 | 2019 | 2018 | |||||||||||||||||
| (millions of Canadian dollars) | |||||||||||||||||||||||
| Service cost | |||||||||||||||||||||||
Interest cost1 | |||||||||||||||||||||||
Expected return on plan assets1 | ( | ( | ( | ||||||||||||||||||||
Amortization/settlement of net actuarial gain1 | ( | ( | ( | ( | |||||||||||||||||||
Amortization/curtailment of prior service credit1 | ( | ( | ( | ( | |||||||||||||||||||
| Net periodic benefit cost recognized in Earnings | ( | ( | ( | ||||||||||||||||||||
| Amount recognized in OCI: | |||||||||||||||||||||||
| Amortization/settlement of net actuarial gain | |||||||||||||||||||||||
Amortization/curtailment of prior service credit | |||||||||||||||||||||||
Net actuarial (gain)/loss arising during the year | ( | ( | ( | ||||||||||||||||||||
| Prior service credit | ( | ( | |||||||||||||||||||||
| Total amount recognized in OCI | ( | ( | ( | ( | |||||||||||||||||||
| Total amount recognized in Comprehensive income | ( | ( | ( | ( | |||||||||||||||||||
1 Reported within Other income/(expense) in the Consolidated Statements of Earnings.
Actuarial Assumptions
The weighted average assumptions made in the measurement of the accumulated postretirement benefit obligation and net periodic benefit cost of our OPEB plans are as follows:
| Canada | US | ||||||||||||||||||||||
| 2020 | 2019 | 2018 | 2020 | 2019 | 2018 | ||||||||||||||||||
Accumulated postretirement benefit obligation | |||||||||||||||||||||||
| Discount rate | % | % | % | % | % | % | |||||||||||||||||
| Net periodic benefit cost | |||||||||||||||||||||||
| Discount rate | % | % | % | % | % | % | |||||||||||||||||
| Rate of return on plan assets | N/A | N/A | N/A | % | % | % | |||||||||||||||||
179
Assumed Health Care Cost Trend Rates
The assumed rates for the next year used to measure the expected cost of benefits are as follows:
| Canada | US | ||||||||||||||||
| 2020 | 2019 | 2020 | 2019 | ||||||||||||||
| Health care cost trend rate assumed for next year | % | % | % | % | |||||||||||||
Rate to which the cost trend is assumed to decline (ultimate trend rate) | % | % | % | % | |||||||||||||
| Year that the rate reaches the ultimate trend rate | N/A | N/A | |||||||||||||||
PLAN ASSETS
We manage the investment risk of our pension funds by setting a long-term asset mix policy for each plan after consideration of: (i) the nature of pension plan liabilities; (ii) the investment horizon of the plan; (iii) the going concern and solvency funded status and cash flow requirements of the plan; (iv) our operating environment and financial situation and our ability to withstand fluctuations in pension contributions; and (v) the future economic and capital markets outlook with respect to investment returns, volatility of returns and correlation between assets.
The overall expected rate of return on plan assets is based on the asset allocation targets with estimates for returns based on long-term expectations.
The asset allocation targets and major categories of plan assets are as follows:
| Canada | US | ||||||||||||||||||||||
| Target | December 31, | Target | December 31, | ||||||||||||||||||||
| Asset Category | Allocation | 2020 | 2019 | Allocation | 2020 | 2019 | |||||||||||||||||
| Equity securities | % | % | % | % | % | % | |||||||||||||||||
| Fixed income securities | % | % | % | % | % | % | |||||||||||||||||
Alternatives1 | % | % | % | % | % | % | |||||||||||||||||
1Alternatives include investments in private debt, private equity, infrastructure and real estate funds.
180
Pension Plans
The following table summarizes the fair value of plan assets for our pension plans recorded at each fair value hierarchy level:
| Canada | US | ||||||||||||||||||||||||||||
Level 11 | Level 22 | Level 33 | Total | Level 11 | Level 22 | Level 33 | Total | ||||||||||||||||||||||
| (millions of Canadian dollars) | |||||||||||||||||||||||||||||
| December 31, 2020 | |||||||||||||||||||||||||||||
| Cash and cash equivalents | |||||||||||||||||||||||||||||
| Equity securities | |||||||||||||||||||||||||||||
| Canada | |||||||||||||||||||||||||||||
| US | |||||||||||||||||||||||||||||
| Global | |||||||||||||||||||||||||||||
| Fixed income securities | |||||||||||||||||||||||||||||
| Government | |||||||||||||||||||||||||||||
| Corporate | |||||||||||||||||||||||||||||
Alternatives4 | |||||||||||||||||||||||||||||
| Forward currency contracts | |||||||||||||||||||||||||||||
Total pension plan assets at fair value | |||||||||||||||||||||||||||||
| December 31, 2019 | |||||||||||||||||||||||||||||
| Cash and cash equivalents | |||||||||||||||||||||||||||||
| Equity securities | |||||||||||||||||||||||||||||
| Canada | |||||||||||||||||||||||||||||
| US | |||||||||||||||||||||||||||||
| Global | |||||||||||||||||||||||||||||
| Fixed income securities | |||||||||||||||||||||||||||||
| Government | |||||||||||||||||||||||||||||
| Corporate | |||||||||||||||||||||||||||||
Alternatives4 | |||||||||||||||||||||||||||||
| Forward currency contracts | |||||||||||||||||||||||||||||
Total pension plan assets at fair value | |||||||||||||||||||||||||||||
1Level 1 assets include assets with quoted prices in active markets for identical assets.
2Level 2 assets include assets with significant observable inputs.
3Level 3 assets include assets with significant unobservable inputs.
4Alternatives include investments in private debt, private equity, infrastructure and real estate funds. Fund values are based on the NAV of the funds that invest directly in the aforementioned underlying investments. The values of the investments have been estimated using the capital accounts representing the plan's ownership interest in the funds.
Changes in the net fair value of pension plan assets classified as Level 3 in the fair value hierarchy were as follows:
| Canada | US | ||||||||||||||||
| December 31, | 2020 | 2019 | 2020 | 2019 | |||||||||||||
| (millions of Canadian dollars) | |||||||||||||||||
| Balance at beginning of year | |||||||||||||||||
| Unrealized and realized gains/(losses) | ( | ||||||||||||||||
| Purchases and settlements, net | |||||||||||||||||
| Balance at end of year | |||||||||||||||||
181
OPEB Plans
The following table summarizes the fair value of plan assets for our OPEB plans recorded at each fair value hierarchy level:
| Canada | US | ||||||||||||||||||||||||||||
Level 11 | Level 22 | Level 33 | Total | Level 11 | Level 22 | Level 33 | Total | ||||||||||||||||||||||
| (millions of Canadian dollars) | |||||||||||||||||||||||||||||
| December 31, 2020 | |||||||||||||||||||||||||||||
| Equity securities | |||||||||||||||||||||||||||||
| US | |||||||||||||||||||||||||||||
| Global | |||||||||||||||||||||||||||||
| Fixed income securities | |||||||||||||||||||||||||||||
| Government | |||||||||||||||||||||||||||||
| Corporate | |||||||||||||||||||||||||||||
Alternatives4 | |||||||||||||||||||||||||||||
Total OPEB plan assets at fair value | |||||||||||||||||||||||||||||
| December 31, 2019 | |||||||||||||||||||||||||||||
| Cash and cash equivalents | |||||||||||||||||||||||||||||
| Equity securities | |||||||||||||||||||||||||||||
| US | |||||||||||||||||||||||||||||
| Global | |||||||||||||||||||||||||||||
| Fixed income securities | |||||||||||||||||||||||||||||
| Government | |||||||||||||||||||||||||||||
Alternatives4 | |||||||||||||||||||||||||||||
Total OPEB plan assets at fair value | |||||||||||||||||||||||||||||
1Level 1 assets include assets with quoted prices in active markets for identical assets.
2Level 2 assets include assets with significant observable inputs.
3Level 3 assets include assets with significant unobservable inputs.
4Alternatives includes investments in private debt, private equity, infrastructure and real estate.
Changes in the net fair value of OPEB plan assets classified as Level 3 in the fair value hierarchy were as follows:
| Canada | US | ||||||||||||||||
| December 31, | 2020 | 2019 | 2020 | 2019 | |||||||||||||
| (millions of Canadian dollars) | |||||||||||||||||
| Balance at beginning of year | |||||||||||||||||
| Unrealized and realized gains | |||||||||||||||||
| Purchases and settlements, net | |||||||||||||||||
| Balance at end of year | |||||||||||||||||
EXPECTED BENEFIT PAYMENTS
| Year ending December 31, | 2021 | 2022 | 2023 | 2024 | 2025 | 2026-2030 | ||||||||||||||
| (millions of Canadian dollars) | ||||||||||||||||||||
| Pension | ||||||||||||||||||||
Canada | ||||||||||||||||||||
| US | ||||||||||||||||||||
| OPEB | ||||||||||||||||||||
Canada | ||||||||||||||||||||
| US | ||||||||||||||||||||
EXPECTED EMPLOYER CONTRIBUTIONS
In 2021, we expect to contribute approximately $102 million and $49 million to the Canadian and US pension plans, respectively, and $12 million and $7 million to the Canadian and US OPEB plans, respectively.
182
RETIREMENT SAVINGS PLANS
In addition to the pension and OPEB plans discussed above, we also have defined contribution employee savings plans available to both Canadian and US employees. Employees may participate in a matching contribution where we match a certain percentage of before-tax employee contributions of up to 2.5 % and 6.0 % of eligible pay per pay period for Canadian and US employees, respectively. For the years ended December 31, 2020, 2019 and 2018, pre-tax employer matching contribution costs were nil , $4 million and $13 million, respectively, for Canadian employees and $27 million each year for US employees.
27. LEASES
LESSEE
We incur operating lease expenses related primarily to real estate, pipelines, storage and equipment. Our operating leases have remaining lease terms of 1 month to 35 years as at December 31, 2020.
For the years ended December 31, 2020 and 2019, we incurred operating lease expenses of $107 million and $113 million, respectively. Operating lease expenses are reported under Operating and administrative expenses on the Consolidated Statements of Earnings.
For the years ended December 31, 2020 and 2019, operating lease payments to settle lease liabilities were $133 million and $123 million, respectively. Operating lease payments are reported under operating activities in the Consolidated Statements of Cash Flows.
Supplemental Statements of Financial Position Information
| December 31, 2020 | December 31, 2019 | |||||||
| (millions of Canadian dollars, except lease term and discount rate) | ||||||||
| Operating leases | ||||||||
Operating lease right-of-use assets, net1 | ||||||||
Operating lease liabilities - current2 | ||||||||
| Total operating lease liabilities | ||||||||
| Finance leases | ||||||||
Finance lease right-of-use assets, net1 | ||||||||
Finance lease liabilities - current2 | ||||||||
| Total finance lease liabilities | ||||||||
| Weighted average remaining lease term | ||||||||
| Operating leases | ||||||||
| Finance leases | ||||||||
| Weighted average discount rate | ||||||||
| Operating leases | % | % | ||||||
| Finance leases | % | % | ||||||
1Right-of-use assets are reported under Deferred amounts and other assets in the Consolidated Statements of Financial Position.
2Current lease liabilities are reported under Accounts payable and other in the Consolidated Statements of Financial Position.
3Long-term lease liabilities are reported under Other long-term liabilities in the Consolidated Statements of Financial Position.
183
As at December 31, 2020, our operating and finance lease liabilities are expected to mature as follows:
| Operating leases | Finance leases | |||||||
| (millions of Canadian dollars) | ||||||||
| 2021 | ||||||||
| 2022 | ||||||||
| 2023 | ||||||||
| 2024 | ||||||||
| 2025 | ||||||||
| Thereafter | ||||||||
| Total undiscounted lease payments | ||||||||
| Less imputed interest | ( | ( | ||||||
| Total | ||||||||
LESSOR
We receive revenues from operating leases primarily related to natural gas and crude oil storage and processing facilities, rail cars, and wind power generation assets. Our operating leases have remaining lease terms of 1 month to 23 years as at December 31, 2020.
| Year ended December 31, | 2020 | 2019 | ||||||
| (millions of Canadian dollars) | ||||||||
| Operating lease income | ||||||||
| Variable lease income | ||||||||
Total lease income1 | ||||||||
1Lease income is recorded under Transportation and other services in the Consolidated Statements of Earnings.
As at December 31, 2020, the following table sets out future lease payments to be received under operating lease contracts where we are the lessor:
| Operating leases | |||||
| (millions of Canadian dollars) | |||||
| 2021 | |||||
| 2022 | |||||
| 2023 | |||||
| 2024 | |||||
| 2025 | |||||
| Thereafter | |||||
| Future lease payments | |||||
28. CHANGES IN OPERATING ASSETS AND LIABILITIES
| Year ended December 31, | 2020 | 2019 | 2018 | ||||||||
| (millions of Canadian dollars) | |||||||||||
| Accounts receivable and other | ( | ||||||||||
| Accounts receivable from affiliates | |||||||||||
| Inventory | ( | ( | |||||||||
| Deferred amounts and other assets | ( | ||||||||||
| Accounts payable and other | ( | ( | |||||||||
| Accounts payable to affiliates | ( | ( | |||||||||
| Interest payable | ( | ||||||||||
| Other long-term liabilities | ( | ||||||||||
| ( | |||||||||||
184
29. RELATED PARTY TRANSACTIONS
Related party transactions are conducted in the normal course of business and unless otherwise noted, are measured at the exchange amount, which is the amount of consideration established and agreed to by the related parties.
Our transactions with significantly influenced investees are as follows:
| Year ended December 31, 2020 | Transportation and Other Services | Operating and Administrative | Commodity Sales | Commodity Costs | Gas Distribution costs | ||||||||||||
| (millions of Canadian dollars) | |||||||||||||||||
| Alliance Pipeline Limited | |||||||||||||||||
| Aux Sable Midstream LLC | |||||||||||||||||
| Aux Sable Canada LP | |||||||||||||||||
| Seaway Crude Pipeline System | |||||||||||||||||
| Alliance Canada Marketing L.P. | |||||||||||||||||
| NEXUS Gas Transmission, LLC | |||||||||||||||||
| Vector Pipeline L.P. | |||||||||||||||||
| Énergir, L.P. | |||||||||||||||||
| DCP Midstream, LLC | |||||||||||||||||
| Gulfstream Management and Operating Services, LLC | |||||||||||||||||
| Sabal Trail Transmission, LLC | |||||||||||||||||
| Steckman Ridge | |||||||||||||||||
| Noverco | |||||||||||||||||
| Year ended December 31, 2019 | Transportation and Other Services | Operating and Administrative | Commodity Sales | Commodity Costs | Gas Distribution costs | ||||||||||||
| (millions of Canadian dollars) | |||||||||||||||||
| Alliance Pipeline Limited | |||||||||||||||||
| Aux Sable Midstream LLC | |||||||||||||||||
| Aux Sable Canada LP | |||||||||||||||||
| Seaway Crude Pipeline System | |||||||||||||||||
| Alliance Canada Marketing L.P. | |||||||||||||||||
| NEXUS Gas Transmission, LLC | |||||||||||||||||
| Vector Pipeline L.P. | |||||||||||||||||
| Énergir, L.P. | |||||||||||||||||
| DCP Midstream, LLC | |||||||||||||||||
| Gulfstream Management and Operating Services, LLC | |||||||||||||||||
| Sabal Trail Transmission, LLC | |||||||||||||||||
| Steckman Ridge | |||||||||||||||||
185
| Year ended December 31, 2018 | Transportation and Other Services | Operating and Administrative | Commodity Sales | Commodity Costs | Gas Distribution costs | ||||||||||||
| (millions of Canadian dollars) | |||||||||||||||||
| Alliance Pipeline Limited | |||||||||||||||||
| Aux Sable Midstream LLC | |||||||||||||||||
| Aux Sable Canada LP | |||||||||||||||||
| Seaway Crude Pipeline System | |||||||||||||||||
| Alliance Canada Marketing L.P. | |||||||||||||||||
| NEXUS Gas Transmission, LLC | |||||||||||||||||
| Vector Pipeline L.P. | |||||||||||||||||
| DCP Midstream, LLC | |||||||||||||||||
| Gulfstream Management and Operating Services, LLC | |||||||||||||||||
| Sabal Trail Transmission, LLC | |||||||||||||||||
| Steckman Ridge | |||||||||||||||||
LONG-TERM NOTES RECEIVABLE FROM AFFILIATES
As at December 31, 2020, amounts receivable from affiliates include a series of loans totaling $1,108 million ($1,023 million as at December 31, 2019), which require quarterly or semi-annual interest payments at annual interest rates ranging from 3 % to 8 %. These amounts are included in deferred amounts and other assets in the Consolidated Statements of Financial position.
30. COMMITMENTS AND CONTINGENCIES
COMMITMENTS
At December 31, 2020, we have commitments as detailed below:
| Total | Less than 1 year | 2 years | 3 years | 4 years | 5 years | Thereafter | |||||||||||||||||
| (millions of Canadian dollars) | |||||||||||||||||||||||
Annual debt maturities1 | |||||||||||||||||||||||
Interest obligations2 | |||||||||||||||||||||||
Purchase of services, pipe and other materials, including transportation3,4 | |||||||||||||||||||||||
| Maintenance agreements | |||||||||||||||||||||||
| Right-of-ways commitments | |||||||||||||||||||||||
| Total | |||||||||||||||||||||||
1Includes debentures, term notes, commercial paper and credit facility draws based on the facility's maturity date and excludes short-term borrowings, debt discount, debt issue costs, finance lease obligations and fair value adjustment. We have the ability under certain debt facilities to call and repay the obligations prior to scheduled maturities. Therefore, the actual timing of future cash repayments could be materially different than presented above.
2Includes debentures and term notes bearing interest at fixed, floating and fixed-to-floating rates.
3Includes capital and operating commitments.
4Consists primarily of gas transportation and storage contracts, firm capacity payments and gas purchase commitments, transportation, service and product purchase obligations, and power commitments.
ENVIRONMENTAL
We are subject to various Canadian and US federal, state and local laws relating to the protection of the environment. These laws and regulations can change from time to time, imposing new obligations on us.
186
Environmental risk is inherent to liquid hydrocarbon and natural gas pipeline operations, and Enbridge and our affiliates are, at times, subject to environmental remediation obligations at various sites where we operate. We manage this environmental risk through appropriate environmental policies, programs and practices to minimize any impact our operations may have on the environment. To the extent that we are unable to recover payment for environmental liabilities from insurance or other potentially responsible parties, we will be responsible for payment of costs arising from environmental incidents associated with the operating activities of our liquids and natural gas businesses.
AUX SABLE
On October 14, 2016, an amended claim was filed against Aux Sable by a counterparty to an NGL supply agreement. On January 5, 2017, Aux Sable filed a Statement of Defence with respect to this claim.
On November 27, 2019, the counterparty filed an amended amended claim providing further particulars of its claim against Aux Sable, increasing its damages claimed, and adding defendants Aux Sable Liquid Products Inc. and Aux Sable Extraction LLC (general partners of the previously existing defendants). Aux Sable filed an amended Statement of Defence responding to the amended amended claim on January 31, 2020.
While the final outcome of this action cannot be predicted with certainty, at this time management believes that the ultimate resolution of this action will not have a material impact on our consolidated financial position or results of operations.
TAX MATTERS
We and our subsidiaries maintain tax liabilities related to uncertain tax positions. While fully supportable in our view, these tax positions, if challenged by tax authorities, may not be fully sustained on review.
OTHER LITIGATION
We and our subsidiaries are subject to various other legal and regulatory actions and proceedings which arise in the normal course of business, including interventions in regulatory proceedings and challenges to regulatory approvals and permits. While the final outcome of such actions and proceedings cannot be predicted with certainty, management believes that the resolution of such actions and proceedings will not have a material impact on our consolidated financial position or results of operations.
31. GUARANTEES
In the normal course of conducting business, we may enter into agreements which indemnify third parties and affiliates. We may also be a party to agreements with subsidiaries, jointly owned entities, unconsolidated entities such as equity method investees, or entities with other ownership arrangements that require us to provide financial and performance guarantees. Financial guarantees include stand-by letters of credit, debt guarantees, surety bonds and indemnifications. To varying degrees, these guarantees involve elements of performance and credit risk, which are not included on our Consolidated Statements of Financial Position. Performance guarantees require us to make payments to a third party if the guaranteed entity does not perform on its contractual obligations, such as debt agreements, purchase or sale agreements, and construction contracts and leases.
187
We typically enter into these arrangements to facilitate commercial transactions with third parties. Examples include indemnifying counterparties pursuant to sale agreements for assets or businesses in matters such as breaches of representations, warranties or covenants, loss or damages to property, environmental liabilities, and litigation and contingent liabilities. We may indemnify third parties for certain liabilities relating to environmental matters arising from operations prior to the purchase or transfer of certain assets and interests. Similarly, we may indemnify the purchaser of assets for certain tax liabilities incurred while we owned the assets, a misrepresentation related to taxes that result in a loss to the purchaser or other certain tax liabilities related to those assets.
The likelihood of having to perform under these guarantees and indemnifications is largely dependent upon future operations of various subsidiaries, investees and other third parties, or the occurrence of certain future events. We cannot reasonably estimate the total maximum potential amounts that could become payable to third parties and affiliates under such agreements described above; however, historically, we have not made any significant payments under guarantee or indemnification provisions. While these agreements may specify a maximum potential exposure, or a specified duration to the guarantee or indemnification obligation, there are circumstances where the amount and duration are unlimited. As at December 31, 2020 guarantees and indemnifications have not had, and are not reasonably likely to have, a material effect on our financial condition, changes in financial condition, earnings, liquidity, capital expenditures or capital resources.
32. QUARTERLY FINANCIAL DATA (UNAUDITED)
| Q1 | Q2 | Q3 | Q4 | Total | |||||||||||||
| (unaudited; millions of Canadian dollars, except per share amounts) | |||||||||||||||||
| 2020 | |||||||||||||||||
| Operating revenues | |||||||||||||||||
| Operating income | |||||||||||||||||
| Earnings/(loss) | ( | ||||||||||||||||
| Earnings/(loss) attributable to controlling interests | ( | ||||||||||||||||
| Earnings/(loss) attributable to common shareholders | ( | ||||||||||||||||
| Earnings/(loss) per common share | |||||||||||||||||
| Basic | ( | ||||||||||||||||
| Diluted | ( | ||||||||||||||||
| 2019 | |||||||||||||||||
| Operating revenues | |||||||||||||||||
| Operating income | |||||||||||||||||
| Earnings | |||||||||||||||||
Earnings attributable to controlling interests | |||||||||||||||||
Earnings attributable to common shareholders | |||||||||||||||||
| Earnings per common share | |||||||||||||||||
| Basic | |||||||||||||||||
| Diluted | |||||||||||||||||
188
ITEM 9. CHANGES IN AND DISAGREEMENTS WITH ACCOUNTANTS ON ACCOUNTING AND FINANCIAL DISCLOSURE
None.
ITEM 9A. CONTROLS AND PROCEDURES
DISCLOSURE CONTROLS AND PROCEDURES
Disclosure controls and procedures are designed to provide reasonable assurance that information required to be disclosed in reports filed with, or submitted to, securities regulatory authorities is recorded, processed, summarized and reported within the time periods specified under Canadian and US securities law. As at December 31, 2020, an evaluation was carried out under the supervision of and with the participation of our management, including the Chief Executive Officer and Chief Financial Officer, of the effectiveness of the design and operations of our disclosure controls and procedures (as defined in Rule 13a-15(e) and 15d-15(e) under the Securities Exchange Act of 1934). Based on that evaluation, the Chief Executive Officer and Chief Financial Officer concluded that the design and operation of these disclosure controls and procedures were effective in ensuring that information required to be disclosed by us in reports that we file with or submit to the SEC and the Canadian Securities Administrators is recorded, processed, summarized and reported within the time periods required.
INTERNAL CONTROL OVER FINANCIAL REPORTING
Management’s Annual Report on Internal Control over Financial Reporting
Our management is responsible for establishing and maintaining adequate internal control over financial reporting as such term is defined in the rules of the SEC and the Canadian Securities Administrators. Our internal control over financial reporting is a process designed under the supervision and with the participation of executive and financial officers to provide reasonable assurance regarding the reliability of financial reporting and the preparation of our financial statements for external reporting purposes in accordance with US GAAP.
Our internal control over financial reporting includes policies and procedures that:
•pertain to the maintenance of records that, in reasonable detail, accurately and fairly reflect transactions and dispositions of our assets;
•provide reasonable assurance that transactions are recorded as necessary to permit preparation of financial statements in accordance with US GAAP; and
•provide reasonable assurance regarding prevention or timely detection of unauthorized acquisition, use or disposition of our assets that could have a material effect on the financial statements.
Our internal control over financial reporting may not prevent or detect all misstatements because of inherent limitations. Additionally, projections of any evaluation of effectiveness to future periods are subject to the risk that controls may become inadequate because of changes in conditions or deterioration in the degree of compliance with our policies and procedures.
Our management assessed the effectiveness of our internal control over financial reporting as at December 31, 2020, based on the framework established in Internal Control – Integrated Framework (2013) issued by the Committee of Sponsoring Organizations of the Treadway Commission. Based on this assessment, our management concluded that we maintained effective internal control over financial reporting as at December 31, 2020.
189
The effectiveness of our internal control over financial reporting as at December 31, 2020 has been audited by PricewaterhouseCoopers LLP, independent auditors appointed by our shareholders. As stated in their Report of Independent Registered Public Accounting Firm which appears in Item 8. Financial Statements and Supplementary Data, they expressed an unqualified opinion on the effectiveness of our internal control over financial reporting as at December 31, 2020.
Changes in Internal Control Over Financial Reporting
During the three months ended December 31, 2020, there has been no material change in our internal control over financial reporting.
ITEM 9B. OTHER INFORMATION
None.
190
PART III
ITEM 10. DIRECTORS, EXECUTIVE OFFICERS AND CORPORATE GOVERNANCE
Directors of Registrant
The information required by this Item will be contained in our Form 10-K/A, which will be filed no later than 120 days after December 31, 2020. This information will also be contained in the management proxy information that we prepare in accordance with Canadian corporate and securities law requirements.
Executive Officers of Registrant
The information regarding executive officers is included in Part I. Item 1. Business - Executive Officers.
Code of Ethics for Chief Executive Officer and Senior Financial Officers
The information required by this Item will be contained in our Form 10-K/A, which will be filed no later than 120 days after December 31, 2020. This information will also be contained in the management proxy information that we prepare in accordance with Canadian corporate and securities law requirements.
ITEM 11. EXECUTIVE COMPENSATION
The information required by this Item will be contained in our Form 10-K/A, which will be filed no later than 120 days after December 31, 2020. This information will also be contained in the management proxy information that we prepare in accordance with Canadian corporate and securities law requirements.
ITEM 12. SECURITY OWNERSHIP OF CERTAIN BENEFICIAL OWNERS AND MANAGEMENT AND RELATED STOCKHOLDER MATTERS
The information required by this Item will be contained in our Form 10-K/A, which will be filed no later than 120 days after December 31, 2020. This information will also be contained in the management proxy information that we prepare in accordance with Canadian corporate and securities law requirements.
ITEM 13. CERTAIN RELATIONSHIPS AND RELATED TRANSACTIONS, AND DIRECTOR INDEPENDENCE
The information required by this Item will be contained in our Form 10-K/A, which will be filed no later than 120 days after December 31, 2020. This information will also be contained in the management proxy information that we prepare in accordance with Canadian corporate and securities law requirements.
ITEM 14. PRINCIPAL ACCOUNTING FEES AND SERVICES
The information required by this Item will be contained in our Form 10-K/A, which will be filed no later than 120 days after December 31, 2020. This information will also be contained in the management proxy information that we prepare in accordance with Canadian corporate and securities law requirements.
191
PART IV
ITEM 15. EXHIBITS AND FINANCIAL STATEMENT SCHEDULES
(a) Consolidated Financial Statements, Supplemental Financial Data and Supplemental Schedules included in Part II of this annual report are as follows:
Enbridge Inc.:
Report of Independent Registered Public Accounting Firm
Consolidated Statements of Earnings
Consolidated Statements of Comprehensive Income
Consolidated Statements of Changes in Equity
Consolidated Statements of Cash Flows
Consolidated Statements of Financial Position
Notes to the Consolidated Financial Statements
All schedules are omitted because they are not required or because the required information is included in the Consolidated Financial Statements or Notes.
(b) Exhibits:
Reference is made to the “Index of Exhibits” following Item 16. Form 10-K Summary, which is hereby incorporated into this Item.
ITEM 16. FORM 10-K SUMMARY
None.
192
INDEX OF EXHIBITS
Each exhibit identified below is included as a part of this annual report. Exhibits included in this filing are designated by an asterisk (“*”); all exhibits not so designated are incorporated by reference to a prior filing as indicated. Exhibits designated with a “+” constitute a management contract or compensatory plan arrangement.
| Exhibit No. | Name of Exhibit | |||||||
| 3.1 | Articles of Continuance of the Corporation, dated December 15, 1987 (incorporated by reference to Exhibit 2.1(a) to Enbridge’s Registration Statement on Form S-8 filed May 7, 2001) | |||||||
| 3.2 | Certificate of Amendment, dated August 2, 1989, to the Articles of the Corporation (incorporated by reference to Exhibit 2.1(b) to Enbridge’s Registration Statement on Form S-8 filed May 7, 2001) | |||||||
| 3.3 | Articles of Amendment of the Corporation, dated April 30, 1992 (incorporated by reference to Exhibit 2.1(c) to Enbridge’s Registration Statement on Form S-8 filed May 7, 2001) | |||||||
| 3.4 | Articles of Amendment of the Corporation, dated July 2, 1992 (incorporated by reference to Exhibit 2.1(d) to Enbridge’s Registration Statement on Form S-8 filed May 7, 2001) | |||||||
| 3.5 | Articles of Amendment of the Corporation, dated August 6, 1992 (incorporated by reference to Exhibit 2.1(e) to Enbridge’s Registration Statement on Form S-8 filed May 7, 2001) | |||||||
| 3.6 | Articles of Arrangement of the Corporation dated December 18, 1992, attaching the Arrangement Agreement, dated December 15, 1992 (incorporated by reference to Exhibit 2.1(f) to Enbridge’s Registration Statement on Form S-8 filed May 7, 2001) | |||||||
193
| 3.7 | Certificate of Amendment of the Corporation (notarial certified copy), dated December 18, 1992 (incorporated by reference to Exhibit 2.1(g) to Enbridge’s Registration Statement on Form S-8 filed May 7, 2001) | |||||||
| 3.8 | Articles of Amendment of the Corporation, dated May 5, 1994 (incorporated by reference to Exhibit 2.1(h) to Enbridge’s Registration Statement on Form S-8 filed May 7, 2001) | |||||||
| 3.9 | Certificate of Amendment, dated October 7, 1998 (incorporated by reference to Exhibit 2.1(i) to Enbridge’s Registration Statement on Form S-8 filed May 7, 2001) | |||||||
| 3.10 | Certificate of Amendment, dated November 24, 1998 (incorporated by reference to Exhibit 2.1(j) to Enbridge’s Registration Statement on Form S-8 filed May 7, 2001) | |||||||
| 3.11 | Certificate of Amendment, dated April 29, 1999 (incorporated by reference to Exhibit 2.1(k) to Enbridge’s Registration Statement on Form S-8 filed May 7, 2001) | |||||||
194
| * | ||||||||
195
| Certain instruments defining the rights of holders of long-term debt securities of the Registrant and its subsidiaries are omitted pursuant to Item 601(b)(4)(iii) of Regulation S-K. The Registrant hereby undertakes to furnish to the SEC, upon request, copies of any such instruments. | ||||||||
| + | ||||||||
| + | ||||||||
| + | ||||||||
| + | ||||||||
| + | ||||||||
| + | ||||||||
| + | ||||||||
| + | ||||||||
196
| + | ||||||||
| + | ||||||||
| + | ||||||||
| + | ||||||||
| + | ||||||||
| + | ||||||||
| + | ||||||||
| + | ||||||||
| + | ||||||||
| + | ||||||||
| + | ||||||||
| + | ||||||||
| + | ||||||||
| + | ||||||||
| + | ||||||||
| + | ||||||||
| + | ||||||||
| + | ||||||||
197
| + | ||||||||
| + | ||||||||
| + | ||||||||
| + | ||||||||
| + | ||||||||
| + | ||||||||
| + | ||||||||
| + | ||||||||
| + | ||||||||
| + | ||||||||
| + | ||||||||
| + | ||||||||
| + | ||||||||
| + | ||||||||
| + | ||||||||
| * | ||||||||
| * | ||||||||
| * | ||||||||
| * | ||||||||
198
| * | ||||||||
| * | ||||||||
| * | ||||||||
| 101 | * | Inline XBRL Document Set for the consolidated financial statements and accompanying notes in Part II, Item 8 “Financial Statements and Supplementary Data” of this Annual Report on Form 10-K | ||||||
| 104 | * | Cover Page Interactive Date File – the cover page XBRL tags are embedded within the Inline XBRL document (included in Exhibit 101). | ||||||
199
SIGNATURES
POWER OF ATTORNEY
Each person whose signature appears below appoints Robert R. Rooney, Colin K. Gruending and Karen K. L. Uehara, and each of them, any of whom may act without the joinder of the other, as their true and lawful attorneys-in-fact and agents, with full power of substitution, for him or her and in his or her name, place and stead, in any and all capacities, to sign any and all amendments to this Annual Report of Enbridge on Form 10-K, and to file the same, with all exhibits thereto, and all other documents in connection therewith, with the Securities and Exchange Commission, granting unto said attorneys-in-fact and agents, and each of them, full power and authority to do and perform each and every act and thing requisite and necessary to be done, as fully to all intents and purposes as he or she might or would do in person, hereby ratifying and confirming all that said attorneys-in-fact and agents or any of them or their or his or her substitute and substitutes, may lawfully do or cause to be done by virtue hereof.
Pursuant to the requirements of Section 13 or 15(d) of the Securities Exchange Act of 1934, the registrant has duly caused this report to be signed on its behalf by the undersigned, thereunto duly authorized.
| ENBRIDGE INC. | |||||||||||
| (Registrant) | |||||||||||
| Date: | February 12, 2021 | By: | /s/ Al Monaco | ||||||||
| Al Monaco | |||||||||||
| President and Chief Executive Officer | |||||||||||
Pursuant to the requirements of the Securities Exchange Act of 1934, this report has been signed below on February 12, 2021 by the following persons on behalf of the registrant and in the capacities indicated.
200
| /s/ Al Monaco | /s/ Colin K. Gruending | |||||||
Al Monaco President, Chief Executive Officer and Director (Principal Executive Officer) | Colin K. Gruending Executive Vice President and Chief Financial Officer (Principal Financial Officer) | |||||||
| /s/ Patrick R. Murray | /s/ Gregory L. Ebel | |||||||
Patrick R. Murray Senior Vice President and Chief Accounting Officer (Principal Accounting Officer) | Gregory L. Ebel Chairman of the Board of Directors | |||||||
| /s/ Pamela L. Carter | /s/ Marcel R. Coutu | |||||||
Pamela L. Carter Director | Marcel R. Coutu Director | |||||||
| /s/ Susan M. Cunningham | /s/ J. Herb England | |||||||
Susan M. Cunningham Director | J. Herb England Director | |||||||
| /s/ Gregory J. Goff | /s/ V. Maureen Kempston Darkes | |||||||
| Gregory J. Goff Director | V. Maureen Kempston Darkes Director | |||||||
| /s/ Teresa S. Madden | /s/ Stephen S. Poloz | |||||||
| Teresa S. Madden Director | Stephen S. Poloz Director | |||||||
| /s/ Dan C. Tutcher | ||||||||
| Dan C. Tutcher Director | ||||||||
201