Enbridge Inc. filed this Form 10-K on 2/13/2026
10-K
false0000895728FYhttp://fasb.org/srt/2025#ChiefExecutiveOfficerMember http://fasb.org/srt/2025#PresidentMember33.3333.33http://fasb.org/us-gaap/2025#AccountingStandardsUpdate202309Memberhttp://fasb.org/us-gaap/2025#Revenueshttp://fasb.org/us-gaap/2025#Revenueshttp://fasb.org/us-gaap/2025#Revenues3 yearsfive yearsfive yearsDecember 31, 2027December 31, 2049December 31, 2027December 31, 2030December 31, 2027December 31, 2027July 31, 2027July 31, 2030July 31, 2028July 31, 2027July 31, 2027December 31, 2027December 31, 2049UnlimitedUnlimitedUnlimited1.51.5http://fasb.org/us-gaap/2025#OtherAssetsCurrenthttp://fasb.org/us-gaap/2025#DeferredCostsAndOtherAssetshttp://fasb.org/us-gaap/2025#OtherLiabilitiesCurrenthttp://fasb.org/us-gaap/2025#OtherLiabilitiesNoncurrenthttp://fasb.org/us-gaap/2025#OtherAssetsCurrenthttp://fasb.org/us-gaap/2025#DeferredCostsAndOtherAssetshttp://fasb.org/us-gaap/2025#OtherLiabilitiesCurrenthttp://fasb.org/us-gaap/2025#OtherLiabilitiesNoncurrenthttp://fasb.org/us-gaap/2025#ProfitLosshttp://fasb.org/us-gaap/2025#ProfitLosshttp://fasb.org/us-gaap/2025#OtherComprehensiveIncomeLossNetOfTaxhttp://fasb.org/us-gaap/2025#OtherComprehensiveIncomeLossNetOfTaxhttp://fasb.org/us-gaap/2025#OtherAssetsCurrenthttp://fasb.org/us-gaap/2025#LongTermInvestmentshttp://fasb.org/us-gaap/2025#DeferredCostsAndOtherAssetshttp://fasb.org/us-gaap/2025#DeferredCostsAndOtherAssetshttp://fasb.org/us-gaap/2025#AccountsPayableAndOtherAccruedLiabilitiesCurrenthttp://fasb.org/us-gaap/2025#AccountsPayableAndOtherAccruedLiabilitiesCurrenthttp://fasb.org/us-gaap/2025#OtherLiabilitiesNoncurrenthttp://fasb.org/us-gaap/2025#OtherLiabilitiesNoncurrenthttp://fasb.org/us-gaap/2025#PropertyPlantAndEquipmentAndFinanceLeaseRightOfUseAssetAfterAccumulatedDepreciationAndAmortizationhttp://fasb.org/us-gaap/2025#PropertyPlantAndEquipmentAndFinanceLeaseRightOfUseAssetAfterAccumulatedDepreciationAndAmortizationhttp://fasb.org/us-gaap/2025#LongTermDebtAndCapitalLeaseObligationsCurrenthttp://fasb.org/us-gaap/2025#LongTermDebtAndCapitalLeaseObligationsCurrenthttp://fasb.org/us-gaap/2025#OtherLiabilitiesNoncurrenthttp://fasb.org/us-gaap/2025#OtherLiabilitiesNoncurrenthttp://fasb.org/us-gaap/2025#LeaseIncomehttp://fasb.org/us-gaap/2025#LeaseIncomehttp://fasb.org/us-gaap/2025#LeaseIncome0000895728us-gaap:TransferredOverTimeMemberenb:GasDistributionandStorageSegmentMember2025-01-012025-12-310000895728us-gaap:OperatingSegmentsMemberenb:LiquidsPipelinesSegmentMember2024-01-012024-12-310000895728enb:OtherEquityInvesteeMemberus-gaap:InvesteeMember2025-12-310000895728us-gaap:ForeignPlanMember2024-12-310000895728us-gaap:SeniorNotesMemberenb:AlgonquinGasTransmissionLLCMember2025-12-310000895728stpr:CA-ON2025-01-012025-12-310000895728country:US2024-01-012024-12-310000895728us-gaap:DesignatedAsHedgingInstrumentMemberus-gaap:ForeignExchangeContractMemberenb:DeferredAmountsAndOtherMemberus-gaap:FairValueHedgingMember2025-12-310000895728enb:GasTransmissionSegmentMemberus-gaap:InvesteeMemberenb:VectorPipelineMember2025-12-310000895728us-gaap:DesignatedAsHedgingInstrumentMemberus-gaap:CommodityContractMemberus-gaap:FairValueHedgingMember2024-12-310000895728enb:GasDistributionSalesMembersrt:ConsolidationEliminationsMember2023-01-012023-12-310000895728us-gaap:PensionPlansDefinedBenefitMembercountry:CA2024-01-012024-12-310000895728srt:ConsolidationEliminationsMember2025-01-012025-12-310000895728us-gaap:SeriesCPreferredStockMemberus-gaap:PreferredStockMemberenb:Three-MonthGovernmentOfCanadaTreasuryBillMember2025-12-310000895728us-gaap:NondesignatedMember2024-12-310000895728enb:RenewablePowerGenerationSegmentMemberenb:GasDistributionSalesMemberus-gaap:OperatingSegmentsMember2023-01-012023-12-310000895728us-gaap:AccumulatedGainLossNetCashFlowHedgeParentMember2022-12-310000895728enb:EuropeanFinancialInstitutionsMemberus-gaap:DerivativeMember2025-01-012025-12-310000895728us-gaap:PensionPlansDefinedBenefitMemberenb:DefinedBenefitPlanAlternativesMemberus-gaap:FairValueInputsLevel1Membercountry:CA2025-12-310000895728us-gaap:InterestRateContractMemberus-gaap:AccumulatedGainLossNetCashFlowHedgeParentMember2024-01-012024-12-310000895728us-gaap:ForeignPlanMemberus-gaap:OtherPostretirementBenefitPlansDefinedBenefitMember2023-01-012023-12-310000895728us-gaap:ForeignExchangeContractMemberenb:DeferredAmountsAndOtherMember2024-12-310000895728us-gaap:NondesignatedMemberus-gaap:CommodityContractMember2024-01-012024-12-310000895728us-gaap:AccumulatedNetUnrealizedInvestmentGainLossMember2023-12-310000895728enb:SeniorNotesDueJune2055Memberenb:TheEastOhioGasCompanyEOGMember2025-06-300000895728enb:A480SeniorNotesNoteThreeMemberenb:EnbridgeHoldingsTomorrowRNGLLCMember2025-12-310000895728us-gaap:OperatingSegmentsMemberenb:TransportationRevenueMemberenb:GasTransmissionSegmentMember2025-01-012025-12-310000895728us-gaap:OperatingSegmentsMemberenb:GasDistributionandStorageSegmentMember2025-01-012025-12-310000895728us-gaap:AccumulatedOtherComprehensiveIncomeMember2022-12-310000895728enb:QuestarGasCompanyMember2024-05-312024-05-310000895728enb:WhistlerParentJVMemberus-gaap:InvesteeMemberenb:RioBravoMember2024-05-290000895728enb:CommercialPaperAndCreditFacilityDrawsMembersrt:ParentCompanyMember2024-12-310000895728srt:ParentCompanyMemberenb:Medium-TermNotesDueAugust2054Member2025-02-280000895728enb:DeferredAmountsAndOtherMemberus-gaap:CommodityContractMember2025-12-310000895728enb:EnbridgeGasInc.Memberenb:FinanceLeaseObligationsMember2024-12-310000895728enb:USFinancialInstitutionsMemberus-gaap:DerivativeMember2024-01-012024-12-310000895728us-gaap:PreferredStockMember2024-01-012024-12-310000895728us-gaap:ForeignCountryMembercountry:US2025-01-012025-12-310000895728us-gaap:DesignatedAsHedgingInstrumentMemberus-gaap:OtherCurrentLiabilitiesMemberus-gaap:ForeignExchangeContractMemberus-gaap:CashFlowHedgingMember2024-12-310000895728enb:RenewablePowerGenerationSegmentMemberus-gaap:InvesteeMemberenb:OtherEquityInvesteeMembersrt:MaximumMember2025-12-310000895728us-gaap:NonUsMemberus-gaap:ForeignCountryMember2023-01-012023-12-310000895728enb:GasDistributionandStorageSegmentMember2024-12-310000895728enb:TermLoanMembersrt:ParentCompanyMember2024-12-310000895728us-gaap:FairValueInputsLevel3Memberus-gaap:MarketApproachValuationTechniqueMembersrt:NaturalGasReservesMembersrt:MinimumMemberenb:OptionsForwardCommodityContractMember2025-12-310000895728enb:SeriesPPreferredStockMember2025-01-012025-12-310000895728country:HU2025-01-012025-12-310000895728us-gaap:TransferredAtPointInTimeMemberenb:GasTransmissionSegmentMember2024-01-012024-12-310000895728enb:EnbridgeGasInc.Memberenb:A885Medium-TermNotesMember2025-10-012025-10-310000895728enb:TransportationAndOtherServicesRevenuesMember2023-01-012023-12-310000895728enb:EnbridgeGasInc.Memberenb:DebenturesMember2025-12-310000895728enb:LiquidsPipelinesSegmentMember2024-12-310000895728enb:Series13PreferredStockMember2025-01-012025-03-310000895728us-gaap:AccumulatedDefinedBenefitPlansAdjustmentMember2025-01-012025-12-310000895728us-gaap:RetainedEarningsMember2023-12-310000895728enb:DefinedBenefitPlanAlternativesMemberus-gaap:ForeignPlanMember2025-12-310000895728enb:DCPMidstreamLLCMemberenb:GasTransmissionSegmentMemberus-gaap:InvesteeMember2025-12-310000895728enb:RenewablePowerGenerationSegmentMember2023-12-310000895728enb:RenewablePowerGenerationSegmentMemberus-gaap:TransferredAtPointInTimeMember2023-01-012023-12-310000895728us-gaap:FairValueInputsLevel3Memberus-gaap:PensionPlansDefinedBenefitMemberenb:DefinedBenefitPlanEquitySecuritiesGlobalMembercountry:CA2024-12-310000895728us-gaap:OtherContractMember2024-12-310000895728us-gaap:FairValueInputsLevel2Memberenb:DefinedBenefitPlanAlternativesMemberus-gaap:ForeignPlanMemberus-gaap:OtherPostretirementBenefitPlansDefinedBenefitMemberus-gaap:EstimateOfFairValueFairValueDisclosureMember2024-12-310000895728enb:BakkenPipelineInvestmentsLLCMemberus-gaap:InvesteeMemberenb:BakkenPipelineSystemMember2025-12-310000895728enb:RenewablePowerGenerationSegmentMemberus-gaap:OperatingSegmentsMemberenb:StorageandOtherRevenueMember2024-01-012024-12-310000895728enb:ElectricityRevenueMembersrt:ConsolidationEliminationsMember2024-01-012024-12-310000895728enb:RenewablePowerGenerationSegmentMember2025-12-3100008957282025-07-012025-09-300000895728enb:QuestarGasCompanyMember2024-01-012024-12-310000895728enb:GasTransmissionSegmentMemberus-gaap:InvesteeMemberenb:SabalTrailTransmissionLLCMember2025-12-310000895728us-gaap:AssetUnderConstructionMember2025-12-310000895728us-gaap:PreferredStockMemberenb:Series3PreferredStockMember2025-12-310000895728enb:ForeignExchangeForwardSellContractMember2024-12-310000895728us-gaap:PensionPlansDefinedBenefitMemberus-gaap:FairValueInputsLevel1Memberus-gaap:DefinedBenefitPlanEquitySecuritiesNonUsMemberus-gaap:ForeignPlanMember2024-12-310000895728srt:ConsolidationEliminationsMemberenb:StorageandOtherRevenueMember2024-01-012024-12-310000895728us-gaap:OperatingSegmentsMemberenb:GasDistributionandStorageSegmentMember2025-12-310000895728us-gaap:PreferredStockMemberenb:Three-MonthGovernmentOfCanadaTreasuryBillMemberenb:PreferenceSharesSeries8Member2025-12-310000895728country:CH2025-01-012025-12-310000895728enb:OtherRevenueMember2023-01-012023-12-310000895728us-gaap:DesignatedAsHedgingInstrumentMemberus-gaap:OtherCurrentLiabilitiesMemberus-gaap:ForeignExchangeContractMemberus-gaap:FairValueHedgingMember2024-12-310000895728enb:StorageMember2024-12-310000895728us-gaap:IntersegmentEliminationMemberenb:LiquidsPipelinesSegmentMember2023-01-012023-12-310000895728country:CA2025-01-012025-12-310000895728us-gaap:FairValueInputsLevel3Memberus-gaap:InterestRateContractMemberus-gaap:EstimateOfFairValueFairValueDisclosureMember2025-12-310000895728us-gaap:PreferredStockMemberenb:SeriesPPreferredStockMember2025-12-310000895728us-gaap:GasDistributionMemberenb:EnbridgeGasUtahMember2025-09-012025-09-300000895728us-gaap:DesignatedAsHedgingInstrumentMemberus-gaap:OtherCurrentLiabilitiesMemberus-gaap:CashFlowHedgingMemberus-gaap:CommodityContractMember2024-12-310000895728us-gaap:FairValueInputsLevel3Memberenb:DomesticGovernmentBondsMemberus-gaap:ForeignPlanMemberus-gaap:OtherPostretirementBenefitPlansDefinedBenefitMemberus-gaap:EstimateOfFairValueFairValueDisclosureMember2025-12-310000895728us-gaap:NondesignatedMemberus-gaap:ForeignExchangeContractMemberus-gaap:OtherCurrentAssetsMember2024-12-310000895728us-gaap:TransferredOverTimeMemberenb:LiquidsPipelinesSegmentMember2025-01-012025-12-310000895728us-gaap:NondesignatedMemberenb:DeferredAmountsAndOtherMemberus-gaap:CommodityContractMember2024-12-310000895728us-gaap:FairValueInputsLevel3Memberus-gaap:PensionPlansDefinedBenefitMemberus-gaap:CorporateBondSecuritiesMemberus-gaap:ForeignPlanMember2025-12-310000895728us-gaap:PensionPlansDefinedBenefitMemberus-gaap:FairValueInputsLevel1Memberenb:DomesticGovernmentBondsMembercountry:CA2025-12-310000895728us-gaap:OtherPostretirementBenefitPlansDefinedBenefitMember2025-01-012025-12-310000895728enb:PowerPurchaseAgreementsMember2025-12-310000895728us-gaap:TransferredAtPointInTimeMember2024-01-012024-12-310000895728us-gaap:NondesignatedMemberus-gaap:ForeignExchangeContractMemberus-gaap:OtherCurrentAssetsMember2025-12-310000895728enb:EIHSARL1Memberenb:RenewablePowerGenerationSegmentMemberus-gaap:InvesteeMemberenb:EolienMaritimeFranceSasMember2025-12-310000895728us-gaap:AccumulatedDefinedBenefitPlansAdjustmentMember2023-12-310000895728us-gaap:CommonStockMember2023-01-012023-12-310000895728us-gaap:TransferredOverTimeMemberenb:GasDistributionandStorageSegmentMember2024-01-012024-12-310000895728us-gaap:PensionPlansDefinedBenefitMemberus-gaap:FairValueInputsLevel1Memberenb:DefinedBenefitPlanEquitySecuritiesGlobalMembercountry:CA2025-12-310000895728enb:ElectricityRevenueMember2024-01-012024-12-310000895728us-gaap:SeniorNotesMemberenb:EnbridgeHoldingsTomorrowRNGLLCMember2024-12-310000895728enb:TransportationRevenueMembersrt:ConsolidationEliminationsMember2023-01-012023-12-310000895728us-gaap:SeriesDPreferredStockMemberus-gaap:PreferredStockMember2025-01-012025-12-310000895728enb:InterestRateContractForLongTermBorrowingsReceiveFixedRateMember2024-12-310000895728enb:WoodfibreLNGLPMemberenb:GasTransmissionSegmentMemberus-gaap:InvesteeMember2024-12-310000895728enb:FutureRemovalAndSiteRestorationReservesMember2024-12-310000895728us-gaap:NondesignatedMember2025-01-012025-12-310000895728us-gaap:DesignatedAsHedgingInstrumentMemberus-gaap:ForeignExchangeContractMemberenb:DeferredAmountsAndOtherMemberus-gaap:CashFlowHedgingMember2024-12-310000895728enb:CommittedCreditFacilityMemberenb:EnbridgeUSIncMembersrt:MaximumMember2025-01-012025-12-310000895728us-gaap:FairValueInputsLevel2Member2025-12-310000895728us-gaap:FairValueInputsLevel3Memberus-gaap:PensionPlansDefinedBenefitMemberus-gaap:CorporateBondSecuritiesMemberus-gaap:ForeignPlanMember2024-12-310000895728enb:TransportationAndOtherServicesRevenuesMemberus-gaap:InvesteeMember2024-01-012024-12-310000895728enb:A4.97SeniorNotesNoteOneMemberenb:EnbridgeHoldingsTomorrowRNGLLCMember2025-01-012025-01-310000895728us-gaap:TransferredOverTimeMemberenb:LiquidsPipelinesSegmentMember2024-01-012024-12-310000895728us-gaap:OperatingSegmentsMemberenb:LiquidsPipelinesSegmentMemberenb:StorageandOtherRevenueMember2023-01-012023-12-310000895728us-gaap:OtherCurrentAssetsMemberus-gaap:CommodityContractMember2025-12-310000895728us-gaap:RelatedPartyMemberus-gaap:VariableInterestEntityPrimaryBeneficiaryMember2025-12-310000895728us-gaap:TransferredOverTimeMember2025-01-012025-12-310000895728us-gaap:SoftwareAndSoftwareDevelopmentCostsMember2024-12-310000895728enb:WhistlerParentJV1Memberus-gaap:VariableInterestEntityNotPrimaryBeneficiaryMember2025-12-310000895728srt:ConsolidationEliminationsMemberenb:CommoditySalesMember2023-01-012023-12-310000895728us-gaap:AociDerivativeQualifyingAsHedgeExcludedComponentParentMember2025-01-012025-12-310000895728enb:SeriesIPreferredStockMember2025-10-012025-12-310000895728us-gaap:FairValueInputsLevel2Memberus-gaap:PensionPlansDefinedBenefitMemberus-gaap:DefinedBenefitPlanEquitySecuritiesNonUsMemberus-gaap:ForeignPlanMember2024-12-310000895728us-gaap:PensionPlansDefinedBenefitMemberenb:DomesticGovernmentBondsMembercountry:CA2024-12-310000895728enb:ElectricityRevenueMembersrt:ConsolidationEliminationsMember2025-01-012025-12-310000895728us-gaap:RetainedEarningsMember2024-12-310000895728enb:SeriesLPreferredStockMemberus-gaap:PreferredStockMember2025-12-310000895728us-gaap:PensionPlansDefinedBenefitMemberenb:DefinedBenefitPlanEquitySecuritiesGlobalMemberus-gaap:ForeignPlanMember2024-12-310000895728us-gaap:PreferredStockMemberenb:Three-MonthUSGovernmentTreasuryBillMemberenb:PreferenceSharesSeries6Member2025-12-310000895728us-gaap:ForeignCountryMembercountry:US2023-01-012023-12-310000895728enb:DefinedBenefitPlanAlternativesMemberus-gaap:ForeignPlanMemberus-gaap:OtherPostretirementBenefitPlansDefinedBenefitMemberus-gaap:EstimateOfFairValueFairValueDisclosureMember2024-12-310000895728enb:PurchaseGasVarianceMember2025-12-310000895728enb:EnbridgeGasInc.Memberenb:CommittedCreditFacilityMemberenb:A364DayExtendibleCreditFacilityMember2025-07-012025-07-310000895728us-gaap:DefinedBenefitPlanEquitySecuritiesUsMemberus-gaap:ForeignPlanMemberus-gaap:OtherPostretirementBenefitPlansDefinedBenefitMember2024-12-310000895728enb:TheEastOhioGasCompanyEOGMemberenb:FinanceLeaseObligationsMember2024-12-310000895728enb:GasDistributionSalesMemberus-gaap:OperatingSegmentsMemberenb:GasDistributionandStorageSegmentMember2025-01-012025-12-310000895728us-gaap:CommodityContractMemberus-gaap:EstimateOfFairValueFairValueDisclosureMember2024-12-310000895728us-gaap:NondesignatedMemberus-gaap:CommodityContractMember2025-01-012025-12-310000895728enb:AitkenCreekNorthGasStorageFacilityMember2023-03-310000895728us-gaap:LeaseholdsAndLeaseholdImprovementsMember2024-12-310000895728enb:PreferenceSharesSeries10Memberus-gaap:PreferredStockMemberenb:Three-MonthGovernmentOfCanadaTreasuryBillMember2025-12-310000895728enb:BiogasRightsAgreementsMember2024-12-310000895728us-gaap:DesignatedAsHedgingInstrumentMemberus-gaap:CashFlowHedgingMember2024-12-310000895728us-gaap:FairValueInputsLevel3Memberenb:DefinedBenefitPlanAlternativesMemberus-gaap:ForeignPlanMemberus-gaap:OtherPostretirementBenefitPlansDefinedBenefitMemberus-gaap:EstimateOfFairValueFairValueDisclosureMember2025-12-310000895728enb:DefinedBenefitPlanAlternativesMembercountry:CA2025-12-310000895728us-gaap:PreferredStockMemberenb:Series9PreferredStockMember2023-12-310000895728us-gaap:DesignatedAsHedgingInstrumentMemberus-gaap:CashFlowHedgingMemberenb:DeferredAmountsAndOtherMember2025-12-310000895728enb:WhistlerParentJVMemberenb:WhiteWaterISquaredMember2024-05-290000895728us-gaap:PreferredStockMemberenb:Series4PreferredStockMember2025-01-012025-12-310000895728enb:AlgonquinGasTransmissionLLCMember2024-12-310000895728us-gaap:FairValueInputsLevel3Memberus-gaap:PensionPlansDefinedBenefitMemberus-gaap:DefinedBenefitPlanEquitySecuritiesNonUsMemberus-gaap:ForeignPlanMember2024-12-310000895728us-gaap:LongTermDebtMember2025-12-310000895728enb:RenewablePowerGenerationSegmentMemberus-gaap:OperatingSegmentsMemberenb:CommoditySalesMember2023-01-012023-12-310000895728enb:RNGFacilitiesMembersrt:MaximumMember2024-01-022024-01-020000895728us-gaap:PreferredStockMemberenb:PreferenceSharesSeriesQMemberenb:Three-MonthGovernmentOfCanadaTreasuryBillMember2025-12-310000895728us-gaap:SeniorNotesMemberenb:AlgonquinGasTransmissionLLCMember2024-12-310000895728enb:InterestRateContractCostlessCollarMember2024-12-310000895728enb:ElectricityRevenueMemberus-gaap:OperatingSegmentsMemberenb:GasTransmissionSegmentMember2025-01-012025-12-310000895728enb:PublicOfferingMember2023-09-082023-09-080000895728us-gaap:InterestRateContractMemberus-gaap:AccumulatedGainLossNetCashFlowHedgeParentMember2025-01-012025-12-310000895728us-gaap:InvesteeMemberenb:DCPMidstreamLLC1Memberenb:DCPMidstreamLPMember2025-12-310000895728us-gaap:NondesignatedMemberus-gaap:InterestRateContractMemberus-gaap:OtherLiabilitiesMember2025-12-310000895728enb:A4.97SeniorNotesNoteThreeMemberenb:EnbridgeHoldingsTomorrowRNGLLCMember2025-01-310000895728us-gaap:DesignatedAsHedgingInstrumentMemberus-gaap:CashFlowHedgingMemberus-gaap:CommodityContractMember2024-12-310000895728enb:StorageMember2025-01-012025-12-310000895728us-gaap:AociDerivativeQualifyingAsHedgeExcludedComponentParentMember2022-12-310000895728srt:ParentCompanyMemberenb:SeniorNotesDueNovember2028Member2025-11-300000895728us-gaap:OperatingSegmentsMemberenb:GasDistributionandStorageSegmentMemberenb:StorageandOtherRevenueMember2024-01-012024-12-310000895728us-gaap:SeriesFPreferredStockMemberus-gaap:PreferredStockMember2025-12-310000895728us-gaap:PensionPlansDefinedBenefitMemberenb:DefinedBenefitPlanEquitySecuritiesGlobalMemberus-gaap:ForeignPlanMember2025-12-310000895728us-gaap:CommodityContractMember2025-01-012025-12-310000895728enb:DefinedBenefitPlanAlternativesMemberus-gaap:FairValueInputsLevel1Memberus-gaap:ForeignPlanMemberus-gaap:OtherPostretirementBenefitPlansDefinedBenefitMemberus-gaap:EstimateOfFairValueFairValueDisclosureMember2024-12-310000895728us-gaap:PreferredStockMemberenb:Series13PreferredStockMember2024-12-310000895728enb:CactusIIPipelineLLCMemberus-gaap:InvesteeMemberenb:LiquidsPipelinesSegmentMember2025-12-310000895728us-gaap:CashFlowHedgingMemberus-gaap:CommodityContractMember2025-01-012025-12-310000895728us-gaap:FairValueInputsLevel2Memberus-gaap:PensionPlansDefinedBenefitMemberenb:DefinedBenefitPlanAlternativesMembercountry:CA2025-12-310000895728enb:PembinaPipelineCorporationMemberenb:DisposalGroupAlliancePipelineAndAuxSableMember2024-04-010000895728us-gaap:OtherContractMemberus-gaap:FairValueInputsLevel3Memberus-gaap:EstimateOfFairValueFairValueDisclosureMember2024-12-310000895728enb:AlgonquinGasTransmissionLLCMember2025-12-310000895728us-gaap:FairValueInputsLevel2Memberus-gaap:PensionPlansDefinedBenefitMemberus-gaap:CorporateBondSecuritiesMemberus-gaap:ForeignPlanMember2024-12-310000895728enb:CommittedCreditFacilityMembersrt:ParentCompanyMembersrt:MinimumMember2025-01-012025-12-310000895728us-gaap:InvesteeMember2023-01-012023-12-310000895728us-gaap:LeaseholdsAndLeaseholdImprovementsMember2025-12-310000895728enb:GasDistributionSalesMembersrt:ConsolidationEliminationsMember2025-01-012025-12-310000895728us-gaap:DesignatedAsHedgingInstrumentMemberus-gaap:OtherCurrentLiabilitiesMemberus-gaap:FairValueHedgingMember2024-12-310000895728us-gaap:InvesteeMemberenb:GasTransmissionSegmentMemberenb:MatterhornExpressPipelineMember2025-06-162025-06-160000895728enb:EnbridgeGasInc.Memberenb:CommittedCreditFacilityMember2025-12-310000895728enb:CommercialPaperAndCreditFacilityDrawsMemberenb:EnbridgeUSIncMember2025-12-310000895728us-gaap:NondesignatedMemberus-gaap:OtherLiabilitiesMember2024-12-310000895728us-gaap:NondesignatedMemberus-gaap:ForeignExchangeContractMember2024-01-012024-12-310000895728us-gaap:DesignatedAsHedgingInstrumentMemberus-gaap:OtherCurrentAssetsMemberus-gaap:CashFlowHedgingMemberus-gaap:InterestRateContractMember2024-12-310000895728us-gaap:NondesignatedMemberus-gaap:CommodityContractMember2025-12-310000895728us-gaap:OperatingSegmentsMemberenb:OtherRevenueMemberenb:GasTransmissionSegmentMember2023-01-012023-12-310000895728us-gaap:ForeignTaxJurisdictionOtherMember2025-01-012025-12-310000895728us-gaap:PensionPlansDefinedBenefitMemberus-gaap:ForeignPlanMember2024-12-310000895728country:CA2024-12-310000895728us-gaap:DesignatedAsHedgingInstrumentMemberus-gaap:OtherCurrentLiabilitiesMemberus-gaap:InterestRateContractMemberus-gaap:FairValueHedgingMember2025-12-310000895728us-gaap:FairValueInputsLevel2Memberus-gaap:PensionPlansDefinedBenefitMemberenb:DefinedBenefitPlanAlternativesMemberus-gaap:ForeignPlanMember2024-12-310000895728us-gaap:DesignatedAsHedgingInstrumentMemberus-gaap:OtherCurrentLiabilitiesMemberus-gaap:ForeignExchangeContractMemberus-gaap:CashFlowHedgingMember2025-12-3100008957282025-10-012025-12-310000895728us-gaap:AdditionalPaidInCapitalMember2024-01-012024-12-310000895728enb:FixedToFixedTermSubordinatedTermNotesMembersrt:ParentCompanyMember2025-01-012025-12-310000895728enb:OtherNotPrimaryBeneficiaryMemberus-gaap:VariableInterestEntityNotPrimaryBeneficiaryMember2025-12-310000895728us-gaap:DesignatedAsHedgingInstrumentMemberus-gaap:CommodityContractMemberus-gaap:OtherLiabilitiesMemberus-gaap:FairValueHedgingMember2025-12-310000895728enb:EnbridgeEmployeeServicesIncHealthReimbursementAccountPlanMemberus-gaap:ForeignPlanMemberus-gaap:OtherPostretirementBenefitPlansDefinedBenefitMember2025-12-310000895728enb:PublicServiceCompanyOfNorthCarolinaIncorporatedMemberus-gaap:CarryingReportedAmountFairValueDisclosureMember2024-09-300000895728enb:EnbridgeGasInc.Memberenb:FinanceLeaseObligationsMember2025-12-310000895728enb:ForeignExchangeForwardSellContractMember2025-12-310000895728us-gaap:PreferredStockMemberenb:SeriesNPreferredStockMember2025-12-310000895728us-gaap:PreferredStockMember2024-12-310000895728us-gaap:OperatingSegmentsMemberenb:GasDistributionandStorageSegmentMemberenb:CommoditySalesMember2023-01-012023-12-310000895728us-gaap:RetainedEarningsMember2023-01-012023-12-310000895728us-gaap:CarryingReportedAmountFairValueDisclosureMember2024-12-310000895728enb:ElectricityRevenueMemberus-gaap:OperatingSegmentsMemberenb:GasDistributionandStorageSegmentMember2023-01-012023-12-310000895728enb:Medium-TermNotesDueFebruary2030Membersrt:ParentCompanyMember2025-02-280000895728us-gaap:FairValueInputsLevel3Memberus-gaap:ForeignPlanMemberus-gaap:OtherPostretirementBenefitPlansDefinedBenefitMemberus-gaap:EstimateOfFairValueFairValueDisclosureMember2025-12-310000895728enb:AccumulatedNetGainLossNetInvestmentHedgeParentMember2024-01-012024-12-310000895728us-gaap:AccumulatedTranslationAdjustmentMember2023-12-310000895728enb:EnbridgeGasInc.Memberenb:CommittedCreditFacilityMember2025-01-012025-12-310000895728us-gaap:FairValueInputsLevel2Memberus-gaap:EstimateOfFairValueFairValueDisclosureMember2024-12-310000895728us-gaap:CorporateBondSecuritiesMemberus-gaap:ForeignPlanMemberus-gaap:OtherPostretirementBenefitPlansDefinedBenefitMemberus-gaap:EstimateOfFairValueFairValueDisclosureMember2025-12-310000895728us-gaap:CashFlowHedgingMemberus-gaap:CommodityContractMember2023-01-012023-12-310000895728srt:ParentCompanyMemberenb:SeniorNotesDueJune2030Member2025-06-300000895728enb:SeriesIPreferredStockMember2025-01-012025-12-310000895728enb:VectorPipelineLPNotPrimaryBeneficiaryMemberus-gaap:VariableInterestEntityNotPrimaryBeneficiaryMember2024-12-310000895728us-gaap:ForeignPlanMemberus-gaap:OtherPostretirementBenefitPlansDefinedBenefitMember2024-12-310000895728enb:A480SeniorNotesNoteTwoMemberenb:EnbridgeHoldingsTomorrowRNGLLCMember2025-12-012025-12-310000895728enb:SpectraEnergyCorpMember2025-01-012025-12-310000895728enb:FinanceLeaseObligationsMemberenb:WestcoastEnergyIncorporationMember2024-12-310000895728enb:GasDistributionRevenueMember2023-01-012023-12-310000895728srt:ParentCompanyMemberenb:FixedToFixedTermSubordinatedTermNotesMember2024-12-310000895728us-gaap:FairValueInputsLevel3Memberus-gaap:PensionPlansDefinedBenefitMemberus-gaap:DefinedBenefitPlanCashAndCashEquivalentsMemberus-gaap:ForeignPlanMember2025-12-310000895728us-gaap:ForeignExchangeContractMemberus-gaap:OtherLiabilitiesMember2025-12-310000895728srt:ParentCompanyMemberenb:SeniorNotesDueApril2054Member2025-06-300000895728enb:RenewablePowerGenerationSegmentMemberus-gaap:TransferredOverTimeMember2024-01-012024-12-310000895728enb:OtherEquityInvesteeMemberus-gaap:InvesteeMemberenb:GasTransmissionSegmentMember2024-12-310000895728us-gaap:CustomerRelationshipsMember2025-12-310000895728enb:FinanceLeaseObligationsMemberenb:EnbridgeUSIncMember2024-12-310000895728us-gaap:RevolvingCreditFacilityMemberenb:TermLoanMaturingInJuly2028Member2025-07-012025-07-310000895728enb:GasDistributionSalesMemberus-gaap:OperatingSegmentsMemberenb:LiquidsPipelinesSegmentMember2023-01-012023-12-310000895728us-gaap:FairValueInputsLevel2Memberus-gaap:DefinedBenefitPlanCashAndCashEquivalentsMemberus-gaap:ForeignPlanMemberus-gaap:OtherPostretirementBenefitPlansDefinedBenefitMemberus-gaap:EstimateOfFairValueFairValueDisclosureMember2025-12-310000895728enb:IncentiveStockOptionsMember2023-12-310000895728enb:ForeignExchangeCollarsSellContractMember2024-12-310000895728enb:EnbridgeGasInc.Memberenb:A331Medium-TermNotesMember2025-09-300000895728us-gaap:DesignatedAsHedgingInstrumentMemberus-gaap:ForeignExchangeContractMemberenb:DeferredAmountsAndOtherMemberus-gaap:FairValueHedgingMember2024-12-310000895728enb:FinanceLeaseObligationsMemberenb:EnbridgeUSIncMember2025-12-310000895728us-gaap:OperatingSegmentsMemberenb:GasDistributionandStorageSegmentMemberenb:StorageandOtherRevenueMember2023-01-012023-12-310000895728enb:EnbridgeAthabascaMidstreamInvestorLimitedPartnershipMember2024-12-310000895728us-gaap:AociDerivativeQualifyingAsHedgeExcludedComponentParentMember2025-12-310000895728us-gaap:OtherContractMemberus-gaap:NondesignatedMember2024-01-012024-12-310000895728enb:WoodfibreLNGLPMembersrt:MaximumMember2025-01-012025-12-310000895728us-gaap:SeniorNotesMemberenb:EastTennesseeNaturalGasLLCMember2024-12-310000895728us-gaap:DerivativeMember2025-01-012025-12-310000895728enb:LiquidsPipelinesSegmentMember2023-12-310000895728us-gaap:SeriesGPreferredStockMember2025-10-012025-12-310000895728enb:WestcoastEnergyIncorporationMemberenb:A885DebenturesMember2025-07-310000895728enb:InterestRateContractForLongTermBorrowingsPayFixedRateMember2024-12-310000895728enb:IncentiveStockOptionsMemberenb:RetirementEligibleEmployeesMember2025-01-012025-12-310000895728enb:WestcoastEnergyGPIncMember2025-12-310000895728enb:SeriesIPreferredStockMember2025-07-012025-09-300000895728enb:WhistlerParentJVMember2024-05-292024-05-290000895728enb:EnbridgeGasOhioMemberus-gaap:GasDistributionMember2023-10-012023-10-310000895728enb:DCPMidstreamLLCMemberus-gaap:CapitalUnitClassBMemberus-gaap:InvesteeMember2025-12-310000895728enb:CommercialPaperAndCreditFacilityDrawsMember2024-12-310000895728enb:LiquidsPipelinesSegmentMember2024-01-012024-12-310000895728us-gaap:FairValueInputsLevel2Memberus-gaap:PensionPlansDefinedBenefitMemberus-gaap:ForeignPlanMember2025-12-310000895728enb:GasTransmissionSegmentMember2024-01-012024-12-310000895728country:CAus-gaap:OtherPostretirementBenefitPlansDefinedBenefitMember2025-12-310000895728us-gaap:SeniorNotesMemberenb:QuestarGasCompanyMember2024-12-310000895728enb:IncentiveStockOptionsMember2024-12-310000895728us-gaap:IntersegmentEliminationMemberenb:LiquidsPipelinesSegmentMember2025-01-012025-12-310000895728enb:DeferredIncomeTaxesMember2025-12-310000895728enb:EnbridgeGasInc.Memberenb:A865DebenturesMember2025-11-300000895728us-gaap:PreferredStockMemberenb:Series1PreferredStockMember2025-12-310000895728us-gaap:FairValueInputsLevel3Membersrt:NaturalGasReservesMemberus-gaap:MarketApproachValuationTechniqueMembersrt:MinimumMemberenb:FinancialForwardCommodityContractMember2025-12-310000895728us-gaap:PensionPlansDefinedBenefitMembercountry:CA2025-12-310000895728us-gaap:CommodityContractMember2023-01-012023-12-310000895728us-gaap:InterestRateContractMemberus-gaap:EstimateOfFairValueFairValueDisclosureMember2024-12-310000895728enb:GasDistributionRevenueMember2025-01-012025-12-310000895728us-gaap:FairValueInputsLevel3Memberus-gaap:MarketApproachValuationTechniqueMembersrt:NaturalGasReservesMemberenb:FinancialForwardCommodityContractMembersrt:MaximumMember2025-12-310000895728enb:RenewablePowerGenerationSegmentMemberus-gaap:OperatingSegmentsMemberenb:OtherRevenueMember2025-01-012025-12-310000895728srt:MaximumMemberus-gaap:ForeignPlanMember2025-01-012025-12-310000895728enb:PensionPlanPayableMember2025-12-310000895728us-gaap:PreferredStockMemberenb:Series3PreferredStockMember2025-01-012025-12-310000895728us-gaap:AccumulatedDefinedBenefitPlansAdjustmentMember2022-12-310000895728enb:GasDistributionSalesMember2025-01-012025-12-310000895728enb:USFinancialInstitutionsMemberus-gaap:DerivativeMember2025-01-012025-12-310000895728enb:SpectraEnergyCorpMember2023-01-012023-12-310000895728us-gaap:CommonStockMember2023-12-310000895728us-gaap:PreferredStockMemberenb:Series1PreferredStockMember2023-12-310000895728us-gaap:SeriesFPreferredStockMemberus-gaap:PreferredStockMember2025-01-012025-12-310000895728us-gaap:ForeignTaxJurisdictionOtherMember2023-01-012023-12-310000895728enb:A398SeniorNotesMemberenb:EnbridgePipelinesSouthernLightsLLCMember2025-12-310000895728enb:Series11PreferredStockMember2024-10-012024-12-310000895728us-gaap:TransferredOverTimeMemberenb:LiquidsPipelinesSegmentMember2023-01-012023-12-310000895728us-gaap:FairValueInputsLevel3Memberenb:PhysicalForwardCommodityContractMemberus-gaap:MarketApproachValuationTechniqueMemberenb:PowerMemberus-gaap:EstimateOfFairValueFairValueDisclosureMember2025-12-310000895728us-gaap:DefinedBenefitPlanCashAndCashEquivalentsMemberus-gaap:ForeignPlanMemberus-gaap:OtherPostretirementBenefitPlansDefinedBenefitMemberus-gaap:EstimateOfFairValueFairValueDisclosureMember2024-12-310000895728us-gaap:PensionPlansDefinedBenefitMemberus-gaap:FairValueInputsLevel1Memberus-gaap:CorporateBondSecuritiesMemberus-gaap:ForeignPlanMember2024-12-3100008957282025-01-012025-03-310000895728srt:ConsolidationEliminationsMemberenb:CommoditySalesMember2025-01-012025-12-310000895728us-gaap:NondesignatedMemberenb:DeferredAmountsAndOtherMemberus-gaap:InterestRateContractMember2024-12-310000895728us-gaap:PensionPlansDefinedBenefitMemberus-gaap:FairValueInputsLevel1Memberenb:DefinedBenefitPlanEquitySecuritiesGlobalMembercountry:CA2024-12-310000895728enb:RenewablePowerGenerationSegmentMemberus-gaap:InvesteeMember2025-12-310000895728enb:DeferredProjectsCostsMember2025-12-310000895728us-gaap:IntersegmentEliminationMember2025-12-310000895728enb:OtherCounterpartiesMemberus-gaap:DerivativeMember2024-01-012024-12-310000895728us-gaap:FairValueInputsLevel3Memberenb:PhysicalForwardCommodityContractMemberus-gaap:MarketApproachValuationTechniqueMembersrt:MinimumMemberenb:PowerMember2025-12-310000895728us-gaap:PensionPlansDefinedBenefitMemberenb:DefinedBenefitPlanEquitySecuritiesGlobalMembercountry:CA2025-12-310000895728us-gaap:OtherMachineryAndEquipmentMember2025-12-310000895728us-gaap:FairValueInputsLevel2Memberus-gaap:PensionPlansDefinedBenefitMemberus-gaap:CorporateBondSecuritiesMembercountry:CA2025-12-310000895728enb:GasDistributionSalesMember2024-01-012024-12-310000895728enb:LandAndRightOfWayMember2025-01-012025-12-310000895728us-gaap:NondesignatedMemberus-gaap:ForeignExchangeContractMember2025-01-012025-12-310000895728us-gaap:PensionPlansDefinedBenefitMemberus-gaap:DefinedBenefitPlanCashAndCashEquivalentsMemberus-gaap:FairValueInputsLevel1Memberus-gaap:ForeignPlanMember2025-12-310000895728us-gaap:TransferredOverTimeMemberenb:GasTransmissionSegmentMember2023-01-012023-12-310000895728us-gaap:FairValueInputsLevel1Memberus-gaap:EstimateOfFairValueFairValueDisclosureMember2024-12-310000895728us-gaap:PreferredStockMemberenb:SeriesRPreferredStockMember2025-12-310000895728enb:IncentiveStockOptionsMemberenb:UnitedStatesEmployeesMember2024-12-310000895728us-gaap:PensionPlansDefinedBenefitMemberus-gaap:ForeignPlanMember2024-01-012024-12-310000895728us-gaap:ParentMember2025-12-310000895728enb:RenewablePowerGenerationSegmentMemberus-gaap:InvesteeMemberenb:East-WestTieLimitedPartnershipMember2025-03-040000895728us-gaap:RetainedEarningsMember2024-01-012024-12-310000895728us-gaap:PensionPlansDefinedBenefitMemberus-gaap:FairValueInputsLevel1Memberus-gaap:CorporateBondSecuritiesMemberus-gaap:ForeignPlanMember2025-12-310000895728enb:ElectricityRevenueMembersrt:ConsolidationEliminationsMember2023-01-012023-12-310000895728us-gaap:DesignatedAsHedgingInstrumentMemberus-gaap:OtherCurrentAssetsMemberus-gaap:FairValueHedgingMember2025-12-310000895728enb:TresPalaciosHoldingsLlcMember2023-04-032023-04-030000895728us-gaap:PensionPlansDefinedBenefitMemberus-gaap:FairValueInputsLevel1Memberus-gaap:CorporateBondSecuritiesMembercountry:CA2024-12-310000895728us-gaap:PreferredStockMemberenb:SeriesIPreferredStockMember2025-12-310000895728us-gaap:SalesRevenueNetMemberenb:LargestNon-AffiliatedCustomerMemberus-gaap:CustomerConcentrationRiskMember2024-01-012024-12-310000895728us-gaap:FairValueInputsLevel2Memberus-gaap:ForeignExchangeContractMemberus-gaap:EstimateOfFairValueFairValueDisclosureMember2024-12-3100008957282027-01-012025-12-310000895728enb:ElectricityRevenueMemberus-gaap:OperatingSegmentsMemberenb:LiquidsPipelinesSegmentMember2024-01-012024-12-310000895728us-gaap:PreferredStockMemberenb:Series7PreferredStockMember2025-12-310000895728us-gaap:PreferredStockMemberenb:Series15PreferredStockMember2024-12-310000895728us-gaap:PensionPlansDefinedBenefitMemberus-gaap:FairValueInputsLevel1Memberus-gaap:CorporateBondSecuritiesMembercountry:CA2025-12-310000895728us-gaap:FairValueInputsLevel2Memberus-gaap:ForeignExchangeContractMemberus-gaap:EstimateOfFairValueFairValueDisclosureMember2025-12-310000895728us-gaap:OtherContractMemberus-gaap:NondesignatedMember2023-01-012023-12-310000895728us-gaap:NondesignatedMemberenb:TransportationRevenueMemberus-gaap:CommodityContractMember2025-01-012025-12-310000895728us-gaap:NondesignatedMemberus-gaap:OtherCurrentAssetsMember2025-12-310000895728us-gaap:AccumulatedOtherComprehensiveIncomeMember2024-01-012024-12-310000895728enb:A480SeniorNotesNoteOneMemberenb:EnbridgeHoldingsTomorrowRNGLLCMember2025-12-310000895728us-gaap:FairValueInputsLevel3Memberus-gaap:PensionPlansDefinedBenefitMemberus-gaap:DefinedBenefitPlanEquitySecuritiesNonUsMembercountry:CA2025-12-310000895728enb:CommercialPaperAndCreditFacilityDrawsMember2024-01-012024-12-310000895728enb:CommoditySalesRevenueMember2024-01-012024-12-310000895728us-gaap:SeniorNotesMemberenb:QuestarGasCompanyMember2025-12-310000895728enb:TransportationRevenueMember2025-01-012025-12-310000895728us-gaap:PerformanceSharesMember2023-01-012023-12-310000895728enb:Series13PreferredStockMember2025-04-012025-06-300000895728enb:CommittedCreditFacilityMemberenb:EnbridgeUSIncMember2025-12-310000895728country:US2024-01-012024-12-310000895728enb:GasTransmissionSegmentMemberus-gaap:InvesteeMemberenb:OffshoreJointVenturesMember2025-12-310000895728enb:DCPMidstreamLLCMemberus-gaap:InvesteeMemberus-gaap:CapitalUnitClassAMember2025-12-310000895728enb:TransportationAndOtherServicesRevenuesMember2024-01-012024-12-310000895728us-gaap:NondesignatedMemberenb:TransportationRevenueMemberus-gaap:CommodityContractMember2023-01-012023-12-310000895728enb:DelawareBasinResidueLLCMemberenb:GasTransmissionSegmentMemberus-gaap:InvesteeMember2024-10-312024-10-310000895728us-gaap:OtherMachineryAndEquipmentMember2025-01-012025-12-310000895728us-gaap:LongTermDebtMember2025-01-012025-12-310000895728enb:GasDistributionSalesMemberus-gaap:OperatingSegmentsMemberenb:GasTransmissionSegmentMember2025-01-012025-12-310000895728enb:QuestarGasCompanyMember2024-05-310000895728us-gaap:OtherMachineryAndEquipmentMember2024-12-310000895728us-gaap:ForeignPlanMemberus-gaap:OtherPostretirementBenefitPlansDefinedBenefitMember2024-01-012024-12-310000895728us-gaap:PensionPlansDefinedBenefitMemberus-gaap:FairValueInputsLevel1Memberus-gaap:ForeignPlanMember2024-12-310000895728enb:OperatingAndAdministrativeExpenseMemberus-gaap:NondesignatedMemberus-gaap:CommodityContractMember2025-01-012025-12-310000895728srt:MinimumMemberenb:GasDistributionandStorageSegmentMemberus-gaap:InvesteeMemberenb:OtherEquityInvesteeMember2025-12-310000895728us-gaap:IntersegmentEliminationMember2024-12-310000895728us-gaap:InvesteeMemberenb:GasTransmissionSegmentMemberenb:MatterhornExpressPipelineMember2025-06-160000895728us-gaap:DesignatedAsHedgingInstrumentMemberus-gaap:OtherCurrentLiabilitiesMemberus-gaap:CashFlowHedgingMember2024-12-310000895728us-gaap:NondesignatedMemberus-gaap:OtherCurrentAssetsMemberus-gaap:CommodityContractMember2024-12-310000895728enb:DebtInstrumentInterestRateTermsPeriodFourMembersrt:ParentCompanyMemberenb:FixedToFixedTermSubordinatedTermNotesMember2025-01-012025-12-310000895728enb:CommoditySalesMember2024-01-012024-12-310000895728enb:SteckmanRidgeLPMemberenb:GasTransmissionSegmentMemberus-gaap:InvesteeMember2024-12-310000895728us-gaap:OperatingSegmentsMember2023-01-012023-12-310000895728us-gaap:FairValueInputsLevel3Memberus-gaap:PensionPlansDefinedBenefitMemberenb:DomesticGovernmentBondsMemberus-gaap:ForeignPlanMember2024-12-310000895728enb:EnbridgeGasOntarioMemberus-gaap:GasDistributionMember2025-01-012025-12-310000895728us-gaap:DesignatedAsHedgingInstrumentMemberus-gaap:ForeignExchangeContractMemberus-gaap:CashFlowHedgingMember2024-12-310000895728enb:CanadianFinancialInstitutionsMemberus-gaap:DerivativeMember2024-01-012024-12-310000895728us-gaap:DefinedBenefitPlanEquitySecuritiesMembercountry:CA2024-12-310000895728enb:Medium-TermNotesDueSeptember2055Memberenb:EnbridgeGasInc.Member2025-09-300000895728enb:CommercialPaperAndCreditFacilityDrawsMember2025-12-310000895728us-gaap:DesignatedAsHedgingInstrumentMemberus-gaap:CashFlowHedgingMemberenb:DeferredAmountsAndOtherMemberus-gaap:InterestRateContractMember2025-12-310000895728us-gaap:AccumulatedDefinedBenefitPlansAdjustmentMember2025-12-3100008957282024-01-012024-12-310000895728us-gaap:OperatingSegmentsMemberenb:CommoditySalesMemberenb:LiquidsPipelinesSegmentMember2025-01-012025-12-310000895728us-gaap:OtherCurrentAssetsMemberus-gaap:InterestRateContractMember2024-12-310000895728us-gaap:PensionPlansDefinedBenefitMemberus-gaap:FairValueInputsLevel1Memberenb:DefinedBenefitPlanEquitySecuritiesGlobalMemberus-gaap:ForeignPlanMember2024-12-310000895728us-gaap:OperatingSegmentsMember2024-01-012024-12-310000895728us-gaap:FairValueInputsLevel3Memberus-gaap:PensionPlansDefinedBenefitMemberenb:DomesticGovernmentBondsMembercountry:CA2025-12-310000895728us-gaap:OperatingSegmentsMemberenb:OtherRevenueMemberenb:GasTransmissionSegmentMember2024-01-012024-12-310000895728us-gaap:SeniorNotesMemberenb:TexasEasternTransmissionLPMember2024-12-310000895728us-gaap:FairValueInputsLevel3Memberus-gaap:CommodityContractMemberus-gaap:EstimateOfFairValueFairValueDisclosureMember2024-12-310000895728us-gaap:AccumulatedTranslationAdjustmentMember2024-01-012024-12-310000895728us-gaap:OperatingSegmentsMemberenb:GasTransmissionSegmentMemberenb:StorageandOtherRevenueMember2023-01-012023-12-310000895728us-gaap:FairValueInputsLevel2Memberus-gaap:PensionPlansDefinedBenefitMemberenb:DomesticGovernmentBondsMemberus-gaap:ForeignPlanMember2025-12-310000895728enb:CommodityCostsMemberus-gaap:NondesignatedMemberus-gaap:CommodityContractMember2023-01-012023-12-310000895728enb:AtTheMarketOfferingMember2024-05-152024-05-150000895728us-gaap:SeniorNotesMemberenb:BlaurackeGMBHMember2024-12-310000895728enb:InterestRateContractForLongTermBorrowingsPayFixedRateMember2025-12-310000895728us-gaap:PreferredStockMemberus-gaap:SeriesAPreferredStockMember2024-12-310000895728us-gaap:AdditionalPaidInCapitalMember2023-12-310000895728srt:ParentCompanyMemberenb:FixedToFloatingSubordinatedTermNotesMember2024-12-310000895728enb:CommercialPaperAndCreditFacilityDrawsMemberenb:EnbridgePipelinesIncMember2024-12-310000895728enb:DefinedBenefitPlanAlternativesMemberus-gaap:FairValueInputsLevel1Memberus-gaap:ForeignPlanMemberus-gaap:OtherPostretirementBenefitPlansDefinedBenefitMemberus-gaap:EstimateOfFairValueFairValueDisclosureMember2025-12-310000895728srt:AffiliatedEntityMember2024-12-310000895728enb:GasDistributionandStorageSegmentMemberus-gaap:InvesteeMemberenb:OtherEquityInvesteeMember2025-12-310000895728us-gaap:SeriesAPreferredStockMemberus-gaap:PreferredStockMember2025-01-012025-12-310000895728us-gaap:PreferredStockMemberenb:PreferenceSharesSeries19Member2023-12-310000895728us-gaap:OperatingSegmentsMemberenb:TransportationRevenueMemberenb:GasDistributionandStorageSegmentMember2023-01-012023-12-310000895728us-gaap:DesignatedAsHedgingInstrumentMemberus-gaap:OtherCurrentAssetsMemberus-gaap:CashFlowHedgingMemberus-gaap:InterestRateContractMember2025-12-310000895728us-gaap:DesignatedAsHedgingInstrumentMemberus-gaap:OtherCurrentLiabilitiesMemberus-gaap:CommodityContractMemberus-gaap:FairValueHedgingMember2025-12-310000895728enb:DefinedBenefitPlanEquitySecuritiesAndFixedIncomeSecuritiesMember2025-12-3100008957282025-12-310000895728us-gaap:VariableInterestEntityNotPrimaryBeneficiaryMember2024-12-310000895728us-gaap:InterestRateContractMember2023-01-012023-12-310000895728country:CAus-gaap:OtherPostretirementBenefitPlansDefinedBenefitMember2023-01-012023-12-310000895728us-gaap:SeniorNotesMemberenb:PublicServiceCompanyOfNorthCarolinaIncorporatedPSNCAcquisitionMember2025-12-310000895728us-gaap:ForeignExchangeContractMemberus-gaap:OtherCurrentAssetsMember2024-12-310000895728us-gaap:PreferredStockMemberenb:Series5PreferredStockMember2025-12-310000895728us-gaap:PensionPlansDefinedBenefitMemberus-gaap:ForeignPlanMember2025-12-310000895728stpr:CA-ON2023-01-012023-12-310000895728us-gaap:CashFlowHedgingMemberus-gaap:InterestRateContractMember2025-01-012025-12-310000895728us-gaap:NondesignatedMemberus-gaap:ForeignExchangeContractMember2024-12-310000895728country:US2025-12-310000895728us-gaap:FairValueInputsLevel3Memberenb:PhysicalForwardCommodityContractMemberus-gaap:MarketApproachValuationTechniqueMembersrt:NaturalGasReservesMembersrt:MinimumMember2025-12-310000895728srt:ParentCompanyMemberenb:CommercialPaperAndCreditFacilityDrawsMember2025-12-310000895728enb:DemandSideManagementCostsMember2024-12-310000895728enb:Series15PreferredStockMember2025-04-012025-06-300000895728enb:GasDistributionandStorageSegmentMemberus-gaap:InvesteeMember2025-12-310000895728us-gaap:DesignatedAsHedgingInstrumentMemberus-gaap:OtherCurrentAssetsMemberus-gaap:CommodityContractMemberus-gaap:FairValueHedgingMember2025-12-310000895728us-gaap:OtherContractMemberus-gaap:DesignatedAsHedgingInstrumentMemberus-gaap:CashFlowHedgingMember2024-12-310000895728us-gaap:FairValueInputsLevel3Memberus-gaap:PensionPlansDefinedBenefitMembercountry:CA2025-01-012025-12-310000895728us-gaap:OperatingSegmentsMemberenb:GasDistributionandStorageSegmentMemberenb:CommoditySalesMember2024-01-012024-12-310000895728enb:A398SeniorNotesMemberenb:EnbridgePipelinesSouthernLightsLLCMember2025-06-300000895728us-gaap:SeniorNotesMemberenb:PublicServiceCompanyOfNorthCarolinaIncorporatedPSNCAcquisitionMember2024-12-310000895728enb:A345Medium-TermNotesMemberenb:EnbridgePipelinesIncMember2025-09-300000895728us-gaap:DesignatedAsHedgingInstrumentMemberus-gaap:CashFlowHedgingMemberus-gaap:OtherLiabilitiesMember2024-12-310000895728srt:ParentCompanyMemberenb:FixedToFixedTermSubordinatedTermNotesMemberenb:DebtInstrumentInterestRateTermsPeriodOneMember2025-01-012025-12-310000895728us-gaap:PensionPlansDefinedBenefitMember2025-01-012025-12-310000895728enb:TransportationAndOtherServicesRevenuesMemberus-gaap:InvesteeMember2023-01-012023-12-310000895728enb:CommoditySalesMemberus-gaap:NondesignatedMemberus-gaap:CommodityContractMember2023-01-012023-12-310000895728us-gaap:CorporateBondSecuritiesMemberus-gaap:ForeignPlanMemberus-gaap:OtherPostretirementBenefitPlansDefinedBenefitMemberus-gaap:EstimateOfFairValueFairValueDisclosureMember2024-12-310000895728enb:Series5PreferredStockMember2025-01-012025-12-310000895728enb:AccumulatedNetGainLossNetInvestmentHedgeParentMember2022-12-310000895728us-gaap:FairValueInputsLevel2Memberus-gaap:PensionPlansDefinedBenefitMemberus-gaap:DefinedBenefitPlanCashAndCashEquivalentsMembercountry:CA2024-12-310000895728us-gaap:SeriesGPreferredStockMemberus-gaap:PreferredStockMemberenb:Three-MonthGovernmentOfCanadaTreasuryBillMember2025-12-310000895728enb:ElectricityRevenueMemberus-gaap:OperatingSegmentsMemberenb:LiquidsPipelinesSegmentMember2023-01-012023-12-310000895728enb:IncentiveStockOptionsMemberenb:CanadianEmployeesMember2024-12-310000895728us-gaap:InProcessResearchAndDevelopmentMember2024-12-310000895728us-gaap:FairValueInputsLevel1Memberus-gaap:ForeignPlanMemberus-gaap:OtherPostretirementBenefitPlansDefinedBenefitMemberus-gaap:EstimateOfFairValueFairValueDisclosureMember2025-12-310000895728us-gaap:EquityMethodInvestmentNonconsolidatedInvesteeOrGroupOfInvesteesMember2025-01-012025-12-3100008957282026-01-012025-12-310000895728us-gaap:PreferredStockMemberenb:SeriesRPreferredStockMember2024-12-310000895728enb:GasTransmissionSegmentMemberenb:DisposalGroupAlliancePipelineAndAuxSableMember2024-04-010000895728srt:ParentCompanyMemberenb:FinanceLeaseObligationsMember2025-12-310000895728enb:SoutheatSupplyHeaderLLCMemberus-gaap:InvesteeMemberenb:GasTransmissionSegmentMember2025-12-310000895728us-gaap:PreferredStockMemberus-gaap:SeriesHPreferredStockMember2025-12-310000895728enb:DebenturesMemberenb:PublicServiceCompanyOfNorthCarolinaIncorporatedPSNCAcquisitionMember2024-12-310000895728us-gaap:FairValueInputsLevel3Memberus-gaap:PensionPlansDefinedBenefitMemberus-gaap:CorporateBondSecuritiesMembercountry:CA2024-12-310000895728enb:IncentiveStockOptionsMemberenb:CanadianEmployeesMember2025-12-310000895728us-gaap:FairValueInputsLevel3Memberus-gaap:ForeignPlanMemberus-gaap:OtherPostretirementBenefitPlansDefinedBenefitMember2023-12-310000895728enb:InterestRateContractForShortTermBorrowingsMember2025-12-310000895728us-gaap:InvesteeMember2025-01-012025-12-310000895728us-gaap:FairValueInputsLevel3Memberus-gaap:DefinedBenefitPlanEquitySecuritiesUsMemberus-gaap:ForeignPlanMemberus-gaap:OtherPostretirementBenefitPlansDefinedBenefitMember2024-12-310000895728us-gaap:PensionPlansDefinedBenefitMemberus-gaap:CorporateBondSecuritiesMembercountry:CA2025-12-310000895728us-gaap:NondesignatedMemberus-gaap:ForeignExchangeContractMemberenb:DeferredAmountsAndOtherMember2024-12-310000895728us-gaap:DomesticCountryMember2025-01-012025-12-310000895728us-gaap:OtherCurrentLiabilitiesMember2024-12-310000895728us-gaap:PreferredStockMemberenb:Three-MonthGovernmentOfCanadaTreasuryBillMemberenb:PreferenceSharesSeries16Member2025-12-310000895728us-gaap:SeniorNotesMemberenb:SpectraEnergyCorpMember2024-12-310000895728us-gaap:SalesRevenueNetMemberenb:LargestNon-AffiliatedCustomerMemberus-gaap:CustomerConcentrationRiskMember2025-01-012025-12-310000895728us-gaap:OtherCurrentAssetsMember2024-12-310000895728us-gaap:DesignatedAsHedgingInstrumentMemberus-gaap:FairValueHedgingMember2024-12-310000895728us-gaap:FairValueInputsLevel3Memberus-gaap:PensionPlansDefinedBenefitMemberenb:DefinedBenefitPlanAlternativesMemberus-gaap:ForeignPlanMember2024-12-310000895728us-gaap:PensionPlansDefinedBenefitMemberus-gaap:FairValueInputsLevel1Memberus-gaap:DefinedBenefitPlanEquitySecuritiesNonUsMembercountry:CA2024-12-310000895728us-gaap:CommonStockMember2022-12-310000895728enb:RenewableEnergyAssetsMember2024-12-310000895728enb:A880Medium-TermNotesMemberenb:WestcoastEnergyIncorporationMember2025-11-012025-11-300000895728srt:MinimumMember2025-12-310000895728enb:Medium-TermNotesDueFebruary2035Membersrt:ParentCompanyMember2025-02-280000895728us-gaap:NondesignatedMember2023-01-012023-12-310000895728us-gaap:VariableInterestEntityPrimaryBeneficiaryMember2025-12-310000895728enb:WoodfibreLNGLPMemberus-gaap:VariableInterestEntityNotPrimaryBeneficiaryMember2025-12-310000895728us-gaap:IntersegmentEliminationMember2023-01-012023-12-310000895728enb:RenewablePowerGenerationSegmentMemberenb:GasDistributionSalesMemberus-gaap:OperatingSegmentsMember2024-01-012024-12-310000895728enb:FinanceLeaseObligationsMemberenb:WestcoastEnergyIncorporationMember2025-12-310000895728us-gaap:FairValueInputsLevel1Memberus-gaap:InterestRateContractMemberus-gaap:EstimateOfFairValueFairValueDisclosureMember2024-12-310000895728enb:DelawareBasinResidueLLCMemberus-gaap:InvesteeMemberenb:GasTransmissionSegmentMember2024-12-310000895728enb:RenewablePowerGenerationSegmentMemberus-gaap:OperatingSegmentsMember2024-01-012024-12-310000895728us-gaap:OtherCurrentLiabilitiesMemberus-gaap:CommodityContractMember2024-12-310000895728us-gaap:PreferredStockMember2023-01-012023-12-310000895728us-gaap:OtherContractMemberus-gaap:DesignatedAsHedgingInstrumentMemberus-gaap:FairValueHedgingMember2024-12-310000895728srt:ParentCompanyMemberenb:FixedToFixedTermSubordinatedTermNotesMemberenb:DebtInstrumentInterestRateTermsPeriodThreeMember2025-01-012025-12-310000895728us-gaap:OperatingSegmentsMemberenb:GasDistributionandStorageSegmentMember2023-01-012023-12-310000895728enb:TheEastOhioGasCompanyEOGMember2024-03-062024-12-310000895728us-gaap:SoftwareAndSoftwareDevelopmentCostsMember2025-12-310000895728us-gaap:FairValueInputsLevel2Memberus-gaap:CommodityContractMemberus-gaap:EstimateOfFairValueFairValueDisclosureMember2024-12-310000895728enb:LiquidsPipelinesSegmentMember2025-01-012025-12-310000895728enb:IncentiveStockOptionsMemberenb:UnitedStatesEmployeesMember2023-12-310000895728us-gaap:ForeignExchangeContractMemberus-gaap:EstimateOfFairValueFairValueDisclosureMember2025-12-310000895728enb:Sustainability-LinkedBondsMembersrt:ParentCompanyMember2024-12-310000895728us-gaap:SeniorNotesMemberenb:EnbridgePipelinesSouthernLightsLLCMember2025-12-310000895728enb:CommittedCreditFacilityMemberenb:EnbridgePipelinesIncMember2025-12-310000895728enb:A398SeniorNotesMemberenb:EnbridgePipelinesSouthernLightsLLCMember2025-06-012025-12-310000895728enb:IncentiveStockOptionsMember2025-12-310000895728country:CA2025-12-310000895728enb:NegativeSalvageMember2024-12-310000895728us-gaap:NoncontrollingInterestMember2023-12-310000895728us-gaap:AccumulatedNetUnrealizedInvestmentGainLossMember2025-01-012025-12-310000895728us-gaap:PensionPlansDefinedBenefitMemberus-gaap:FairValueInputsLevel1Memberenb:DefinedBenefitPlanEquitySecuritiesGlobalMemberus-gaap:ForeignPlanMember2025-12-310000895728enb:CommittedCreditFacilityMembersrt:ParentCompanyMembersrt:MaximumMember2025-01-012025-12-310000895728us-gaap:FairValueInputsLevel3Memberus-gaap:DefinedBenefitPlanEquitySecuritiesNonUsMemberus-gaap:ForeignPlanMemberus-gaap:OtherPostretirementBenefitPlansDefinedBenefitMember2025-12-310000895728us-gaap:OtherCurrentLiabilitiesMemberus-gaap:ForeignExchangeContractMember2025-12-310000895728us-gaap:DesignatedAsHedgingInstrumentMemberus-gaap:OtherCurrentAssetsMemberus-gaap:CashFlowHedgingMember2024-12-310000895728enb:VectorPipelineLPNotPrimaryBeneficiaryMembersrt:AffiliatedEntityMemberus-gaap:VariableInterestEntityNotPrimaryBeneficiaryMember2024-12-310000895728us-gaap:OperatingSegmentsMemberenb:GasDistributionandStorageSegmentMemberenb:CommoditySalesMember2025-01-012025-12-310000895728enb:CommittedCreditFacilityMember2025-01-012025-12-310000895728enb:ForeignExchangeForwardPurchaseContractMember2024-12-310000895728us-gaap:AociDerivativeQualifyingAsHedgeExcludedComponentParentMemberus-gaap:ForeignExchangeContractMember2025-01-012025-12-310000895728enb:GasDistributionRevenueMember2024-01-012024-12-310000895728us-gaap:DesignatedAsHedgingInstrumentMemberus-gaap:OtherCurrentLiabilitiesMemberus-gaap:CashFlowHedgingMemberus-gaap:CommodityContractMember2025-12-310000895728us-gaap:InvesteeMemberenb:GasTransmissionSegmentMemberenb:VectorPipelineMember2024-12-310000895728us-gaap:PensionPlansDefinedBenefitMemberus-gaap:DefinedBenefitPlanCashAndCashEquivalentsMembercountry:CA2025-12-310000895728us-gaap:DefinedBenefitPlanEquitySecuritiesMemberus-gaap:ForeignPlanMember2025-12-310000895728us-gaap:DesignatedAsHedgingInstrumentMemberus-gaap:OtherCurrentLiabilitiesMemberus-gaap:InterestRateContractMemberus-gaap:FairValueHedgingMember2024-12-310000895728us-gaap:DesignatedAsHedgingInstrumentMemberenb:DeferredAmountsAndOtherMemberus-gaap:CashFlowHedgingMember2024-12-310000895728us-gaap:CommodityContractMember2024-12-310000895728us-gaap:OtherCurrentLiabilitiesMemberus-gaap:InterestRateContractMember2024-12-310000895728us-gaap:FairValueInputsLevel2Memberus-gaap:DefinedBenefitPlanEquitySecuritiesUsMemberus-gaap:ForeignPlanMemberus-gaap:OtherPostretirementBenefitPlansDefinedBenefitMember2024-12-310000895728enb:IncentiveStockOptionsMemberenb:UnitedStatesEmployeesMember2025-12-310000895728enb:RNGFacilitiesMember2024-01-012024-12-310000895728us-gaap:DesignatedAsHedgingInstrumentMemberus-gaap:OtherCurrentLiabilitiesMemberus-gaap:FairValueHedgingMember2025-12-310000895728enb:GasTransmissionSegmentMemberus-gaap:InvesteeMemberenb:OtherEquityInvesteeMember2025-12-310000895728us-gaap:FairValueInputsLevel3Memberus-gaap:PensionPlansDefinedBenefitMemberenb:DefinedBenefitPlanEquitySecuritiesGlobalMembercountry:CA2025-12-310000895728us-gaap:CommonStockMember2024-12-3100008957282023-01-012023-12-310000895728us-gaap:SeriesGPreferredStockMember2025-07-012025-09-300000895728enb:PreferenceSharesSeries2Memberus-gaap:PreferredStockMemberenb:Three-MonthUSGovernmentTreasuryBillMember2025-12-310000895728srt:MaximumMember2025-12-310000895728enb:InterestRateContractCostlessCollarMember2025-12-310000895728us-gaap:OperatingSegmentsMemberenb:OtherRevenueMemberenb:LiquidsPipelinesSegmentMember2025-01-012025-12-310000895728enb:MaritimesNortheastPipelineLimitedPartnershipMember2024-12-310000895728us-gaap:PreferredStockMemberus-gaap:SeriesHPreferredStockMember2024-12-310000895728us-gaap:ForeignExchangeContractMemberus-gaap:AccumulatedOtherComprehensiveIncomeMember2025-01-012025-12-310000895728us-gaap:InvesteeMemberenb:OtherEquityInvesteeMembersrt:MaximumMemberenb:LiquidsPipelinesSegmentMember2025-12-310000895728us-gaap:FairValueInputsLevel1Memberus-gaap:DefinedBenefitPlanEquitySecuritiesNonUsMemberus-gaap:ForeignPlanMemberus-gaap:OtherPostretirementBenefitPlansDefinedBenefitMember2024-12-310000895728enb:FacilitiesAndEquipmentMember2025-01-012025-12-310000895728us-gaap:CustomerRelationshipsMember2024-12-310000895728us-gaap:AccumulatedGainLossNetCashFlowHedgeParentMember2025-12-310000895728enb:DebenturesMemberenb:PublicServiceCompanyOfNorthCarolinaIncorporatedPSNCAcquisitionMember2025-12-310000895728us-gaap:TransferredOverTimeMemberenb:GasTransmissionSegmentMember2024-01-012024-12-310000895728enb:A2.50SeniorNotesMembersrt:ParentCompanyMember2025-01-310000895728us-gaap:OperatingSegmentsMemberenb:LiquidsPipelinesSegmentMemberenb:StorageandOtherRevenueMember2025-01-012025-12-310000895728us-gaap:FairValueInputsLevel3Memberus-gaap:PensionPlansDefinedBenefitMembercountry:CA2024-12-310000895728enb:EnbridgeEnergyPartnersLPMemberenb:A588SeniorNotesMember2025-07-012025-07-310000895728us-gaap:AdditionalPaidInCapitalMember2022-12-310000895728us-gaap:FairValueInputsLevel3Memberus-gaap:CorporateBondSecuritiesMemberus-gaap:ForeignPlanMemberus-gaap:OtherPostretirementBenefitPlansDefinedBenefitMemberus-gaap:EstimateOfFairValueFairValueDisclosureMember2024-12-310000895728us-gaap:FairValueInputsLevel2Memberus-gaap:EstimateOfFairValueFairValueDisclosureMember2025-12-310000895728us-gaap:FairValueInputsLevel3Memberenb:PhysicalForwardCommodityContractMemberus-gaap:MarketApproachValuationTechniqueMembersrt:NaturalGasReservesMembersrt:MaximumMember2025-12-310000895728us-gaap:OperatingSegmentsMemberenb:OtherRevenueMemberenb:GasTransmissionSegmentMember2025-01-012025-12-310000895728us-gaap:OperatingSegmentsMemberenb:GasDistributionandStorageSegmentMemberenb:StorageandOtherRevenueMember2025-01-012025-12-310000895728enb:RenewablePowerGenerationSegmentMemberus-gaap:OperatingSegmentsMemberenb:OtherRevenueMember2023-01-012023-12-310000895728enb:OtherNonControllingInterestMember2025-12-310000895728us-gaap:OtherContractMemberus-gaap:NondesignatedMember2024-12-310000895728us-gaap:OperatingSegmentsMemberenb:LiquidsPipelinesSegmentMember2024-12-310000895728us-gaap:OtherContractMemberus-gaap:FairValueInputsLevel1Memberus-gaap:EstimateOfFairValueFairValueDisclosureMember2024-12-310000895728enb:CanadianProvincialMember2025-01-012025-12-310000895728enb:EnbridgeGasInc.Memberenb:DebenturesMember2024-12-310000895728enb:OtherRegulatoryLiabilitiesMember2024-12-310000895728us-gaap:OperatingSegmentsMemberenb:GasTransmissionSegmentMember2025-12-310000895728us-gaap:IntersegmentEliminationMemberenb:GasTransmissionSegmentMember2025-01-012025-12-310000895728us-gaap:PreferredStockMemberenb:Series15PreferredStockMember2023-12-310000895728us-gaap:FairValueInputsLevel2Memberus-gaap:PensionPlansDefinedBenefitMemberus-gaap:DefinedBenefitPlanCashAndCashEquivalentsMembercountry:CA2025-12-310000895728enb:DomesticGovernmentBondsMemberus-gaap:ForeignPlanMemberus-gaap:OtherPostretirementBenefitPlansDefinedBenefitMemberus-gaap:EstimateOfFairValueFairValueDisclosureMember2024-12-310000895728us-gaap:PreferredStockMemberenb:Series7PreferredStockMember2023-12-310000895728enb:StorageMember2025-12-310000895728enb:EnbridgePipelinesIncMemberenb:Medium-TermNotesMember2024-12-310000895728us-gaap:AccumulatedOtherComprehensiveIncomeMember2025-12-310000895728enb:ForeignExchangeForwardPurchaseContractMember2025-12-310000895728enb:EnbridgePipelinesIncMemberenb:FinanceLeaseObligationsMember2025-12-310000895728us-gaap:OtherCurrentLiabilitiesMemberus-gaap:NondesignatedMember2024-12-310000895728us-gaap:PreferredStockMemberenb:Series5PreferredStockMember2023-12-310000895728us-gaap:FairValueInputsLevel3Membersrt:NaturalGasReservesMemberus-gaap:MarketApproachValuationTechniqueMemberenb:FinancialForwardCommodityContractMemberus-gaap:EstimateOfFairValueFairValueDisclosureMember2025-12-310000895728us-gaap:CarryingReportedAmountFairValueDisclosureMemberenb:TheEastOhioGasCompanyEOGMember2024-03-060000895728us-gaap:VariableInterestEntityNotPrimaryBeneficiaryMemberenb:RampionOffshoreWindLimitedMember2024-12-310000895728us-gaap:AociDerivativeQualifyingAsHedgeExcludedComponentParentMemberus-gaap:ForeignExchangeContractMember2024-01-012024-12-310000895728us-gaap:PreferredStockMemberenb:Series4PreferredStockMember2025-12-310000895728us-gaap:FairValueInputsLevel2Memberus-gaap:DefinedBenefitPlanEquitySecuritiesUsMemberus-gaap:ForeignPlanMemberus-gaap:OtherPostretirementBenefitPlansDefinedBenefitMember2025-12-310000895728us-gaap:NoncontrollingInterestMember2024-01-012024-12-310000895728us-gaap:DefinedBenefitPlanEquitySecuritiesNonUsMemberus-gaap:ForeignPlanMemberus-gaap:OtherPostretirementBenefitPlansDefinedBenefitMember2024-12-310000895728us-gaap:SeniorNotesMemberenb:EnbridgePipelinesSouthernLightsLLCMember2024-12-310000895728us-gaap:SeriesAPreferredStockMemberus-gaap:PreferredStockMember2025-12-310000895728enb:EnbridgeGasInc.Memberenb:CommercialPaperAndCreditFacilityDrawsMember2024-12-310000895728enb:Series15PreferredStockMember2025-01-012025-12-310000895728enb:RenewablePowerGenerationSegmentMemberus-gaap:IntersegmentEliminationMember2024-01-012024-12-310000895728us-gaap:PreferredStockMemberenb:PreferenceSharesSeries19Member2025-01-012025-12-310000895728enb:IncentiveStockOptionsMemberenb:CanadianEmployeesMember2023-12-310000895728us-gaap:FairValueInputsLevel3Memberus-gaap:DefinedBenefitPlanCashAndCashEquivalentsMemberus-gaap:ForeignPlanMemberus-gaap:OtherPostretirementBenefitPlansDefinedBenefitMemberus-gaap:EstimateOfFairValueFairValueDisclosureMember2024-12-310000895728us-gaap:DerivativeMemberenb:AsianFinancialInstitutionsMember2024-01-012024-12-310000895728us-gaap:FairValueInputsLevel3Memberus-gaap:DefinedBenefitPlanEquitySecuritiesUsMemberus-gaap:ForeignPlanMemberus-gaap:OtherPostretirementBenefitPlansDefinedBenefitMember2025-12-310000895728us-gaap:FairValueInputsLevel2Memberus-gaap:PensionPlansDefinedBenefitMemberus-gaap:CorporateBondSecuritiesMembercountry:CA2024-12-310000895728us-gaap:IntersegmentEliminationMemberenb:GasDistributionandStorageSegmentMember2024-01-012024-12-310000895728enb:SeriesLPreferredStockMemberus-gaap:PreferredStockMember2023-12-310000895728us-gaap:PensionPlansDefinedBenefitMemberus-gaap:CorporateBondSecuritiesMembercountry:CA2024-12-310000895728us-gaap:SeriesFPreferredStockMemberus-gaap:PreferredStockMember2024-12-310000895728enb:PowerPurchaseAgreementsMember2024-12-310000895728us-gaap:OtherLiabilitiesMember2025-12-310000895728srt:ParentCompanyMemberenb:A244Medium-TermNotesMember2025-06-012025-06-300000895728us-gaap:FairValueInputsLevel3Membersrt:WeightedAverageMemberus-gaap:MarketApproachValuationTechniqueMemberenb:OptionsForwardCommodityContractMember2025-12-310000895728enb:SteckmanRidgeLPMemberus-gaap:InvesteeMemberenb:GasTransmissionSegmentMember2025-12-310000895728enb:OtherRevenueMembersrt:ConsolidationEliminationsMember2024-01-012024-12-310000895728enb:RenewablePowerGenerationSegmentMemberus-gaap:TransferredOverTimeMember2025-01-012025-12-310000895728enb:CommodityCostsMemberus-gaap:NondesignatedMemberus-gaap:CommodityContractMember2025-01-012025-12-310000895728enb:TheEastOhioGasCompanyEOGMemberenb:A130SeniorNotesMember2025-06-300000895728us-gaap:DesignatedAsHedgingInstrumentMemberus-gaap:CashFlowHedgingMemberus-gaap:InterestRateContractMemberus-gaap:OtherLiabilitiesMember2024-12-310000895728us-gaap:SeniorNotesMemberenb:SpectraEnergyPartnersLPMember2024-12-310000895728enb:RioBravoMember2024-05-292024-05-290000895728us-gaap:PerformanceSharesMembersrt:MinimumMember2025-12-310000895728enb:CommercialPaperAndCreditFacilityDrawsMember2025-01-012025-12-310000895728enb:CommittedCreditFacilityMemberenb:A364DayExtendibleCreditFacilityMemberenb:EnbridgePipelinesIncMember2025-07-012025-07-310000895728us-gaap:DesignatedAsHedgingInstrumentMemberus-gaap:OtherCurrentAssetsMemberus-gaap:InterestRateContractMemberus-gaap:FairValueHedgingMember2024-12-310000895728us-gaap:FairValueInputsLevel3Membersrt:WeightedAverageMemberus-gaap:MarketApproachValuationTechniqueMembersrt:NaturalGasReservesMemberenb:FinancialForwardCommodityContractMember2025-12-310000895728enb:TheEastOhioGasCompanyEOGMemberenb:A130SeniorNotesMember2025-06-012025-06-300000895728us-gaap:SeniorNotesMemberenb:EnbridgeSouthernLightsLPMember2025-12-310000895728enb:AitkenCreekNorthGasStorageFacilityMember2023-11-010000895728enb:RNGFacilitiesMember2024-01-022024-01-020000895728us-gaap:FairValueInputsLevel2Memberus-gaap:PensionPlansDefinedBenefitMemberenb:DefinedBenefitPlanEquitySecuritiesGlobalMembercountry:CA2025-12-310000895728enb:TheEastOhioGasCompanyEOGMemberenb:FinanceLeaseObligationsMember2025-12-310000895728enb:EnbridgeGasOhioMemberus-gaap:GasDistributionMember2025-12-310000895728enb:FoxSquirrelSolarLLCMemberenb:RenewablePowerGenerationSegmentMemberus-gaap:InvesteeMember2025-12-310000895728enb:CommodityCostsMemberus-gaap:NondesignatedMemberus-gaap:CommodityContractMember2024-01-012024-12-310000895728us-gaap:PreferredStockMemberenb:Series9PreferredStockMember2025-12-310000895728enb:RenewablePowerGenerationSegmentMemberus-gaap:OperatingSegmentsMemberenb:OtherRevenueMember2024-01-012024-12-310000895728us-gaap:FairValueInputsLevel3Memberus-gaap:MarketApproachValuationTechniqueMemberenb:PowerMemberenb:FinancialForwardCommodityContractMemberus-gaap:EstimateOfFairValueFairValueDisclosureMember2025-12-310000895728us-gaap:OperatingSegmentsMemberenb:GasTransmissionSegmentMember2024-12-310000895728enb:SeniorNotesDueMarch2056Memberenb:TheEastOhioGasCompanyEOGMember2025-12-310000895728enb:SeawayCrudePipelineSystemMember2024-01-012024-12-310000895728enb:OtherRegulatoryAssetsMember2025-12-310000895728enb:MaRenBakkenCompanyLLC1Memberus-gaap:InvesteeMember2025-12-310000895728enb:AlliancePipelineCanadaAndUSMemberenb:DisposalGroupAlliancePipelineAndAuxSableMember2024-03-310000895728enb:GasMainsServicesAndOtherMember2024-12-310000895728us-gaap:OtherCurrentLiabilitiesMemberus-gaap:NondesignatedMemberus-gaap:ForeignExchangeContractMember2025-12-310000895728us-gaap:PreferredStockMemberenb:Series15PreferredStockMember2025-01-012025-12-310000895728us-gaap:DerivativeMember2025-12-310000895728enb:GasDistributionSalesMemberus-gaap:OperatingSegmentsMemberenb:GasTransmissionSegmentMember2023-01-012023-12-310000895728enb:FloatingToFixedInterestRateSwapsMember2025-12-310000895728us-gaap:SeriesDPreferredStockMemberus-gaap:PreferredStockMember2024-12-310000895728enb:WhistlerParentJVMember2025-07-172025-07-170000895728country:US2024-12-310000895728us-gaap:SeriesGPreferredStockMemberus-gaap:PreferredStockMember2025-12-310000895728us-gaap:PensionPlansDefinedBenefitMemberus-gaap:DefinedBenefitPlanEquitySecuritiesNonUsMemberus-gaap:ForeignPlanMember2025-12-310000895728us-gaap:DesignatedAsHedgingInstrumentMemberus-gaap:OtherCurrentLiabilitiesMemberus-gaap:CommodityContractMemberus-gaap:FairValueHedgingMember2024-12-310000895728enb:ElectricityRevenueMember2023-01-012023-12-310000895728us-gaap:ForeignExchangeContractMemberus-gaap:OtherLiabilitiesMember2024-12-310000895728enb:DeferredAmountsAndOtherMemberus-gaap:InterestRateContractMember2024-12-310000895728us-gaap:PreferredStockMemberenb:Series1PreferredStockMember2024-12-310000895728us-gaap:PreferredStockMemberenb:SeriesPPreferredStockMember2023-12-310000895728us-gaap:PensionPlansDefinedBenefitMemberus-gaap:DefinedBenefitPlanCashAndCashEquivalentsMemberus-gaap:ForeignPlanMember2025-12-310000895728us-gaap:InterestRateContractMember2025-01-012025-12-310000895728us-gaap:PerformanceSharesMemberenb:TwoThousandAndTwentyThreePerformanceStockUnitsMember2025-12-310000895728country:US2023-01-012023-12-310000895728us-gaap:OperatingSegmentsMemberenb:OtherRevenueMemberenb:GasDistributionandStorageSegmentMember2023-01-012023-12-310000895728enb:RenewablePowerGenerationSegmentMemberus-gaap:OperatingSegmentsMemberenb:StorageandOtherRevenueMember2025-01-012025-12-3100008957282025-06-300000895728us-gaap:SeriesGPreferredStockMemberus-gaap:PreferredStockMember2024-12-310000895728us-gaap:PensionPlansDefinedBenefitMemberus-gaap:FairValueInputsLevel1Memberus-gaap:DefinedBenefitPlanCashAndCashEquivalentsMembercountry:CA2024-12-310000895728enb:DebenturesAndTermNotesMember2023-01-012023-12-310000895728enb:EnbridgeSouthernLightsLPMemberenb:A401SeniorNotesMember2025-06-012025-12-310000895728us-gaap:CommonStockMember2025-12-310000895728us-gaap:FairValueInputsLevel2Memberus-gaap:DebtSecuritiesMember2024-12-3100008957282023-12-310000895728enb:GasTransmissionSegmentMember2025-01-012025-12-310000895728us-gaap:TransferredAtPointInTimeMemberenb:GasDistributionandStorageSegmentMember2025-01-012025-12-310000895728us-gaap:PensionPlansDefinedBenefitMemberenb:DomesticGovernmentBondsMembercountry:CA2025-12-310000895728us-gaap:CommodityContractMemberus-gaap:OtherLiabilitiesMember2024-12-310000895728us-gaap:OtherCurrentLiabilitiesMemberus-gaap:CommodityContractMember2025-12-310000895728enb:TheEastOhioGasCompanyEOGMember2024-03-062024-03-060000895728enb:EquityFundsAndDebtSecuritiesMember2025-01-012025-12-310000895728enb:FutureRemovalAndSiteRestorationReservesMember2025-12-310000895728us-gaap:PreferredStockMemberenb:SeriesPPreferredStockMember2024-12-310000895728us-gaap:OperatingSegmentsMemberenb:TransportationRevenueMemberenb:LiquidsPipelinesSegmentMember2024-01-012024-12-310000895728us-gaap:NondesignatedMemberenb:TransportationRevenueMemberus-gaap:ForeignExchangeContractMember2024-01-012024-12-310000895728us-gaap:AssetUnderConstructionMember2025-01-012025-12-310000895728us-gaap:NondesignatedMember2025-12-310000895728country:US2025-01-012025-12-310000895728us-gaap:PreferredStockMemberus-gaap:SeriesBPreferredStockMember2025-01-012025-12-310000895728enb:ElectricityRevenueMemberus-gaap:OperatingSegmentsMemberenb:GasDistributionandStorageSegmentMember2024-01-012024-12-310000895728us-gaap:PensionPlansDefinedBenefitMembercountry:CA2025-01-012025-12-310000895728us-gaap:OperatingSegmentsMemberenb:GasTransmissionSegmentMember2025-01-012025-12-310000895728enb:EnbridgePipelinesIncMemberenb:A4.10MediumTermNotesMember2025-02-280000895728us-gaap:FairValueInputsLevel3Memberus-gaap:PensionPlansDefinedBenefitMemberus-gaap:DefinedBenefitPlanCashAndCashEquivalentsMembercountry:CA2025-12-310000895728enb:TheEastOhioGasCompanyEOGMember2023-01-012023-12-310000895728us-gaap:AccumulatedGainLossNetCashFlowHedgeParentMember2025-01-012025-12-310000895728enb:AlbertaAndOntarioMember2025-01-012025-12-310000895728us-gaap:PreferredStockMemberenb:Series4PreferredStockMember2024-12-310000895728us-gaap:OperatingSegmentsMemberenb:GasTransmissionSegmentMember2024-01-012024-12-310000895728enb:WoodfibreLNGLPMember2025-12-310000895728enb:QuestarGasCompanyMember2024-05-312024-12-310000895728us-gaap:FixedIncomeSecuritiesMemberus-gaap:ForeignPlanMember2025-12-310000895728enb:A2.50SeniorNotesMembersrt:ParentCompanyMember2025-01-012025-01-310000895728us-gaap:FairValueInputsLevel3Memberus-gaap:PensionPlansDefinedBenefitMemberenb:DefinedBenefitPlanEquitySecuritiesGlobalMemberus-gaap:ForeignPlanMember2024-12-310000895728us-gaap:FairValueInputsLevel2Memberus-gaap:ForeignPlanMemberus-gaap:OtherPostretirementBenefitPlansDefinedBenefitMemberus-gaap:EstimateOfFairValueFairValueDisclosureMember2025-12-310000895728enb:RenewablePowerGenerationSegmentMemberus-gaap:OperatingSegmentsMemberenb:TransportationRevenueMember2023-01-012023-12-310000895728us-gaap:PreferredStockMemberenb:Series3PreferredStockMember2024-12-310000895728enb:BiogasRightsAgreementsMember2025-12-310000895728enb:ElectricityRevenueMemberus-gaap:OperatingSegmentsMemberenb:GasDistributionandStorageSegmentMember2025-01-012025-12-310000895728us-gaap:PreferredStockMemberenb:Series15PreferredStockMember2025-12-310000895728us-gaap:AccumulatedTranslationAdjustmentMember2025-12-310000895728enb:RenewablePowerGenerationSegmentMember2023-01-012023-12-310000895728us-gaap:PensionPlansDefinedBenefitMemberus-gaap:FairValueInputsLevel1Memberus-gaap:ForeignPlanMember2025-12-310000895728enb:RenewablePowerGenerationSegmentMemberus-gaap:OperatingSegmentsMemberenb:CommoditySalesMember2025-01-012025-12-310000895728enb:GasDistributionandStorageSegmentMember2025-01-012025-12-310000895728us-gaap:DefinedBenefitPlanEquitySecuritiesNonUsMemberus-gaap:ForeignPlanMemberus-gaap:OtherPostretirementBenefitPlansDefinedBenefitMember2025-12-310000895728enb:GrayOakPipelineLLCMemberus-gaap:InvesteeMember2025-12-310000895728us-gaap:DesignatedAsHedgingInstrumentMemberus-gaap:InterestRateContractMemberus-gaap:FairValueHedgingMember2025-12-310000895728us-gaap:AccumulatedOtherComprehensiveIncomeMember2023-12-310000895728country:CH2024-01-012024-12-310000895728enb:GasDistributionandStorageSegmentMemberus-gaap:InvesteeMember2024-12-310000895728enb:OtherCounterpartiesMemberus-gaap:DerivativeMember2025-01-012025-12-310000895728us-gaap:ForeignExchangeContractMember2025-01-012025-12-310000895728us-gaap:NondesignatedMemberenb:OtherIncomeExpenseMemberus-gaap:ForeignExchangeContractMember2024-01-012024-12-310000895728us-gaap:CashFlowHedgingMember2025-01-012025-12-310000895728us-gaap:PensionPlansDefinedBenefitMemberenb:DefinedBenefitPlanAlternativesMemberus-gaap:FairValueInputsLevel1Memberus-gaap:ForeignPlanMember2024-12-310000895728us-gaap:ForeignExchangeContractMemberus-gaap:FairValueHedgingMember2025-01-012025-12-310000895728us-gaap:FairValueInputsLevel3Memberus-gaap:PensionPlansDefinedBenefitMembercountry:CA2023-12-310000895728enb:BiogasRightsAgreementsMembersrt:MinimumMember2025-01-012025-12-310000895728us-gaap:CommodityContractMember2024-01-012024-12-310000895728enb:WestcoastBCPipelineMemberenb:WestcoastEnergyLimitedPartnershipMember2025-12-310000895728us-gaap:OtherCurrentLiabilitiesMemberus-gaap:NondesignatedMember2025-12-310000895728enb:A377Medium-TermNotesMemberenb:WestcoastEnergyIncorporationMember2025-12-012025-12-310000895728srt:MinimumMember2025-01-012025-12-310000895728us-gaap:PreferredStockMemberenb:SeriesPPreferredStockMember2025-01-012025-12-310000895728us-gaap:FairValueInputsLevel3Memberus-gaap:PensionPlansDefinedBenefitMemberus-gaap:CorporateBondSecuritiesMembercountry:CA2025-12-310000895728enb:RenewableEnergyAssetsMember2025-12-310000895728us-gaap:RestrictedStockUnitsRSUMember2025-01-012025-12-310000895728enb:SeniorNotesDueMarch2036Memberenb:TheEastOhioGasCompanyEOGMember2025-12-310000895728enb:WestcoastEnergyLimitedPartnershipMemberenb:Stonlasec8IndigenousInvestmentsLimitedPartnershipMemberus-gaap:CapitalUnitClassAMember2025-07-022025-07-020000895728enb:AitkenCreekGasStorageFacilityMember2023-11-010000895728enb:RenewablePowerGenerationSegmentMemberus-gaap:TransferredOverTimeMember2023-01-012023-12-310000895728enb:IncentiveStockOptionsMember2023-01-012023-12-310000895728us-gaap:DefinedBenefitPlanEquitySecuritiesMembercountry:CA2025-12-310000895728us-gaap:EmployeeStockOptionMember2023-01-012023-12-310000895728enb:RenewablePowerGenerationSegmentMemberus-gaap:OperatingSegmentsMember2024-12-310000895728enb:PublicServiceCompanyOfNorthCarolinaIncorporatedMember2024-01-012024-12-310000895728us-gaap:DesignatedAsHedgingInstrumentMemberus-gaap:FairValueHedgingMember2025-12-310000895728us-gaap:FairValueInputsLevel3Memberus-gaap:MarketApproachValuationTechniqueMembersrt:CrudeOilMembersrt:MaximumMemberenb:FinancialForwardCommodityContractMember2025-12-310000895728us-gaap:DesignatedAsHedgingInstrumentMemberus-gaap:OtherLiabilitiesMemberus-gaap:FairValueHedgingMember2024-12-310000895728srt:MinimumMemberus-gaap:InvesteeMemberenb:OtherEquityInvesteeMemberenb:LiquidsPipelinesSegmentMember2025-12-310000895728us-gaap:FairValueInputsLevel2Memberus-gaap:PensionPlansDefinedBenefitMemberus-gaap:DefinedBenefitPlanEquitySecuritiesNonUsMembercountry:CA2025-12-310000895728us-gaap:OperatingSegmentsMemberenb:OtherRevenueMemberenb:LiquidsPipelinesSegmentMember2023-01-012023-12-310000895728country:US2025-01-012025-12-310000895728us-gaap:DesignatedAsHedgingInstrumentMemberus-gaap:OtherCurrentAssetsMemberus-gaap:CashFlowHedgingMemberus-gaap:CommodityContractMember2024-12-310000895728us-gaap:FairValueInputsLevel3Membersrt:WeightedAverageMemberenb:PhysicalForwardCommodityContractMemberus-gaap:MarketApproachValuationTechniqueMembersrt:CrudeOilMember2025-12-310000895728enb:A480SeniorNotesNoteTwoMemberenb:EnbridgeHoldingsTomorrowRNGLLCMember2025-12-310000895728enb:ProjectAgreementsMember2025-12-310000895728us-gaap:DesignatedAsHedgingInstrumentMemberenb:DeferredAmountsAndOtherMemberus-gaap:CommodityContractMemberus-gaap:FairValueHedgingMember2024-12-310000895728us-gaap:AccumulatedNetUnrealizedInvestmentGainLossMember2024-01-012024-12-310000895728enb:StorageandOtherRevenueMember2023-01-012023-12-310000895728enb:GasDistributionSalesMembersrt:ConsolidationEliminationsMember2024-01-012024-12-310000895728us-gaap:InvesteeMemberenb:BakkenPipelineSystemMemberenb:BakkenPipelineLLCMember2025-12-310000895728us-gaap:NondesignatedMemberus-gaap:ForeignExchangeContractMemberenb:OtherIncomeExpenseMember2023-01-012023-12-310000895728us-gaap:NondesignatedMemberenb:DeferredAmountsAndOtherMember2024-12-310000895728us-gaap:InvesteeMemberenb:GasTransmissionSegmentMemberenb:SabalTrailTransmissionLLCMember2024-12-310000895728us-gaap:PreferredStockMemberenb:Series5PreferredStockMember2024-12-310000895728enb:SpectraEnergyCorpMember2024-01-012024-12-310000895728enb:GrayOakPipelineLLCMemberus-gaap:InvesteeMemberenb:DCPMidstreamLLC1Member2025-12-310000895728us-gaap:NondesignatedMemberenb:TransportationRevenueMemberus-gaap:CommodityContractMember2024-01-012024-12-310000895728us-gaap:TransferredOverTimeMember2024-01-012024-12-310000895728enb:Series4PreferredStockMember2025-10-012025-12-310000895728enb:GasDistributionandStorageSegmentMemberus-gaap:InvesteeMemberenb:OtherEquityInvesteeMember2024-12-310000895728enb:HoheSeeAndAlbatrosOffshoreWindFacilitiesMemberenb:RenewablePowerGenerationSegmentMemberus-gaap:InvesteeMember2024-12-310000895728us-gaap:PreferredStockMemberenb:Series3PreferredStockMember2023-12-310000895728enb:GasDistributionSalesMemberus-gaap:OperatingSegmentsMemberenb:GasDistributionandStorageSegmentMember2023-01-012023-12-310000895728enb:MaRenBakkenCompanyLLC1Memberus-gaap:InvesteeMemberenb:LiquidsPipelinesSegmentMember2025-12-310000895728us-gaap:OperatingSegmentsMemberenb:OtherRevenueMemberenb:GasDistributionandStorageSegmentMember2024-01-012024-12-310000895728srt:ParentCompanyMemberenb:FloatingRateMediumTermNotesDueFebruary2028Member2025-01-012025-12-310000895728enb:GasDistributionSalesMemberus-gaap:OperatingSegmentsMemberenb:LiquidsPipelinesSegmentMember2024-01-012024-12-310000895728us-gaap:PensionPlansDefinedBenefitMemberus-gaap:FairValueInputsLevel1Memberenb:DomesticGovernmentBondsMemberus-gaap:ForeignPlanMember2025-12-310000895728enb:AccumulatedNetGainLossNetInvestmentHedgeParentMember2023-12-310000895728us-gaap:IntersegmentEliminationMemberenb:GasDistributionandStorageSegmentMember2025-01-012025-12-310000895728enb:MaritimesAndNortheastPipelineMember2024-12-310000895728enb:CommittedCreditFacilityMembersrt:ParentCompanyMember2025-12-310000895728enb:RenewablePowerGenerationSegmentMemberus-gaap:OperatingSegmentsMemberenb:StorageandOtherRevenueMember2023-01-012023-12-310000895728country:HU2024-01-012024-12-310000895728enb:DeferredAmountsAndOtherMember2024-12-310000895728enb:EnbridgeGasInc.Memberenb:CommercialPaperAndCreditFacilityDrawsMember2025-12-310000895728enb:RNGFacilitiesMember2024-01-020000895728enb:GasMainsServicesAndOtherMember2025-12-310000895728us-gaap:ForeignPlanMember2024-01-012024-12-310000895728enb:RenewablePowerGenerationSegmentMemberus-gaap:OperatingSegmentsMemberenb:TransportationRevenueMember2024-01-012024-12-310000895728enb:StorageandOtherRevenueMember2025-01-012025-12-310000895728us-gaap:ForeignPlanMember2023-01-012023-12-310000895728enb:RenewablePowerGenerationSegmentMemberus-gaap:InvesteeMember2024-12-310000895728us-gaap:FairValueInputsLevel2Memberus-gaap:PensionPlansDefinedBenefitMemberenb:DefinedBenefitPlanAlternativesMembercountry:CA2024-12-310000895728us-gaap:PensionPlansDefinedBenefitMemberus-gaap:ForeignPlanMember2025-01-012025-12-310000895728enb:BiogasRightsAgreementsMembersrt:MaximumMember2025-01-012025-12-310000895728enb:RenewablePowerGenerationSegmentMemberenb:FoxSquirrelSolarLLCMemberus-gaap:InvesteeMember2024-12-310000895728enb:A480SeniorNotesNoteOneMemberenb:EnbridgeHoldingsTomorrowRNGLLCMember2025-12-012025-12-310000895728us-gaap:InvesteeMemberenb:BakkenPipelineSystemMember2025-12-310000895728us-gaap:InterestRateContractMemberus-gaap:OtherLiabilitiesMember2025-12-310000895728us-gaap:OperatingSegmentsMemberenb:TransportationRevenueMemberenb:LiquidsPipelinesSegmentMember2023-01-012023-12-310000895728us-gaap:FairValueInputsLevel3Member2025-12-310000895728us-gaap:DesignatedAsHedgingInstrumentMemberus-gaap:OtherCurrentAssetsMemberus-gaap:CashFlowHedgingMemberus-gaap:CommodityContractMember2025-12-310000895728enb:DebtInstrumentInterestRateTermsPeriodTwoMembersrt:ParentCompanyMemberenb:FixedToFloatingSubordinatedTermNotesMember2025-01-012025-12-310000895728enb:EnbridgePipelinesIncMemberenb:FinanceLeaseObligationsMember2024-12-310000895728enb:FixedToFloatingInterestRateSwapsMember2025-12-310000895728us-gaap:PensionPlansDefinedBenefitMemberus-gaap:DefinedBenefitPlanEquitySecuritiesNonUsMembercountry:CA2025-12-310000895728enb:DeferredIncomeTaxesMember2024-12-310000895728srt:MinimumMemberenb:GasTransmissionSegmentMemberus-gaap:InvesteeMemberenb:OtherEquityInvesteeMember2025-12-310000895728us-gaap:PreferredStockMemberenb:Series9PreferredStockMember2024-12-310000895728us-gaap:EquityMethodInvestmentNonconsolidatedInvesteeOrGroupOfInvesteesMember2025-12-310000895728us-gaap:AociDerivativeQualifyingAsHedgeExcludedComponentParentMember2023-01-012023-12-310000895728us-gaap:FairValueInputsLevel3Memberus-gaap:PensionPlansDefinedBenefitMembercountry:CA2025-12-310000895728enb:IncentiveStockOptionsMember2025-01-012025-12-310000895728us-gaap:PreferredStockMemberenb:PreferenceSharesSeries19Member2024-12-310000895728us-gaap:FairValueInputsLevel3Membersrt:NaturalGasReservesMemberus-gaap:MarketApproachValuationTechniqueMemberenb:OptionsForwardCommodityContractMemberus-gaap:EstimateOfFairValueFairValueDisclosureMember2025-12-310000895728us-gaap:PensionPlansDefinedBenefitMemberus-gaap:FairValueInputsLevel1Memberenb:DomesticGovernmentBondsMembercountry:CA2024-12-310000895728us-gaap:RelatedPartyMember2024-12-310000895728enb:RNGFacilitiesMembersrt:MinimumMember2024-01-022024-01-020000895728us-gaap:FairValueInputsLevel2Memberus-gaap:InterestRateContractMemberus-gaap:EstimateOfFairValueFairValueDisclosureMember2025-12-310000895728us-gaap:DesignatedAsHedgingInstrumentMemberus-gaap:OtherCurrentAssetsMemberus-gaap:FairValueHedgingMember2024-12-310000895728us-gaap:PreferredStockMemberus-gaap:SeriesHPreferredStockMember2023-12-310000895728srt:AffiliatedEntityMemberus-gaap:VariableInterestEntityNotPrimaryBeneficiaryMemberenb:RampionOffshoreWindLimitedMember2024-12-310000895728enb:InterestRateContractForLongTermBorrowingsReceiveFixedRateMember2025-12-310000895728enb:SpectraEnergyPartnersLPMemberenb:A3.50SeniorNotesMember2025-03-310000895728enb:EuropeanFinancialInstitutionsMemberus-gaap:DerivativeMember2024-01-012024-12-310000895728srt:ConsolidationEliminationsMember2023-01-012023-12-310000895728us-gaap:SeriesGPreferredStockMemberus-gaap:PreferredStockMember2025-01-012025-12-310000895728enb:DefinedBenefitPlanAlternativesMemberus-gaap:ForeignPlanMember2024-12-310000895728us-gaap:PreferredStockMemberenb:Series13PreferredStockMember2023-12-310000895728enb:EnbridgeSouthernLightsLPMemberenb:A401SeniorNotesMember2025-12-310000895728srt:ParentCompanyMemberenb:FinanceLeaseObligationsMember2024-12-310000895728us-gaap:NondesignatedMemberus-gaap:ForeignExchangeContractMemberus-gaap:OtherLiabilitiesMember2024-12-310000895728us-gaap:PensionPlansDefinedBenefitMemberus-gaap:CorporateBondSecuritiesMemberus-gaap:ForeignPlanMember2024-12-310000895728us-gaap:FairValueInputsLevel3Membersrt:WeightedAverageMemberenb:PhysicalForwardCommodityContractMemberus-gaap:MarketApproachValuationTechniqueMembersrt:NaturalGasReservesMember2025-12-310000895728enb:DCPMidstreamLLCMemberenb:GasTransmissionSegmentMemberus-gaap:InvesteeMember2024-12-310000895728enb:OtherCountriesMember2025-01-012025-12-310000895728enb:GasTransmissionSegmentMember2024-12-310000895728us-gaap:ParentMember2023-12-310000895728us-gaap:DesignatedAsHedgingInstrumentMemberus-gaap:OtherCurrentAssetsMemberus-gaap:CashFlowHedgingMember2025-12-310000895728enb:RegulatoryAssetsPurchaseGasVarianceMember2025-12-310000895728country:CAus-gaap:OtherPostretirementBenefitPlansDefinedBenefitMember2024-12-310000895728enb:UncommittedCreditFacilityMembersrt:MaximumMember2025-01-012025-12-310000895728us-gaap:PreferredStockMemberenb:Three-MonthGovernmentOfCanadaTreasuryBillMemberenb:PreferenceSharesSeriesOMember2025-12-310000895728us-gaap:FairValueInputsLevel1Memberus-gaap:ForeignPlanMemberus-gaap:OtherPostretirementBenefitPlansDefinedBenefitMemberus-gaap:EstimateOfFairValueFairValueDisclosureMember2024-12-310000895728enb:EnbridgeGasOhioMemberus-gaap:GasDistributionMember2025-01-012025-12-310000895728enb:GasTransmissionSegmentMemberus-gaap:InvesteeMemberenb:GulfstreamNaturalGasSystemLLCMember2024-12-310000895728us-gaap:PreferredStockMemberenb:SeriesIPreferredStockMember2024-12-310000895728us-gaap:AccumulatedNetUnrealizedInvestmentGainLossMember2022-12-310000895728us-gaap:CashFlowHedgingMemberus-gaap:InterestRateContractMember2023-01-012023-12-310000895728us-gaap:FairValueInputsLevel1Memberus-gaap:DefinedBenefitPlanCashAndCashEquivalentsMemberus-gaap:ForeignPlanMemberus-gaap:OtherPostretirementBenefitPlansDefinedBenefitMemberus-gaap:EstimateOfFairValueFairValueDisclosureMember2024-12-310000895728us-gaap:SeniorNotesMemberenb:BlaurackeGMBHMember2025-12-310000895728us-gaap:FairValueInputsLevel2Memberus-gaap:CorporateBondSecuritiesMemberus-gaap:ForeignPlanMemberus-gaap:OtherPostretirementBenefitPlansDefinedBenefitMemberus-gaap:EstimateOfFairValueFairValueDisclosureMember2024-12-310000895728us-gaap:AccumulatedGainLossNetCashFlowHedgeParentMember2024-12-310000895728us-gaap:PensionPlansDefinedBenefitMemberus-gaap:DefinedBenefitPlanCashAndCashEquivalentsMembercountry:CA2024-12-310000895728us-gaap:OtherIntangibleAssetsMember2025-12-310000895728us-gaap:DesignatedAsHedgingInstrumentMemberus-gaap:CashFlowHedgingMemberenb:DeferredAmountsAndOtherMemberus-gaap:CommodityContractMember2025-12-310000895728us-gaap:FairValueInputsLevel3Membersrt:WeightedAverageMemberus-gaap:MarketApproachValuationTechniqueMembersrt:NaturalGasReservesMemberenb:OptionsForwardCommodityContractMember2025-12-310000895728enb:A210SeniorNotesMemberenb:BlaurackeGMBHMember2025-04-012025-10-310000895728us-gaap:EquityMethodInvestmentNonconsolidatedInvesteeOrGroupOfInvesteesMember2024-01-012024-12-310000895728enb:RestrictedLong-TermInvestmentsAndCashHeldInTrustMemberus-gaap:EstimateOfFairValueFairValueDisclosureMember2025-01-012025-12-310000895728enb:RenewablePowerGenerationSegmentMemberus-gaap:OperatingSegmentsMember2025-12-310000895728us-gaap:PreferredStockMemberenb:Series7PreferredStockMember2025-01-012025-12-310000895728us-gaap:TransferredAtPointInTimeMemberenb:LiquidsPipelinesSegmentMember2023-01-012023-12-310000895728us-gaap:PreferredStockMemberenb:PreferenceSharesSeries12Memberenb:Three-MonthGovernmentOfCanadaTreasuryBillMember2025-12-310000895728enb:DefinedBenefitPlanAlternativesMembercountry:CA2024-12-310000895728us-gaap:FairValueInputsLevel3Membersrt:WeightedAverageMemberus-gaap:MarketApproachValuationTechniqueMemberenb:PowerMemberenb:FinancialForwardCommodityContractMember2025-12-310000895728us-gaap:InvesteeMemberenb:OtherEquityInvesteeMemberenb:LiquidsPipelinesSegmentMember2024-12-310000895728us-gaap:NondesignatedMemberus-gaap:CommodityContractMemberus-gaap:OtherLiabilitiesMember2025-12-310000895728country:CH2023-01-012023-12-310000895728us-gaap:FairValueInputsLevel2Memberus-gaap:DebtSecuritiesMember2025-12-310000895728enb:RenewablePowerGenerationSegmentMemberus-gaap:InvesteeMemberenb:East-WestTieLimitedPartnershipMember2025-12-310000895728us-gaap:PreferredStockMemberenb:SeriesNPreferredStockMember2023-12-310000895728enb:RenewablePowerGenerationSegmentMemberenb:EIHSARLMemberus-gaap:InvesteeMember2024-12-310000895728us-gaap:DesignatedAsHedgingInstrumentMemberus-gaap:ForeignExchangeContractMemberus-gaap:CashFlowHedgingMemberus-gaap:OtherLiabilitiesMember2025-12-310000895728enb:SeawayCrudePipelineSystemMember2023-01-012023-12-310000895728us-gaap:PreferredStockMemberus-gaap:SeriesBPreferredStockMember2024-12-310000895728us-gaap:PipelinesMember2024-12-310000895728srt:MinimumMemberenb:WoodfibreLNGLPMember2025-01-012025-12-310000895728enb:PensionPlanPayableMember2024-12-310000895728enb:IllinoisExtensionPipelineCompanyLLCNotPrimaryBeneficiaryMemberus-gaap:InvesteeMemberenb:LiquidsPipelinesSegmentMember2024-12-310000895728us-gaap:DesignatedAsHedgingInstrumentMemberus-gaap:CashFlowHedgingMemberus-gaap:InterestRateContractMemberus-gaap:OtherLiabilitiesMember2025-12-310000895728us-gaap:FairValueInputsLevel3Memberus-gaap:CommodityContractMemberus-gaap:EstimateOfFairValueFairValueDisclosureMember2025-12-310000895728enb:RenewablePowerGenerationSegmentMemberus-gaap:OperatingSegmentsMember2025-01-012025-12-310000895728us-gaap:AccumulatedTranslationAdjustmentMember2024-12-310000895728enb:Saint-NazaireMemberus-gaap:InvesteeMember2021-03-180000895728us-gaap:FairValueInputsLevel1Memberus-gaap:CommodityContractMemberus-gaap:EstimateOfFairValueFairValueDisclosureMember2024-12-310000895728us-gaap:AccumulatedOtherComprehensiveIncomeMember2025-01-012025-12-310000895728us-gaap:AccumulatedNetUnrealizedInvestmentGainLossMember2025-12-310000895728us-gaap:OtherCurrentAssetsMember2025-12-310000895728enb:EnbridgeGasInc.Memberenb:Medium-TermNotesMember2025-12-310000895728us-gaap:DesignatedAsHedgingInstrumentMemberus-gaap:ForeignExchangeContractMemberus-gaap:CashFlowHedgingMember2025-12-310000895728enb:FacilitiesAndEquipmentMember2025-12-310000895728us-gaap:PreferredStockMemberenb:Series4PreferredStockMemberenb:Three-MonthGovernmentOfCanadaTreasuryBillMember2025-12-310000895728us-gaap:SeriesFPreferredStockMember2025-01-012025-12-310000895728us-gaap:FairValueInputsLevel2Memberus-gaap:PensionPlansDefinedBenefitMemberenb:DomesticGovernmentBondsMemberus-gaap:ForeignPlanMember2024-12-310000895728country:CAus-gaap:OtherPostretirementBenefitPlansDefinedBenefitMember2025-01-012025-12-310000895728us-gaap:SeniorNotesMemberenb:EastTennesseeNaturalGasLLCMember2025-12-310000895728us-gaap:PerformanceSharesMember2025-01-012025-12-310000895728us-gaap:AccumulatedDefinedBenefitPlansAdjustmentMember2023-01-012023-12-310000895728enb:EnbridgePipelinesIncMemberenb:Medium-TermNotesMember2025-12-310000895728enb:Series11PreferredStockMember2025-01-012025-03-310000895728enb:FiveYearCreditFacilitiesMemberus-gaap:RevolvingCreditFacilityMember2025-07-310000895728enb:NonRevolvingTermCreditFacilityMemberenb:WestcoastLPMember2025-12-310000895728enb:OtherEquityInvesteeMemberus-gaap:InvesteeMember2024-12-310000895728us-gaap:FairValueInputsLevel3Memberus-gaap:EstimateOfFairValueFairValueDisclosureMember2024-12-310000895728us-gaap:NondesignatedMemberus-gaap:ForeignExchangeContractMemberenb:TransportationRevenueMember2025-01-012025-12-310000895728enb:A4.97SeniorNotesNoteThreeMemberenb:EnbridgeHoldingsTomorrowRNGLLCMember2025-01-012025-01-310000895728us-gaap:OperatingSegmentsMemberenb:LiquidsPipelinesSegmentMember2025-12-310000895728enb:NexusGasTransmissionLLCMemberenb:GasTransmissionSegmentMemberus-gaap:InvesteeMember2024-12-310000895728enb:DefinedBenefitPlanAlternativesMemberus-gaap:ForeignPlanMemberus-gaap:OtherPostretirementBenefitPlansDefinedBenefitMemberus-gaap:EstimateOfFairValueFairValueDisclosureMember2025-12-310000895728enb:WhistlerParentJV1Memberus-gaap:InvesteeMemberenb:GasTransmissionSegmentMember2024-12-310000895728us-gaap:OperatingSegmentsMember2025-01-012025-12-310000895728enb:OtherRevenueMembersrt:ConsolidationEliminationsMember2023-01-012023-12-310000895728enb:RenewablePowerGenerationSegmentMemberus-gaap:TransferredAtPointInTimeMember2024-01-012024-12-310000895728us-gaap:AociDerivativeQualifyingAsHedgeExcludedComponentParentMember2023-12-310000895728enb:SeawayCrudePipelineSystemMember2025-01-012025-12-310000895728enb:RenewablePowerGenerationSegmentMembersrt:MinimumMemberus-gaap:InvesteeMemberenb:OtherEquityInvesteeMember2025-12-310000895728srt:ParentCompanyMemberenb:FixedToFixedTermSubordinatedTermNotesMember2025-12-310000895728enb:Medium-TermNotesMemberenb:WestcoastEnergyIncorporationMember2025-12-310000895728enb:EnbridgeGasOntarioMembersrt:MinimumMemberus-gaap:GasDistributionMember2025-01-012025-12-310000895728us-gaap:NondesignatedMemberus-gaap:ForeignExchangeContractMember2025-12-310000895728us-gaap:PreferredStockMemberenb:Series11PreferredStockMember2025-01-012025-12-310000895728us-gaap:FairValueInputsLevel2Memberus-gaap:PensionPlansDefinedBenefitMemberus-gaap:DefinedBenefitPlanEquitySecuritiesNonUsMembercountry:CA2024-12-310000895728us-gaap:OperatingSegmentsMemberenb:TransportationRevenueMemberenb:LiquidsPipelinesSegmentMember2025-01-012025-12-310000895728enb:RenewablePowerGenerationSegmentMemberenb:RampionOffshoreWindProjectMemberus-gaap:InvesteeMember2025-12-310000895728us-gaap:InvesteeMemberenb:GasTransmissionSegmentMembersrt:MaximumMemberenb:OffshoreJointVenturesMember2025-12-310000895728enb:Series4PreferredStockMember2025-07-012025-09-300000895728us-gaap:FairValueInputsLevel2Memberus-gaap:CorporateBondSecuritiesMemberus-gaap:ForeignPlanMemberus-gaap:OtherPostretirementBenefitPlansDefinedBenefitMemberus-gaap:EstimateOfFairValueFairValueDisclosureMember2025-12-310000895728us-gaap:AociDerivativeQualifyingAsHedgeExcludedComponentParentMember2024-01-012024-12-310000895728enb:BakkenPipelineInvestmentsLLCMemberus-gaap:InvesteeMemberenb:BakkenPipelineSystemMember2024-12-310000895728us-gaap:FixedIncomeSecuritiesMembercountry:CA2025-12-310000895728us-gaap:DesignatedAsHedgingInstrumentMemberus-gaap:OtherCurrentLiabilitiesMemberus-gaap:CashFlowHedgingMemberus-gaap:InterestRateContractMember2024-12-310000895728us-gaap:AccumulatedGainLossNetCashFlowHedgeParentMember2023-12-310000895728us-gaap:PreferredStockMember2022-12-310000895728us-gaap:VariableInterestEntityNotPrimaryBeneficiaryMember2025-12-310000895728enb:Series11PreferredStockMember2025-01-012025-12-310000895728enb:ElectricityRevenueMember2025-01-012025-12-310000895728srt:ParentCompanyMemberenb:Medium-TermNotesMember2025-12-310000895728us-gaap:DesignatedAsHedgingInstrumentMemberus-gaap:ForeignExchangeContractMemberus-gaap:CashFlowHedgingMemberenb:DeferredAmountsAndOtherMember2025-12-310000895728us-gaap:FairValueInputsLevel3Memberenb:PhysicalForwardCommodityContractMemberus-gaap:MarketApproachValuationTechniqueMembersrt:NaturalGasReservesMemberus-gaap:EstimateOfFairValueFairValueDisclosureMember2025-12-310000895728enb:EnbridgeGasOhioMemberus-gaap:GasDistributionMember2025-06-012025-06-300000895728enb:PublicServiceCompanyOfNorthCarolinaIncorporatedMember2024-10-012024-12-310000895728us-gaap:SupplementalEmployeeRetirementPlanDefinedBenefitMemberus-gaap:ForeignPlanMember2025-12-310000895728us-gaap:FairValueInputsLevel3Memberus-gaap:PensionPlansDefinedBenefitMemberenb:DefinedBenefitPlanEquitySecuritiesGlobalMemberus-gaap:ForeignPlanMember2025-12-310000895728us-gaap:FairValueInputsLevel1Memberus-gaap:CorporateBondSecuritiesMemberus-gaap:ForeignPlanMemberus-gaap:OtherPostretirementBenefitPlansDefinedBenefitMemberus-gaap:EstimateOfFairValueFairValueDisclosureMember2025-12-310000895728enb:RestrictedLong-TermInvestmentsAndCashHeldInTrustMemberus-gaap:EstimateOfFairValueFairValueDisclosureMember2024-01-012024-12-310000895728us-gaap:FairValueInputsLevel2Memberus-gaap:PensionPlansDefinedBenefitMemberenb:DomesticGovernmentBondsMembercountry:CA2025-12-310000895728enb:GasTransmissionSegmentMember2023-12-310000895728srt:ParentCompanyMemberenb:FloatingRateMediumTermNotesDueFebruary2028Member2025-02-280000895728us-gaap:AccumulatedTranslationAdjustmentMember2025-01-012025-12-310000895728us-gaap:PreferredStockMemberenb:Series1PreferredStockMember2025-01-012025-12-310000895728enb:SeawayPipelineMemberus-gaap:InvesteeMemberenb:LiquidsPipelinesSegmentMember2024-12-310000895728us-gaap:DesignatedAsHedgingInstrumentMemberus-gaap:CashFlowHedgingMemberus-gaap:OtherLiabilitiesMember2025-12-310000895728us-gaap:DefinedBenefitPlanEquitySecuritiesMemberus-gaap:ForeignPlanMember2024-12-310000895728us-gaap:PensionPlansDefinedBenefitMemberus-gaap:FairValueInputsLevel1Membercountry:CA2024-12-310000895728us-gaap:NondesignatedMemberus-gaap:OtherCurrentAssetsMemberus-gaap:CommodityContractMember2025-12-310000895728us-gaap:DesignatedAsHedgingInstrumentMemberus-gaap:ForeignExchangeContractMemberus-gaap:OtherCurrentAssetsMemberus-gaap:FairValueHedgingMember2025-12-310000895728us-gaap:FairValueInputsLevel3Memberus-gaap:PensionPlansDefinedBenefitMemberenb:DefinedBenefitPlanAlternativesMemberus-gaap:ForeignPlanMember2025-12-310000895728enb:AsianFinancialInstitutionsMemberus-gaap:DerivativeMember2025-01-012025-12-310000895728us-gaap:InterestRateContractMember2024-01-012024-12-310000895728us-gaap:ForeignPlanMember2025-12-310000895728us-gaap:OperatingSegmentsMemberenb:GasDistributionandStorageSegmentMember2024-12-310000895728us-gaap:SalesRevenueNetMemberenb:LargestNon-AffiliatedCustomerMemberus-gaap:CustomerConcentrationRiskMember2023-01-012023-12-310000895728us-gaap:DesignatedAsHedgingInstrumentMemberus-gaap:ForeignExchangeContractMemberus-gaap:OtherLiabilitiesMemberus-gaap:FairValueHedgingMember2025-12-310000895728us-gaap:SeriesGPreferredStockMemberus-gaap:PreferredStockMember2023-12-310000895728us-gaap:DesignatedAsHedgingInstrumentMemberus-gaap:CashFlowHedgingMemberenb:DeferredAmountsAndOtherMemberus-gaap:InterestRateContractMember2024-12-310000895728us-gaap:PensionPlansDefinedBenefitMemberenb:DomesticGovernmentBondsMemberus-gaap:ForeignPlanMember2024-12-310000895728enb:A364DayExtendibleCreditFacilityMemberus-gaap:RevolvingCreditFacilityMember2025-07-310000895728srt:ConsolidationEliminationsMemberenb:CommoditySalesMember2024-01-012024-12-310000895728enb:PublicServiceCompanyOfNorthCarolinaIncorporatedMember2024-09-300000895728us-gaap:ForeignPlanMemberus-gaap:OtherPostretirementBenefitPlansDefinedBenefitMemberus-gaap:EstimateOfFairValueFairValueDisclosureMember2024-12-310000895728enb:DebtInstrumentInterestRateTermsPeriodTwoMembersrt:ParentCompanyMemberenb:FixedToFixedTermSubordinatedTermNotesMember2025-01-012025-12-310000895728enb:WhistlerParentJVMemberenb:MPLXMember2024-05-290000895728us-gaap:ForeignPlanMemberus-gaap:OtherPostretirementBenefitPlansDefinedBenefitMember2023-12-310000895728enb:OtherEquityInvesteeMemberus-gaap:InvesteeMemberenb:LiquidsPipelinesSegmentMember2025-12-310000895728us-gaap:NondesignatedMemberus-gaap:CommodityContractMemberus-gaap:OtherLiabilitiesMember2024-12-310000895728enb:VectorPipelineLPNotPrimaryBeneficiaryMemberus-gaap:VariableInterestEntityNotPrimaryBeneficiaryMember2025-12-310000895728us-gaap:CommodityContractMemberus-gaap:OtherLiabilitiesMember2025-12-310000895728enb:RenewablePowerGenerationSegmentMemberus-gaap:InvesteeMemberenb:East-WestTieLimitedPartnershipMember2024-12-310000895728us-gaap:FairValueInputsLevel3Membersrt:WeightedAverageMemberenb:PhysicalForwardCommodityContractMemberus-gaap:MarketApproachValuationTechniqueMemberenb:PowerMember2025-12-310000895728us-gaap:ForeignExchangeContractMemberenb:DeferredAmountsAndOtherMember2025-12-310000895728us-gaap:DesignatedAsHedgingInstrumentMemberus-gaap:CommodityContractMemberus-gaap:OtherLiabilitiesMemberus-gaap:FairValueHedgingMember2024-12-310000895728enb:OtherRevenueMember2024-01-012024-12-310000895728us-gaap:IntersegmentEliminationMemberenb:GasDistributionandStorageSegmentMember2023-01-012023-12-310000895728us-gaap:FairValueInputsLevel1Memberus-gaap:ForeignExchangeContractMemberus-gaap:EstimateOfFairValueFairValueDisclosureMember2024-12-310000895728us-gaap:DesignatedAsHedgingInstrumentMemberus-gaap:ForeignExchangeContractMemberus-gaap:OtherCurrentAssetsMemberus-gaap:CashFlowHedgingMember2024-12-310000895728us-gaap:SupplementalEmployeeRetirementPlanDefinedBenefitMembercountry:CA2024-12-310000895728us-gaap:InvesteeMemberenb:FecampMember2021-03-1800008957282025-04-012025-06-300000895728us-gaap:FairValueInputsLevel1Memberus-gaap:CommodityContractMemberus-gaap:EstimateOfFairValueFairValueDisclosureMember2025-12-310000895728enb:EnbridgeGasOntarioMembersrt:MaximumMemberus-gaap:GasDistributionMember2025-01-012025-12-310000895728us-gaap:SeniorNotesMemberenb:EnbridgeHoldingsTomorrowRNGLLCMember2025-12-310000895728enb:QuestarGasCompanyMember2023-01-012023-12-310000895728enb:RenewablePowerGenerationSegmentMemberus-gaap:TransferredAtPointInTimeMember2025-01-012025-12-310000895728us-gaap:ForeignExchangeContractMemberus-gaap:FairValueHedgingMember2024-01-012024-12-310000895728us-gaap:ForeignExchangeContractMemberus-gaap:OtherCurrentAssetsMember2025-12-310000895728us-gaap:NondesignatedMemberus-gaap:InterestRateContractMember2025-12-310000895728us-gaap:VariableInterestEntityPrimaryBeneficiaryMember2024-12-310000895728us-gaap:PerformanceSharesMember2024-01-012024-12-310000895728stpr:CA-ON2024-01-012024-12-310000895728us-gaap:PensionPlansDefinedBenefitMemberus-gaap:ForeignPlanMember2023-12-310000895728us-gaap:FairValueInputsLevel2Memberus-gaap:PensionPlansDefinedBenefitMembercountry:CA2025-12-310000895728us-gaap:NondesignatedMemberus-gaap:CommodityContractMember2024-12-310000895728enb:EnbridgeGasInc.Memberenb:A364DayExtendibleCreditFacilityMemberenb:CommittedCreditFacilityMember2025-07-310000895728enb:WhistlerParentJV1Memberus-gaap:VariableInterestEntityNotPrimaryBeneficiaryMember2024-12-310000895728us-gaap:OperatingSegmentsMemberenb:GasDistributionandStorageSegmentMember2024-01-012024-12-310000895728us-gaap:RestrictedStockUnitsRSUMember2024-12-310000895728us-gaap:TransferredOverTimeMemberenb:GasTransmissionSegmentMember2025-01-012025-12-310000895728us-gaap:PerformanceSharesMember2025-12-310000895728enb:RenewablePowerGenerationSegmentMemberus-gaap:OperatingSegmentsMemberenb:CommoditySalesMember2024-01-012024-12-310000895728us-gaap:DesignatedAsHedgingInstrumentMemberus-gaap:CashFlowHedgingMemberus-gaap:InterestRateContractMember2024-12-310000895728enb:RenewablePowerGenerationSegmentMember2025-01-012025-12-310000895728enb:CommoditySalesRevenueMember2023-01-012023-12-310000895728us-gaap:NondesignatedMemberus-gaap:OtherCurrentAssetsMember2024-12-310000895728us-gaap:FairValueInputsLevel3Memberus-gaap:PensionPlansDefinedBenefitMemberenb:DomesticGovernmentBondsMemberus-gaap:ForeignPlanMember2025-12-310000895728enb:VectorPipelineLPNotPrimaryBeneficiaryMembersrt:AffiliatedEntityMemberus-gaap:VariableInterestEntityNotPrimaryBeneficiaryMember2025-12-310000895728enb:AtTheMarketOfferingMember2024-05-152024-07-310000895728enb:EnbridgeGasInc.Memberenb:A331Medium-TermNotesMember2025-09-012025-09-300000895728us-gaap:PreferredStockMemberenb:Series13PreferredStockMember2025-01-012025-12-310000895728us-gaap:SeniorNotesMemberenb:EnbridgeEnergyPartnersLPMember2025-12-310000895728us-gaap:SeriesDPreferredStockMember2025-01-012025-12-310000895728enb:Series1PreferredStockMember2025-01-012025-12-310000895728enb:IncentiveStockOptionsMember2024-01-012024-12-310000895728enb:GasDistributionSalesMemberus-gaap:OperatingSegmentsMemberenb:GasTransmissionSegmentMember2024-01-012024-12-310000895728us-gaap:PensionPlansDefinedBenefitMemberus-gaap:FairValueInputsLevel1Memberenb:DomesticGovernmentBondsMemberus-gaap:ForeignPlanMember2024-12-310000895728us-gaap:AccumulatedOtherComprehensiveIncomeMember2023-01-012023-12-310000895728srt:ConsolidationEliminationsMember2024-01-012024-12-310000895728enb:MaRenBakkenCompanyLLCMemberenb:BakkenPipelineLLC1Memberus-gaap:InvesteeMember2025-12-310000895728us-gaap:FairValueInputsLevel3Memberus-gaap:PensionPlansDefinedBenefitMemberus-gaap:ForeignPlanMember2024-01-012024-12-310000895728us-gaap:FairValueInputsLevel2Memberenb:DomesticGovernmentBondsMemberus-gaap:ForeignPlanMemberus-gaap:OtherPostretirementBenefitPlansDefinedBenefitMemberus-gaap:EstimateOfFairValueFairValueDisclosureMember2024-12-310000895728enb:LandAndRightOfWayMember2024-12-310000895728us-gaap:PreferredStockMemberenb:SeriesIPreferredStockMember2025-01-012025-12-310000895728enb:GasDistributionandStorageSegmentMember2023-12-310000895728us-gaap:PipelinesMember2025-12-310000895728enb:CanadianProvincialMember2023-01-012023-12-310000895728enb:A364DayExtendibleCreditFacilityMemberenb:CommittedCreditFacilityMemberenb:EnbridgePipelinesIncMember2025-07-310000895728srt:ParentCompanyMemberenb:Medium-TermNotesDueFebruary2028Member2025-02-280000895728us-gaap:OtherCurrentLiabilitiesMemberus-gaap:NondesignatedMemberus-gaap:InterestRateContractMember2025-12-310000895728enb:TransportationRevenueMembersrt:ConsolidationEliminationsMember2025-01-012025-12-310000895728us-gaap:OtherCurrentLiabilitiesMemberus-gaap:NondesignatedMemberus-gaap:InterestRateContractMember2024-12-310000895728us-gaap:PreferredStockMemberenb:Three-MonthGovernmentOfCanadaTreasuryBillMemberenb:PreferenceSharesSeriesSMember2025-12-310000895728enb:Medium-TermNotesMemberenb:WestcoastEnergyIncorporationMember2024-12-310000895728us-gaap:PreferredStockMemberenb:SeriesNPreferredStockMember2025-01-012025-12-310000895728us-gaap:NoncontrollingInterestMember2025-12-310000895728enb:RenewablePowerGenerationSegmentMemberus-gaap:IntersegmentEliminationMember2023-01-012023-12-310000895728enb:EnbridgeGasInc.Memberenb:Medium-TermNotesMember2024-12-310000895728enb:UnderRecoveryOfFuelCostsMember2024-12-310000895728us-gaap:InvesteeMember2024-12-310000895728us-gaap:PreferredStockMemberenb:Three-MonthGovernmentOfCanadaTreasuryBillMemberenb:PreferenceSharesSeries14Member2025-12-310000895728srt:ParentCompanyMemberenb:FixedToFixedSubordinatedNotesDueDecember2055Member2025-09-300000895728us-gaap:DesignatedAsHedgingInstrumentMemberus-gaap:CashFlowHedgingMemberus-gaap:CommodityContractMemberus-gaap:OtherLiabilitiesMember2024-12-310000895728us-gaap:EstimateOfFairValueFairValueDisclosureMember2025-12-310000895728us-gaap:PerformanceSharesMemberenb:TwoThousandAndTwentyFourPerformanceStockUnitsMember2025-12-310000895728us-gaap:TransferredAtPointInTimeMemberenb:GasTransmissionSegmentMember2023-01-012023-12-310000895728enb:CommoditySalesMemberus-gaap:NondesignatedMemberus-gaap:CommodityContractMember2024-01-012024-12-310000895728us-gaap:NondesignatedMemberus-gaap:OtherLiabilitiesMember2025-12-310000895728us-gaap:OtherContractMemberus-gaap:CashFlowHedgingMember2025-01-012025-12-310000895728enb:GasTransmissionSegmentMemberus-gaap:InvesteeMember2024-12-310000895728srt:AffiliatedEntityMemberus-gaap:VariableInterestEntityNotPrimaryBeneficiaryMemberenb:RampionOffshoreWindLimitedMember2025-12-310000895728us-gaap:ForeignPlanMemberus-gaap:OtherPostretirementBenefitPlansDefinedBenefitMemberus-gaap:EstimateOfFairValueFairValueDisclosureMember2025-12-310000895728us-gaap:FairValueInputsLevel1Memberus-gaap:CorporateBondSecuritiesMemberus-gaap:ForeignPlanMemberus-gaap:OtherPostretirementBenefitPlansDefinedBenefitMemberus-gaap:EstimateOfFairValueFairValueDisclosureMember2024-12-310000895728us-gaap:NondesignatedMemberus-gaap:ForeignExchangeContractMemberenb:DeferredAmountsAndOtherMember2025-12-310000895728us-gaap:PreferredStockMemberenb:Three-MonthUSGovernmentTreasuryBillMemberenb:PreferenceSharesSeriesMMember2025-12-310000895728enb:CommoditySalesRevenueMember2025-01-012025-12-310000895728us-gaap:FairValueInputsLevel2Memberus-gaap:InterestRateContractMemberus-gaap:EstimateOfFairValueFairValueDisclosureMember2024-12-310000895728us-gaap:OperatingSegmentsMemberenb:GasTransmissionSegmentMemberenb:CommoditySalesMember2023-01-012023-12-310000895728enb:RegulatoryAssetsLongTermDebtMember2024-12-310000895728us-gaap:FairValueInputsLevel3Memberus-gaap:MarketApproachValuationTechniqueMembersrt:MinimumMemberenb:PowerMemberenb:FinancialForwardCommodityContractMember2025-12-310000895728enb:DomesticGovernmentBondsMemberus-gaap:ForeignPlanMemberus-gaap:OtherPostretirementBenefitPlansDefinedBenefitMemberus-gaap:EstimateOfFairValueFairValueDisclosureMember2025-12-310000895728us-gaap:TransferredAtPointInTimeMemberenb:GasDistributionandStorageSegmentMember2024-01-012024-12-310000895728enb:PublicOfferingMember2023-09-080000895728enb:Series4PreferredStockMember2024-09-012024-09-010000895728us-gaap:FairValueInputsLevel3Memberus-gaap:DefinedBenefitPlanEquitySecuritiesNonUsMemberus-gaap:ForeignPlanMemberus-gaap:OtherPostretirementBenefitPlansDefinedBenefitMember2024-12-310000895728enb:GasDistributionandStorageSegmentMember2025-12-310000895728us-gaap:PensionPlansDefinedBenefitMemberus-gaap:DefinedBenefitPlanCashAndCashEquivalentsMemberus-gaap:ForeignPlanMember2024-12-310000895728us-gaap:NondesignatedMemberus-gaap:InterestRateContractMember2024-12-310000895728us-gaap:PensionPlansDefinedBenefitMemberus-gaap:DefinedBenefitPlanEquitySecuritiesNonUsMembercountry:CA2024-12-310000895728us-gaap:IntersegmentEliminationMemberenb:LiquidsPipelinesSegmentMember2024-01-012024-12-310000895728enb:Medium-TermNotesDueSeptember2035Memberenb:EnbridgeGasInc.Member2025-09-300000895728us-gaap:SeriesDPreferredStockMemberus-gaap:PreferredStockMember2025-12-310000895728us-gaap:IntersegmentEliminationMember2025-01-012025-12-310000895728enb:EnbridgeGasOhioMemberus-gaap:GasDistributionMember2025-12-012025-12-310000895728us-gaap:OperatingSegmentsMemberenb:OtherRevenueMemberenb:GasDistributionandStorageSegmentMember2025-01-012025-12-310000895728enb:CommoditySalesMemberus-gaap:NondesignatedMemberus-gaap:CommodityContractMember2025-01-012025-12-310000895728us-gaap:DesignatedAsHedgingInstrumentMemberus-gaap:OtherLiabilitiesMemberus-gaap:FairValueHedgingMember2025-12-310000895728enb:GasDistributionSalesMemberus-gaap:OperatingSegmentsMemberenb:GasDistributionandStorageSegmentMember2024-01-012024-12-310000895728enb:DisposalGroupAlliancePipelineAndAuxSableMember2024-01-012024-12-310000895728enb:EnbridgeGasInc.Memberenb:A885Medium-TermNotesMember2025-10-310000895728us-gaap:CashFlowHedgingMemberus-gaap:InterestRateContractMember2024-01-012024-12-310000895728us-gaap:ForeignExchangeContractMember2023-01-012023-12-310000895728us-gaap:OperatingSegmentsMemberenb:LiquidsPipelinesSegmentMember2023-01-012023-12-310000895728us-gaap:OperatingSegmentsMemberenb:CommoditySalesMemberenb:LiquidsPipelinesSegmentMember2023-01-012023-12-310000895728us-gaap:NondesignatedMemberus-gaap:ForeignExchangeContractMemberus-gaap:OtherLiabilitiesMember2025-12-310000895728us-gaap:ForeignPlanMember2025-01-012025-12-310000895728us-gaap:PreferredStockMemberus-gaap:SeriesHPreferredStockMember2025-01-012025-12-310000895728us-gaap:InProcessResearchAndDevelopmentMember2025-12-310000895728us-gaap:CommonStockMemberenb:AtTheMarketOfferingMember2024-05-152024-07-310000895728us-gaap:FairValueInputsLevel3Memberus-gaap:ForeignPlanMemberus-gaap:OtherPostretirementBenefitPlansDefinedBenefitMemberus-gaap:EstimateOfFairValueFairValueDisclosureMember2024-12-310000895728enb:WhistlerParentJV1Memberenb:GasTransmissionSegmentMemberus-gaap:InvesteeMember2025-12-310000895728us-gaap:InterestRateContractMember2024-12-310000895728us-gaap:OtherCurrentLiabilitiesMemberus-gaap:NondesignatedMemberus-gaap:ForeignExchangeContractMember2024-12-310000895728us-gaap:OperatingSegmentsMemberenb:TransportationRevenueMemberenb:GasTransmissionSegmentMember2023-01-012023-12-310000895728us-gaap:DomesticCountryMember2023-01-012023-12-310000895728us-gaap:OtherContractMemberus-gaap:NondesignatedMember2025-01-012025-12-310000895728us-gaap:FairValueInputsLevel2Memberus-gaap:CommodityContractMemberus-gaap:EstimateOfFairValueFairValueDisclosureMember2025-12-310000895728enb:TransportationRevenueMembersrt:ConsolidationEliminationsMember2024-01-012024-12-310000895728us-gaap:AccumulatedNetUnrealizedInvestmentGainLossMember2023-01-012023-12-310000895728us-gaap:FairValueInputsLevel3Memberus-gaap:PensionPlansDefinedBenefitMemberus-gaap:ForeignPlanMember2023-12-310000895728enb:Series15PreferredStockMember2025-07-012025-09-300000895728us-gaap:NondesignatedMemberus-gaap:ForeignExchangeContractMemberenb:OtherIncomeExpenseMember2025-01-012025-12-310000895728us-gaap:PreferredStockMemberenb:Series13PreferredStockMember2025-12-310000895728us-gaap:PreferredStockMember2025-01-012025-12-310000895728us-gaap:FairValueInputsLevel2Memberus-gaap:DefinedBenefitPlanCashAndCashEquivalentsMemberus-gaap:ForeignPlanMemberus-gaap:OtherPostretirementBenefitPlansDefinedBenefitMemberus-gaap:EstimateOfFairValueFairValueDisclosureMember2024-12-310000895728us-gaap:AociDerivativeQualifyingAsHedgeExcludedComponentParentMemberus-gaap:ForeignExchangeContractMember2023-01-012023-12-310000895728us-gaap:AccumulatedDefinedBenefitPlansAdjustmentMember2024-01-012024-12-310000895728us-gaap:RelatedPartyMember2025-12-310000895728enb:CommoditySalesMember2025-01-012025-12-310000895728us-gaap:FairValueInputsLevel2Memberus-gaap:PensionPlansDefinedBenefitMemberus-gaap:CorporateBondSecuritiesMemberus-gaap:ForeignPlanMember2025-12-310000895728us-gaap:PreferredStockMemberenb:Series11PreferredStockMember2024-12-310000895728srt:ParentCompanyMemberenb:A244Medium-TermNotesMember2025-06-300000895728us-gaap:NondesignatedMemberus-gaap:InterestRateContractMemberus-gaap:OtherLiabilitiesMember2024-12-310000895728us-gaap:FixedIncomeSecuritiesMembercountry:CA2024-12-310000895728enb:A4.97SeniorNotesNoteTwoMemberenb:EnbridgeHoldingsTomorrowRNGLLCMember2025-01-310000895728us-gaap:ForeignExchangeContractMemberus-gaap:FairValueHedgingMember2023-01-012023-12-310000895728us-gaap:OperatingSegmentsMemberenb:CommoditySalesMemberenb:GasTransmissionSegmentMember2025-01-012025-12-310000895728enb:EnbridgeGasOhioMemberus-gaap:GasDistributionMember2025-06-300000895728us-gaap:OtherCurrentAssetsMemberus-gaap:InterestRateContractMember2025-12-310000895728us-gaap:OperatingSegmentsMemberenb:CommoditySalesMemberenb:LiquidsPipelinesSegmentMember2024-01-012024-12-310000895728us-gaap:ForeignExchangeContractMember2024-12-310000895728us-gaap:FairValueInputsLevel1Member2024-12-310000895728us-gaap:FairValueInputsLevel3Memberus-gaap:CorporateBondSecuritiesMemberus-gaap:ForeignPlanMemberus-gaap:OtherPostretirementBenefitPlansDefinedBenefitMemberus-gaap:EstimateOfFairValueFairValueDisclosureMember2025-12-310000895728enb:EnbridgeSouthernLightsLPMemberenb:A401SeniorNotesMember2025-06-300000895728enb:DebenturesMemberenb:WestcoastEnergyIncorporationMember2025-12-310000895728srt:CrudeOilMemberus-gaap:CommodityContractMember2024-12-310000895728us-gaap:SupplementalEmployeeRetirementPlanDefinedBenefitMembercountry:CA2025-12-310000895728us-gaap:FairValueInputsLevel3Memberus-gaap:PensionPlansDefinedBenefitMemberenb:DefinedBenefitPlanAlternativesMembercountry:CA2024-12-310000895728enb:GasMainsServicesAndOtherMember2025-01-012025-12-310000895728us-gaap:FairValueInputsLevel3Memberus-gaap:MarketApproachValuationTechniqueMembersrt:MinimumMemberenb:OptionsForwardCommodityContractMember2025-12-310000895728us-gaap:DesignatedAsHedgingInstrumentMemberus-gaap:OtherCurrentAssetsMemberus-gaap:ForeignExchangeContractMemberus-gaap:FairValueHedgingMember2024-12-310000895728us-gaap:TransferredAtPointInTimeMemberenb:LiquidsPipelinesSegmentMember2025-01-012025-12-310000895728us-gaap:FairValueInputsLevel3Memberus-gaap:DefinedBenefitPlanCashAndCashEquivalentsMemberus-gaap:ForeignPlanMemberus-gaap:OtherPostretirementBenefitPlansDefinedBenefitMemberus-gaap:EstimateOfFairValueFairValueDisclosureMember2025-12-310000895728us-gaap:FairValueInputsLevel3Memberus-gaap:ForeignExchangeContractMemberus-gaap:EstimateOfFairValueFairValueDisclosureMember2025-12-310000895728enb:OtherRevenueMember2025-01-012025-12-310000895728us-gaap:VariableInterestEntityNotPrimaryBeneficiaryMemberenb:RampionOffshoreWindLimitedMember2025-12-310000895728enb:PowerMemberus-gaap:CommodityContractMember2024-12-310000895728us-gaap:FairValueInputsLevel2Memberus-gaap:PensionPlansDefinedBenefitMemberenb:DefinedBenefitPlanAlternativesMemberus-gaap:ForeignPlanMember2025-12-310000895728us-gaap:FairValueInputsLevel3Memberus-gaap:PensionPlansDefinedBenefitMemberus-gaap:DefinedBenefitPlanCashAndCashEquivalentsMemberus-gaap:ForeignPlanMember2024-12-310000895728us-gaap:OtherCurrentLiabilitiesMemberus-gaap:NondesignatedMemberus-gaap:CommodityContractMember2024-12-310000895728enb:NexusGasTransmissionLLCMemberenb:GasTransmissionSegmentMemberus-gaap:InvesteeMember2025-12-310000895728enb:DebenturesAndTermNotesMember2024-01-012024-12-310000895728us-gaap:DesignatedAsHedgingInstrumentMemberus-gaap:ForeignExchangeContractMemberus-gaap:CashFlowHedgingMemberus-gaap:OtherLiabilitiesMember2024-12-310000895728us-gaap:OperatingSegmentsMemberenb:StorageandOtherRevenueMemberenb:LiquidsPipelinesSegmentMember2024-01-012024-12-310000895728enb:DemandSideManagementCostsMember2025-12-310000895728us-gaap:FairValueInputsLevel1Memberus-gaap:ForeignExchangeContractMemberus-gaap:EstimateOfFairValueFairValueDisclosureMember2025-12-310000895728us-gaap:FairValueInputsLevel2Memberus-gaap:DefinedBenefitPlanEquitySecuritiesNonUsMemberus-gaap:ForeignPlanMemberus-gaap:OtherPostretirementBenefitPlansDefinedBenefitMember2024-12-310000895728us-gaap:InvesteeMember2024-01-012024-12-310000895728enb:RenewablePowerGenerationSegmentMemberus-gaap:OperatingSegmentsMember2023-01-012023-12-310000895728us-gaap:FairValueInputsLevel3Memberus-gaap:EstimateOfFairValueFairValueDisclosureMember2025-12-310000895728us-gaap:AdditionalPaidInCapitalMember2025-12-310000895728us-gaap:IntersegmentEliminationMemberenb:GasTransmissionSegmentMember2024-01-012024-12-310000895728enb:WestcoastEnergyIncorporationMemberenb:A885DebenturesMember2025-07-012025-07-310000895728us-gaap:SeriesAPreferredStockMember2025-01-012025-12-310000895728enb:A377Medium-TermNotesMemberenb:WestcoastEnergyIncorporationMember2025-12-310000895728enb:CalvadosMemberus-gaap:InvesteeMember2021-03-180000895728us-gaap:InvesteeMemberenb:DCPMidstreamLPMember2025-12-310000895728enb:OperatingAndAdministrativeExpenseMemberus-gaap:NondesignatedMemberus-gaap:CommodityContractMember2023-01-012023-12-310000895728us-gaap:FairValueInputsLevel3Memberus-gaap:MarketApproachValuationTechniqueMemberenb:OptionsForwardCommodityContractMembersrt:MaximumMember2025-12-310000895728us-gaap:NondesignatedMemberus-gaap:InterestRateContractMember2025-01-012025-12-310000895728enb:EnbridgeGasInc.Memberenb:A319Medium-TermNotesMember2025-09-300000895728srt:ParentCompanyMemberenb:SeniorNotesDueJune2028Member2025-06-300000895728enb:AitkenCreekGasStorageFacilityAndAitkenCreekNorthGasStorageFacilityMember2023-11-012023-11-010000895728us-gaap:TransferredAtPointInTimeMemberenb:GasDistributionandStorageSegmentMember2023-01-012023-12-310000895728us-gaap:PreferredStockMemberenb:Series4PreferredStockMember2023-12-310000895728us-gaap:AdditionalPaidInCapitalMember2024-12-310000895728srt:ParentCompanyMemberenb:A2.50SeniorNotesMember2025-02-012025-02-280000895728enb:NegativeSalvageMember2025-12-310000895728us-gaap:CommodityContractMemberus-gaap:AccumulatedGainLossNetCashFlowHedgeParentMember2024-01-012024-12-310000895728enb:RenewablePowerGenerationSegmentMemberus-gaap:InvesteeMemberenb:East-WestTieLimitedPartnershipMember2025-03-042025-03-040000895728enb:OtherNonControllingInterestMember2024-12-310000895728us-gaap:CommodityContractMember2025-12-310000895728us-gaap:OtherContractMemberus-gaap:CashFlowHedgingMember2023-01-012023-12-310000895728enb:SeriesRPreferredStockMember2025-01-012025-12-310000895728enb:OtherNotPrimaryBeneficiaryMemberus-gaap:VariableInterestEntityNotPrimaryBeneficiaryMember2024-12-310000895728country:CA2023-01-012023-12-310000895728enb:InterestRateContractForShortTermBorrowingsPayFixedRateMember2024-12-310000895728enb:DeferredAmountsAndOtherMemberus-gaap:InterestRateContractMember2025-12-310000895728enb:UncommittedCreditFacilityMembersrt:MinimumMember2025-01-012025-12-310000895728us-gaap:SeniorNotesMemberenb:EnbridgeEnergyPartnersLPMember2024-12-310000895728us-gaap:PreferredStockMemberenb:SeriesRPreferredStockMember2023-12-310000895728us-gaap:FairValueInputsLevel3Memberus-gaap:ForeignPlanMemberus-gaap:OtherPostretirementBenefitPlansDefinedBenefitMember2025-01-012025-12-310000895728us-gaap:FairValueInputsLevel1Memberenb:DomesticGovernmentBondsMemberus-gaap:ForeignPlanMemberus-gaap:OtherPostretirementBenefitPlansDefinedBenefitMemberus-gaap:EstimateOfFairValueFairValueDisclosureMember2024-12-310000895728us-gaap:DesignatedAsHedgingInstrumentMemberus-gaap:OtherCurrentLiabilitiesMemberus-gaap:ForeignExchangeContractMemberus-gaap:FairValueHedgingMember2025-12-310000895728enb:RegulatoryLiabilityRelatedToUSIncomeTaxesMember2024-12-310000895728enb:FacilitiesAndEquipmentMember2024-12-310000895728srt:MaximumMember2024-01-012024-12-310000895728enb:GasDistributionandStorageSegmentMemberenb:OtherEquityInvesteeMemberus-gaap:InvesteeMembersrt:MaximumMember2025-12-310000895728us-gaap:PensionPlansDefinedBenefitMemberenb:DefinedBenefitPlanAlternativesMembercountry:CA2024-12-310000895728country:HU2023-01-012023-12-310000895728enb:HoheSeeAndAlbatrosOffshoreWindFacilitiesMemberenb:RenewablePowerGenerationSegmentMemberus-gaap:InvesteeMember2025-12-310000895728enb:WindTurbinesSolarPanelsAndOtherMember2024-12-310000895728us-gaap:InvesteeMember2025-12-310000895728us-gaap:OtherContractMemberus-gaap:FairValueInputsLevel2Memberus-gaap:EstimateOfFairValueFairValueDisclosureMember2024-12-310000895728enb:Series13PreferredStockMember2025-01-012025-12-310000895728us-gaap:PensionPlansDefinedBenefitMemberus-gaap:DefinedBenefitPlanCashAndCashEquivalentsMemberus-gaap:FairValueInputsLevel1Membercountry:CA2025-12-3100008957282026-02-060000895728enb:DebenturesMemberenb:WestcoastEnergyIncorporationMember2024-12-310000895728enb:CanadianFinancialInstitutionsMemberus-gaap:DerivativeMember2025-01-012025-12-310000895728enb:RegulatoryLiabilityRelatedToUSIncomeTaxesMember2025-12-310000895728us-gaap:TransferredAtPointInTimeMember2025-01-012025-12-310000895728enb:PipelineFutureAbandonmentCostsMember2025-12-310000895728us-gaap:FairValueInputsLevel2Memberus-gaap:PensionPlansDefinedBenefitMemberus-gaap:ForeignPlanMember2024-12-310000895728srt:ParentCompanyMemberenb:FloatingRateNoteMember2025-12-310000895728us-gaap:FairValueInputsLevel3Memberenb:PhysicalForwardCommodityContractMemberus-gaap:MarketApproachValuationTechniqueMembersrt:CrudeOilMemberus-gaap:EstimateOfFairValueFairValueDisclosureMember2025-12-310000895728us-gaap:FairValueInputsLevel3Memberus-gaap:PensionPlansDefinedBenefitMemberus-gaap:ForeignPlanMember2024-12-310000895728us-gaap:NondesignatedMemberus-gaap:OtherCurrentAssetsMemberus-gaap:InterestRateContractMember2025-12-310000895728enb:EnbridgeGasOntarioMemberus-gaap:GasDistributionMember2024-01-012024-12-310000895728us-gaap:EmployeeStockOptionMember2024-01-012024-12-310000895728enb:UncommittedCreditFacilityMember2025-01-012025-12-310000895728us-gaap:PerformanceSharesMemberenb:TwoThousandAndTwentyFivePerformanceStockUnitsMember2025-12-310000895728enb:CommoditySalesMember2023-01-012023-12-3100008957282022-12-310000895728country:CAus-gaap:OtherPostretirementBenefitPlansDefinedBenefitMember2024-01-012024-12-310000895728us-gaap:PipelinesMember2025-01-012025-12-310000895728enb:SeriesNPreferredStockMember2025-01-012025-12-310000895728enb:StorageandOtherRevenueMember2024-01-012024-12-310000895728enb:AccumulatedNetGainLossNetInvestmentHedgeParentMember2025-12-310000895728us-gaap:CarryingReportedAmountFairValueDisclosureMemberenb:QuestarGasCompanyMember2024-05-310000895728us-gaap:PreferredStockMemberenb:Series11PreferredStockMember2025-12-310000895728us-gaap:NondesignatedMember2024-01-012024-12-310000895728us-gaap:TransferredAtPointInTimeMember2023-01-012023-12-310000895728srt:ConsolidationEliminationsMemberenb:StorageandOtherRevenueMember2025-01-012025-12-310000895728srt:MinimumMember2024-01-012024-12-310000895728enb:IllinoisExtensionPipelineCompanyLLCNotPrimaryBeneficiaryMemberus-gaap:InvesteeMemberenb:LiquidsPipelinesSegmentMember2025-12-310000895728us-gaap:FairValueInputsLevel3Memberenb:PhysicalForwardCommodityContractMemberus-gaap:MarketApproachValuationTechniqueMembersrt:CrudeOilMembersrt:MinimumMember2025-12-310000895728enb:ElectricityRevenueMemberus-gaap:OperatingSegmentsMemberenb:GasTransmissionSegmentMember2024-01-012024-12-310000895728us-gaap:DesignatedAsHedgingInstrumentMemberenb:DeferredAmountsAndOtherMemberus-gaap:FairValueHedgingMember2024-12-310000895728us-gaap:OperatingSegmentsMemberenb:GasTransmissionSegmentMemberenb:StorageandOtherRevenueMember2024-01-012024-12-310000895728enb:InterestRateContractForShortTermBorrowingsPayFixedRateMember2025-12-3100008957282024-07-012024-09-300000895728country:CA2024-12-310000895728us-gaap:DefinedBenefitPlanEquitySecuritiesUsMemberus-gaap:ForeignPlanMemberus-gaap:OtherPostretirementBenefitPlansDefinedBenefitMember2025-12-310000895728us-gaap:OtherLiabilitiesMember2024-12-310000895728us-gaap:DesignatedAsHedgingInstrumentMemberus-gaap:OtherCurrentAssetsMemberus-gaap:CommodityContractMemberus-gaap:FairValueHedgingMember2024-12-310000895728us-gaap:NondesignatedMemberenb:DeferredAmountsAndOtherMemberus-gaap:CommodityContractMember2025-12-310000895728us-gaap:FairValueInputsLevel1Memberus-gaap:DefinedBenefitPlanEquitySecuritiesUsMemberus-gaap:ForeignPlanMemberus-gaap:OtherPostretirementBenefitPlansDefinedBenefitMember2024-12-310000895728us-gaap:FairValueInputsLevel2Memberenb:DomesticGovernmentBondsMemberus-gaap:ForeignPlanMemberus-gaap:OtherPostretirementBenefitPlansDefinedBenefitMemberus-gaap:EstimateOfFairValueFairValueDisclosureMember2025-12-310000895728us-gaap:PensionPlansDefinedBenefitMemberus-gaap:ForeignPlanMember2023-01-012023-12-310000895728enb:CommercialPaperAndCreditFacilityDrawsMemberenb:EnbridgeUSIncMember2024-12-310000895728us-gaap:FairValueInputsLevel3Memberus-gaap:PensionPlansDefinedBenefitMemberus-gaap:DefinedBenefitPlanEquitySecuritiesNonUsMemberus-gaap:ForeignPlanMember2025-12-310000895728enb:RenewablePowerGenerationSegmentMemberenb:ElectricityRevenueMemberus-gaap:OperatingSegmentsMember2023-01-012023-12-310000895728us-gaap:PensionPlansDefinedBenefitMemberenb:DomesticGovernmentBondsMemberus-gaap:ForeignPlanMember2025-12-310000895728us-gaap:SeniorNotesMemberenb:TexasEasternTransmissionLPMember2025-12-310000895728enb:PipelineFutureAbandonmentCostsMember2024-12-310000895728us-gaap:OtherCurrentAssetsMemberus-gaap:CommodityContractMember2024-12-310000895728us-gaap:CommonStockMember2024-01-012024-12-310000895728us-gaap:FairValueInputsLevel3Memberus-gaap:PensionPlansDefinedBenefitMemberus-gaap:DefinedBenefitPlanEquitySecuritiesNonUsMembercountry:CA2024-12-310000895728enb:WhistlerParentJVMember2024-05-290000895728us-gaap:NondesignatedMemberus-gaap:CommodityContractMember2023-01-012023-12-310000895728us-gaap:OtherCurrentLiabilitiesMember2025-12-310000895728us-gaap:SeniorNotesMemberenb:EnbridgeSouthernLightsLPMember2024-12-310000895728us-gaap:PreferredStockMemberenb:Three-MonthGovernmentOfCanadaTreasuryBillMemberus-gaap:SeriesEPreferredStockMember2025-12-310000895728us-gaap:PreferredStockMemberenb:SeriesRPreferredStockMember2025-01-012025-12-310000895728us-gaap:EquityMethodInvestmentNonconsolidatedInvesteeOrGroupOfInvesteesMember2023-01-012023-12-310000895728us-gaap:FairValueInputsLevel2Memberus-gaap:PensionPlansDefinedBenefitMemberus-gaap:DefinedBenefitPlanCashAndCashEquivalentsMemberus-gaap:ForeignPlanMember2025-12-310000895728enb:TermLoanMembersrt:ParentCompanyMember2025-12-310000895728us-gaap:OtherIntangibleAssetsMember2024-12-310000895728enb:Series7PreferredStockMember2025-01-012025-12-310000895728srt:ParentCompanyMemberenb:DebtInstrumentInterestRateTermsPeriodOneMemberenb:FixedToFloatingSubordinatedTermNotesMember2025-01-012025-12-310000895728enb:SpectraEnergyPartnersLPMemberenb:A3.50SeniorNotesMember2025-03-012025-03-310000895728enb:TransportationAndOtherServicesRevenuesMemberus-gaap:InvesteeMember2025-01-012025-12-310000895728us-gaap:EquityMethodInvestmentNonconsolidatedInvesteeOrGroupOfInvesteesMember2024-12-310000895728us-gaap:SeriesFPreferredStockMemberus-gaap:PreferredStockMember2023-12-310000895728srt:ParentCompanyMemberenb:FixedToFloatingSubordinatedTermNotesMember2025-12-310000895728us-gaap:FairValueInputsLevel2Memberus-gaap:PensionPlansDefinedBenefitMemberus-gaap:DefinedBenefitPlanEquitySecuritiesNonUsMemberus-gaap:ForeignPlanMember2025-12-310000895728enb:GasTransmissionSegmentMemberus-gaap:InvesteeMemberenb:MatterhornExpressPipelineMember2025-12-310000895728enb:ElectricityRevenueMemberus-gaap:OperatingSegmentsMemberenb:GasTransmissionSegmentMember2023-01-012023-12-310000895728us-gaap:FairValueInputsLevel3Memberus-gaap:MarketApproachValuationTechniqueMembersrt:CrudeOilMembersrt:MinimumMemberenb:FinancialForwardCommodityContractMember2025-12-310000895728enb:SoutheatSupplyHeaderLLCMemberus-gaap:InvesteeMemberenb:GasTransmissionSegmentMember2024-12-310000895728us-gaap:InterestRateContractMemberus-gaap:AccumulatedGainLossNetCashFlowHedgeParentMember2023-01-012023-12-310000895728us-gaap:DesignatedAsHedgingInstrumentMemberenb:DeferredAmountsAndOtherMemberus-gaap:FairValueHedgingMember2025-12-310000895728us-gaap:NondesignatedMemberus-gaap:ForeignExchangeContractMember2023-01-012023-12-310000895728enb:RegulatoryAssetsPurchaseGasVarianceMember2024-12-310000895728enb:UncommittedCreditFacilityMember2025-12-310000895728enb:DefinedBenefitPlanEquitySecuritiesAndFixedIncomeSecuritiesMember2024-12-310000895728us-gaap:PensionPlansDefinedBenefitMemberenb:DefinedBenefitPlanAlternativesMemberus-gaap:FairValueInputsLevel1Membercountry:CA2024-12-310000895728enb:CommercialPaperAndCreditFacilityDrawsMemberenb:EnbridgePipelinesIncMember2025-12-310000895728us-gaap:PerformanceSharesMembersrt:MaximumMember2025-12-310000895728us-gaap:NondesignatedMemberenb:DeferredAmountsAndOtherMember2025-12-310000895728us-gaap:AccumulatedTranslationAdjustmentMember2022-12-310000895728srt:ParentCompanyMemberenb:Medium-TermNotesMember2024-12-310000895728us-gaap:NondesignatedMemberus-gaap:InterestRateContractMember2024-01-012024-12-310000895728us-gaap:SeriesBPreferredStockMember2025-01-012025-12-310000895728us-gaap:TransferredOverTimeMember2023-01-012023-12-310000895728enb:RenewablePowerGenerationSegmentMemberus-gaap:OperatingSegmentsMemberenb:TransportationRevenueMember2025-01-012025-12-310000895728enb:RenewablePowerGenerationSegmentMemberenb:RampionOffshoreWindProjectMemberus-gaap:InvesteeMember2024-12-310000895728enb:EnbridgePipelinesIncMemberenb:A4.10MediumTermNotesMember2025-02-012025-02-280000895728enb:BiogasRightsAgreementsMember2025-01-012025-12-310000895728us-gaap:DesignatedAsHedgingInstrumentMemberus-gaap:CommodityContractMemberus-gaap:FairValueHedgingMember2025-12-310000895728enb:RenewablePowerGenerationSegmentMemberus-gaap:IntersegmentEliminationMember2025-01-012025-12-310000895728us-gaap:AssetUnderConstructionMember2024-12-310000895728us-gaap:IntersegmentEliminationMember2024-01-012024-12-310000895728enb:CanadianProvincialMember2024-01-012024-12-310000895728enb:AccumulatedNetGainLossNetInvestmentHedgeParentMember2024-12-310000895728enb:EnbridgeEnergyPartnersLPMemberenb:A588SeniorNotesMember2025-07-310000895728enb:WhistlerParentJV1Memberus-gaap:InvesteeMemberenb:GasTransmissionSegmentMember2024-05-290000895728us-gaap:DesignatedAsHedgingInstrumentMemberus-gaap:InterestRateContractMemberus-gaap:OtherLiabilitiesMemberus-gaap:FairValueHedgingMember2025-12-3100008957282024-04-012024-06-300000895728us-gaap:DefinedBenefitPlanCashAndCashEquivalentsMemberus-gaap:FairValueInputsLevel1Memberus-gaap:ForeignPlanMemberus-gaap:OtherPostretirementBenefitPlansDefinedBenefitMemberus-gaap:EstimateOfFairValueFairValueDisclosureMember2025-12-310000895728us-gaap:FairValueInputsLevel3Memberus-gaap:ForeignPlanMemberus-gaap:OtherPostretirementBenefitPlansDefinedBenefitMember2025-12-310000895728us-gaap:EstimateOfFairValueFairValueDisclosureMember2024-12-310000895728us-gaap:RestrictedStockUnitsRSUMember2023-01-012023-12-310000895728us-gaap:CashFlowHedgingMemberus-gaap:CommodityContractMember2024-01-012024-12-310000895728enb:A345Medium-TermNotesMemberenb:EnbridgePipelinesIncMember2025-09-012025-09-300000895728country:CA2025-12-310000895728us-gaap:InvesteeMemberenb:EolienMaritimeFranceSasMember2025-12-310000895728srt:ParentCompanyMemberenb:FloatingRateNoteMember2025-01-012025-12-310000895728enb:WoodfibreLNGLPMemberus-gaap:VariableInterestEntityNotPrimaryBeneficiaryMember2024-12-310000895728us-gaap:FairValueInputsLevel2Memberus-gaap:PensionPlansDefinedBenefitMemberenb:DefinedBenefitPlanEquitySecuritiesGlobalMemberus-gaap:ForeignPlanMember2025-12-310000895728srt:ParentCompanyMemberenb:FloatingRateNoteMember2024-12-310000895728us-gaap:FairValueInputsLevel3Memberus-gaap:MarketApproachValuationTechniqueMembersrt:CrudeOilMemberenb:FinancialForwardCommodityContractMemberus-gaap:EstimateOfFairValueFairValueDisclosureMember2025-12-310000895728enb:Sustainability-LinkedBondsMembersrt:ParentCompanyMember2025-12-310000895728us-gaap:InterestRateContractMember2025-12-310000895728us-gaap:DesignatedAsHedgingInstrumentMemberus-gaap:OtherCurrentAssetsMemberus-gaap:InterestRateContractMemberus-gaap:FairValueHedgingMember2025-12-310000895728country:US2023-01-012023-12-310000895728us-gaap:AdditionalPaidInCapitalMember2025-01-012025-12-310000895728srt:NaturalGasReservesMemberus-gaap:CommodityContractMember2025-12-310000895728us-gaap:PensionPlansDefinedBenefitMemberus-gaap:CorporateBondSecuritiesMemberus-gaap:ForeignPlanMember2025-12-310000895728us-gaap:OperatingSegmentsMemberenb:GasTransmissionSegmentMember2023-01-012023-12-310000895728srt:ParentCompanyMemberenb:A2.50SeniorNotesMember2025-02-280000895728us-gaap:FairValueInputsLevel1Member2025-12-310000895728us-gaap:SupplementalEmployeeRetirementPlanDefinedBenefitMemberus-gaap:ForeignPlanMember2024-12-310000895728us-gaap:PensionPlansDefinedBenefitMemberenb:DefinedBenefitPlanEquitySecuritiesGlobalMembercountry:CA2024-12-310000895728enb:OtherRevenueMembersrt:ConsolidationEliminationsMember2025-01-012025-12-310000895728us-gaap:NondesignatedMemberenb:DeferredAmountsAndOtherMemberus-gaap:InterestRateContractMember2025-12-310000895728us-gaap:FairValueInputsLevel3Membersrt:WeightedAverageMemberus-gaap:MarketApproachValuationTechniqueMembersrt:CrudeOilMemberenb:FinancialForwardCommodityContractMember2025-12-310000895728enb:EnbridgeGasOhioMemberus-gaap:GasDistributionMember2025-07-012025-07-310000895728srt:ParentCompanyMemberenb:DebtInstrumentInterestRateTermsPeriodFiveMemberenb:FixedToFixedTermSubordinatedTermNotesMember2025-01-012025-12-310000895728enb:GasDistributionandStorageSegmentMember2023-01-012023-12-310000895728enb:RenewablePowerGenerationSegmentMember2024-12-310000895728enb:TransportationRevenueMember2024-01-012024-12-310000895728us-gaap:SeniorNotesMemberenb:SpectraEnergyPartnersLPMember2025-12-310000895728us-gaap:RetainedEarningsMember2022-12-310000895728enb:OtherRegulatoryAssetsMember2024-12-310000895728us-gaap:FairValueInputsLevel1Memberus-gaap:DefinedBenefitPlanEquitySecuritiesUsMemberus-gaap:ForeignPlanMemberus-gaap:OtherPostretirementBenefitPlansDefinedBenefitMember2025-12-310000895728enb:SeniorNotesDueNovember2035Membersrt:ParentCompanyMember2025-11-300000895728enb:LiquidsPipelinesSegmentMember2025-12-310000895728enb:EnbridgeGasInc.Memberenb:A319Medium-TermNotesMember2025-09-012025-09-300000895728us-gaap:OperatingSegmentsMemberenb:LiquidsPipelinesSegmentMember2025-01-012025-12-310000895728enb:RioBravoMember2024-05-280000895728us-gaap:PreferredStockMemberenb:PreferenceSharesSeries19Member2025-12-310000895728us-gaap:IntersegmentEliminationMemberenb:GasTransmissionSegmentMember2023-01-012023-12-310000895728us-gaap:SeniorNotesMemberenb:SpectraEnergyCorpMember2025-12-310000895728enb:WestcoastEnergyLimitedPartnershipMemberenb:Stonlasec8IndigenousInvestmentsLimitedPartnershipMemberus-gaap:CapitalUnitClassAMember2025-07-020000895728us-gaap:TransferredOverTimeMemberenb:GasDistributionandStorageSegmentMember2023-01-012023-12-310000895728enb:WestcoastEnergyLimitedPartnershipMemberenb:FirstNationsPartnershipMemberus-gaap:CapitalUnitClassAMember2025-12-310000895728country:CA2024-01-012024-12-310000895728us-gaap:InvesteeMemberenb:GasTransmissionSegmentMember2025-12-310000895728us-gaap:TransferredAtPointInTimeMemberenb:GasTransmissionSegmentMember2025-01-012025-12-310000895728us-gaap:NoncontrollingInterestMember2022-12-310000895728us-gaap:FairValueInputsLevel3Memberus-gaap:PensionPlansDefinedBenefitMemberus-gaap:ForeignPlanMember2025-12-310000895728enb:WindTurbinesSolarPanelsAndOtherMember2025-12-310000895728enb:LiquidsPipelinesSegmentMember2023-01-012023-12-310000895728enb:MaritimesNortheastPipelineLimitedPartnershipMember2025-12-310000895728enb:WindTurbinesSolarPanelsAndOtherMember2025-01-012025-12-310000895728us-gaap:PreferredStockMemberenb:PreferenceSharesSeries19Membersrt:MinimumMember2025-01-012025-12-310000895728enb:PensionPlanReceivableMember2025-12-310000895728enb:CanadianMainlineMember2025-12-310000895728us-gaap:GasDistributionMemberenb:EnbridgeGasNorthCarolinaMember2025-09-012025-09-300000895728enb:PublicServiceCompanyOfNorthCarolinaIncorporatedMember2024-09-302024-09-300000895728enb:EquityFundsAndDebtSecuritiesMember2024-01-012024-12-310000895728us-gaap:OperatingSegmentsMemberenb:GasTransmissionSegmentMemberenb:StorageandOtherRevenueMember2025-01-012025-12-310000895728us-gaap:PreferredStockMemberus-gaap:SeriesAPreferredStockMember2023-12-310000895728us-gaap:FairValueInputsLevel1Memberus-gaap:EstimateOfFairValueFairValueDisclosureMember2025-12-310000895728us-gaap:ForeignExchangeContractMember2024-01-012024-12-310000895728us-gaap:PensionPlansDefinedBenefitMemberenb:DefinedBenefitPlanAlternativesMembercountry:CA2025-12-310000895728enb:EnbridgeAthabascaMidstreamInvestorLimitedPartnershipMember2025-12-310000895728us-gaap:NondesignatedMemberus-gaap:InterestRateContractMember2023-01-012023-12-310000895728enb:OtherCountriesMember2024-01-012024-12-310000895728us-gaap:OperatingSegmentsMemberenb:TransportationRevenueMemberenb:GasDistributionandStorageSegmentMember2024-01-012024-12-310000895728enb:OperatingAndAdministrativeExpenseMemberus-gaap:NondesignatedMemberus-gaap:CommodityContractMember2024-01-012024-12-310000895728us-gaap:ForeignExchangeContractMember2025-12-310000895728us-gaap:OtherLongTermInvestmentsMember2025-12-310000895728us-gaap:FairValueInputsLevel3Memberus-gaap:ForeignPlanMemberus-gaap:OtherPostretirementBenefitPlansDefinedBenefitMember2024-01-012024-12-310000895728enb:A364DayExtendibleCreditFacilityMemberus-gaap:RevolvingCreditFacilityMember2025-07-012025-07-310000895728us-gaap:FairValueInputsLevel3Memberenb:PhysicalForwardCommodityContractMemberus-gaap:MarketApproachValuationTechniqueMembersrt:CrudeOilMembersrt:MaximumMember2025-12-310000895728us-gaap:ForeignCountryMembercountry:US2024-01-012024-12-310000895728us-gaap:OtherCurrentLiabilitiesMemberus-gaap:NondesignatedMemberus-gaap:CommodityContractMember2025-12-310000895728us-gaap:RetainedEarningsMember2025-12-310000895728srt:NaturalGasReservesMemberus-gaap:CommodityContractMember2024-12-310000895728us-gaap:SeriesHPreferredStockMember2025-01-012025-12-310000895728enb:TheEastOhioGasCompanyEOGMember2024-01-012024-12-310000895728enb:RNGFacilitiesMemberenb:NonInterestBearingPromissoryNotesMemberus-gaap:NotesPayableOtherPayablesMember2024-01-020000895728enb:CactusIIPipelineLLCMemberus-gaap:InvesteeMemberenb:LiquidsPipelinesSegmentMember2024-12-310000895728us-gaap:DesignatedAsHedgingInstrumentMemberus-gaap:ForeignExchangeContractMemberus-gaap:OtherLiabilitiesMemberus-gaap:FairValueHedgingMember2024-12-310000895728us-gaap:FairValueInputsLevel3Memberus-gaap:MarketApproachValuationTechniqueMembersrt:NaturalGasReservesMemberenb:OptionsForwardCommodityContractMembersrt:MaximumMember2025-12-310000895728us-gaap:DerivativeMember2024-01-012024-12-310000895728us-gaap:AccumulatedOtherComprehensiveIncomeMember2024-12-310000895728enb:OtherRegulatoryLiabilitiesMember2025-12-310000895728enb:AlbertaMember2024-01-012024-12-310000895728enb:WoodfibreLNGLPMemberenb:GasTransmissionSegmentMemberus-gaap:InvesteeMember2025-12-3100008957282025-01-012025-12-310000895728enb:PreferenceSharesSeries19Member2025-01-012025-12-310000895728us-gaap:PreferredStockMemberenb:SeriesNPreferredStockMember2024-12-310000895728enb:RenewablePowerGenerationSegmentMemberenb:ElectricityRevenueMemberus-gaap:OperatingSegmentsMember2024-01-012024-12-310000895728us-gaap:FairValueInputsLevel3Memberus-gaap:PensionPlansDefinedBenefitMemberenb:DomesticGovernmentBondsMembercountry:CA2024-12-310000895728us-gaap:PensionPlansDefinedBenefitMembercountry:CA2023-01-012023-12-310000895728us-gaap:FairValueInputsLevel2Memberus-gaap:PensionPlansDefinedBenefitMemberenb:DefinedBenefitPlanEquitySecuritiesGlobalMembercountry:CA2024-12-310000895728us-gaap:ForeignPlanMemberus-gaap:OtherPostretirementBenefitPlansDefinedBenefitMember2025-12-310000895728us-gaap:AccumulatedTranslationAdjustmentMember2023-01-012023-12-310000895728us-gaap:FairValueInputsLevel3Memberus-gaap:PensionPlansDefinedBenefitMemberus-gaap:ForeignPlanMember2025-01-012025-12-310000895728enb:EnbridgeGasInc.Memberenb:A865DebenturesMember2025-11-012025-11-300000895728us-gaap:DesignatedAsHedgingInstrumentMemberus-gaap:ForeignExchangeContractMemberus-gaap:FairValueHedgingMember2024-12-310000895728us-gaap:NondesignatedMemberus-gaap:ForeignExchangeContractMemberenb:TransportationRevenueMember2023-01-012023-12-310000895728enb:TresPalaciosHoldingsLlcMember2023-04-030000895728us-gaap:FairValueInputsLevel2Memberus-gaap:PensionPlansDefinedBenefitMemberus-gaap:DefinedBenefitPlanCashAndCashEquivalentsMemberus-gaap:ForeignPlanMember2024-12-310000895728srt:CrudeOilMemberus-gaap:CommodityContractMember2025-12-310000895728enb:PurchaseGasVarianceMember2024-12-310000895728us-gaap:PreferredStockMemberenb:Series11PreferredStockMember2023-12-310000895728us-gaap:PreferredStockMemberenb:SeriesIPreferredStockMember2023-12-310000895728enb:SeniorNotesDueJune2035Memberenb:TheEastOhioGasCompanyEOGMember2025-06-300000895728us-gaap:SeniorNotesMemberenb:TheEastOhioGasCompanyEOGMember2024-12-310000895728enb:MaRenBakkenCompanyLLC1Memberus-gaap:InvesteeMemberenb:LiquidsPipelinesSegmentMember2024-12-310000895728us-gaap:OtherCurrentLiabilitiesMemberus-gaap:ForeignExchangeContractMember2024-12-310000895728country:CAus-gaap:OtherPostretirementBenefitPlansDefinedBenefitMember2023-12-310000895728us-gaap:PreferredStockMemberus-gaap:SeriesBPreferredStockMember2023-12-310000895728enb:CommercialPaperAndCreditFacilityDrawsMember2023-01-012023-12-310000895728enb:UnderRecoveryOfFuelCostsMember2025-12-310000895728us-gaap:FairValueInputsLevel3Memberus-gaap:MarketApproachValuationTechniqueMemberenb:PowerMembersrt:MaximumMemberenb:FinancialForwardCommodityContractMember2025-12-310000895728srt:ParentCompanyMemberenb:A555SeniorNotesDueJune2035Member2025-06-300000895728us-gaap:PreferredStockMemberenb:PreferenceSharesSeries20Memberenb:Three-MonthGovernmentOfCanadaTreasuryBillMember2025-12-3100008957282024-10-012024-12-310000895728enb:CommittedCreditFacilityMembersrt:MinimumMemberenb:EnbridgeUSIncMember2025-01-012025-12-310000895728enb:RenewablePowerGenerationSegmentMemberenb:EIHSARLMemberus-gaap:InvesteeMember2025-12-310000895728us-gaap:AdditionalPaidInCapitalMember2023-01-012023-12-310000895728enb:RenewablePowerGenerationSegmentMember2024-01-012024-12-310000895728us-gaap:PreferredStockMember2025-12-310000895728us-gaap:CommodityContractMemberus-gaap:EstimateOfFairValueFairValueDisclosureMember2025-12-310000895728us-gaap:PreferredStockMemberenb:Series5PreferredStockMember2025-01-012025-12-310000895728enb:DCPMidstreamLLCMemberus-gaap:InvesteeMemberenb:LiquidsPipelinesSegmentMember2025-12-310000895728enb:A4.97SeniorNotesNoteOneMemberenb:EnbridgeHoldingsTomorrowRNGLLCMember2025-01-310000895728enb:PensionPlanReceivableMember2024-12-310000895728us-gaap:NondesignatedMemberus-gaap:OtherCurrentAssetsMemberus-gaap:InterestRateContractMember2024-12-310000895728us-gaap:FairValueInputsLevel1Memberenb:DomesticGovernmentBondsMemberus-gaap:ForeignPlanMemberus-gaap:OtherPostretirementBenefitPlansDefinedBenefitMemberus-gaap:EstimateOfFairValueFairValueDisclosureMember2025-12-310000895728enb:WoodfibreLNGLPMember2024-12-310000895728us-gaap:FairValueInputsLevel2Memberus-gaap:DefinedBenefitPlanEquitySecuritiesNonUsMemberus-gaap:ForeignPlanMemberus-gaap:OtherPostretirementBenefitPlansDefinedBenefitMember2025-12-310000895728us-gaap:AccumulatedGainLossNetCashFlowHedgeParentMember2023-01-012023-12-310000895728enb:GasTransmissionSegmentMember2025-12-310000895728us-gaap:DesignatedAsHedgingInstrumentMemberus-gaap:CashFlowHedgingMemberus-gaap:CommodityContractMemberus-gaap:OtherLiabilitiesMember2025-12-3100008957282024-01-012024-03-310000895728us-gaap:OperatingSegmentsMemberenb:TransportationRevenueMemberenb:GasTransmissionSegmentMember2024-01-012024-12-310000895728enb:ProjectAgreementsMember2024-12-310000895728enb:GasDistributionSalesMember2023-01-012023-12-310000895728us-gaap:PensionPlansDefinedBenefitMemberenb:DefinedBenefitPlanAlternativesMemberus-gaap:ForeignPlanMember2024-12-310000895728us-gaap:InvesteeMemberenb:GasTransmissionSegmentMemberenb:GulfstreamNaturalGasSystemLLCMember2025-12-310000895728enb:DelawareBasinResidueLLCMemberenb:GasTransmissionSegmentMemberus-gaap:InvesteeMember2025-12-310000895728us-gaap:FairValueInputsLevel2Memberus-gaap:PensionPlansDefinedBenefitMemberenb:DomesticGovernmentBondsMembercountry:CA2024-12-310000895728us-gaap:FairValueInputsLevel3Memberus-gaap:PensionPlansDefinedBenefitMemberus-gaap:DefinedBenefitPlanCashAndCashEquivalentsMembercountry:CA2024-12-310000895728us-gaap:InterestRateContractMemberus-gaap:OtherLiabilitiesMember2024-12-310000895728us-gaap:DesignatedAsHedgingInstrumentMemberus-gaap:InterestRateContractMemberus-gaap:FairValueHedgingMember2024-12-310000895728us-gaap:NonUsMemberus-gaap:ForeignCountryMember2025-01-012025-12-310000895728us-gaap:PerformanceSharesMember2024-12-310000895728us-gaap:SeriesGPreferredStockMember2025-01-012025-12-310000895728us-gaap:PreferredStockMemberus-gaap:SeriesBPreferredStockMember2025-12-310000895728srt:ConsolidationEliminationsMemberenb:StorageandOtherRevenueMember2023-01-012023-12-310000895728enb:DCPMidstreamLLCMemberus-gaap:InvesteeMemberenb:LiquidsPipelinesSegmentMember2024-12-310000895728enb:A480SeniorNotesNoteThreeMemberenb:EnbridgeHoldingsTomorrowRNGLLCMember2025-12-012025-12-310000895728us-gaap:FairValueInputsLevel3Memberus-gaap:PensionPlansDefinedBenefitMemberenb:DefinedBenefitPlanAlternativesMembercountry:CA2025-12-310000895728us-gaap:DesignatedAsHedgingInstrumentMemberenb:DeferredAmountsAndOtherMemberus-gaap:InterestRateContractMemberus-gaap:FairValueHedgingMember2024-12-310000895728us-gaap:RelatedPartyMemberus-gaap:VariableInterestEntityPrimaryBeneficiaryMember2024-12-310000895728us-gaap:FairValueInputsLevel3Memberenb:DefinedBenefitPlanAlternativesMemberus-gaap:ForeignPlanMemberus-gaap:OtherPostretirementBenefitPlansDefinedBenefitMemberus-gaap:EstimateOfFairValueFairValueDisclosureMember2024-12-310000895728srt:MinimumMemberus-gaap:InvesteeMemberenb:GasTransmissionSegmentMemberenb:OffshoreJointVenturesMember2025-12-310000895728enb:GasDistributionandStorageSegmentMember2024-01-012024-12-310000895728us-gaap:PreferredStockMember2023-12-310000895728us-gaap:RetainedEarningsMember2025-01-012025-12-310000895728enb:RenewablePowerGenerationSegmentMemberenb:OtherEquityInvesteeMemberus-gaap:InvesteeMember2025-12-310000895728enb:PowerMemberus-gaap:CommodityContractMember2025-12-310000895728us-gaap:DesignatedAsHedgingInstrumentMemberenb:DeferredAmountsAndOtherMemberus-gaap:CommodityContractMemberus-gaap:FairValueHedgingMember2025-12-310000895728enb:FiveYearCreditFacilitiesMemberus-gaap:RevolvingCreditFacilityMember2025-07-012025-07-310000895728enb:AitkenCreekGasStorageFacilityMember2023-11-012023-11-010000895728us-gaap:OtherContractMemberus-gaap:EstimateOfFairValueFairValueDisclosureMember2024-12-310000895728enb:A210SeniorNotesMemberenb:BlaurackeGMBHMember2025-04-300000895728enb:RegulatoryAssetsLongTermDebtMember2025-12-310000895728us-gaap:SeniorNotesMemberenb:TheEastOhioGasCompanyEOGMember2025-12-310000895728us-gaap:PensionPlansDefinedBenefitMemberus-gaap:FairValueInputsLevel1Memberus-gaap:DefinedBenefitPlanCashAndCashEquivalentsMemberus-gaap:ForeignPlanMember2024-12-310000895728enb:Stonlasec8IndigenousInvestmentsLimitedPartnershipMemberenb:WestcoastEnergyLimitedPartnershipMember2025-12-310000895728enb:CommittedCreditFacilityMemberenb:EnbridgePipelinesIncMember2025-01-012025-12-310000895728enb:SeawayPipelineMemberus-gaap:InvesteeMemberenb:LiquidsPipelinesSegmentMember2025-12-310000895728us-gaap:PensionPlansDefinedBenefitMemberus-gaap:FairValueInputsLevel1Membercountry:CA2025-12-310000895728us-gaap:PensionPlansDefinedBenefitMemberenb:DefinedBenefitPlanAlternativesMemberus-gaap:FairValueInputsLevel1Memberus-gaap:ForeignPlanMember2025-12-310000895728us-gaap:AccumulatedNetUnrealizedInvestmentGainLossMember2024-12-310000895728enb:AccumulatedNetGainLossNetInvestmentHedgeParentMember2023-01-012023-12-310000895728us-gaap:DesignatedAsHedgingInstrumentMemberus-gaap:InterestRateContractMemberus-gaap:OtherLiabilitiesMemberus-gaap:FairValueHedgingMember2024-12-310000895728us-gaap:NondesignatedMemberus-gaap:CommodityContractMember2023-12-310000895728us-gaap:FixedIncomeSecuritiesMemberus-gaap:ForeignPlanMember2024-12-310000895728enb:GasTransmissionSegmentMember2023-01-012023-12-310000895728us-gaap:FairValueInputsLevel3Memberus-gaap:PensionPlansDefinedBenefitMembercountry:CA2024-01-012024-12-310000895728us-gaap:PreferredStockMemberenb:Three-MonthGovernmentOfCanadaTreasuryBillMemberenb:SeriesIPreferredStockMember2025-12-310000895728us-gaap:DesignatedAsHedgingInstrumentMemberus-gaap:CashFlowHedgingMember2025-12-310000895728enb:SeriesLPreferredStockMember2025-01-012025-12-310000895728us-gaap:DesignatedAsHedgingInstrumentMemberus-gaap:OtherCurrentLiabilitiesMemberus-gaap:CashFlowHedgingMemberus-gaap:InterestRateContractMember2025-12-310000895728us-gaap:OperatingSegmentsMemberenb:TransportationRevenueMemberenb:GasDistributionandStorageSegmentMember2025-01-012025-12-310000895728us-gaap:ForeignPlanMemberus-gaap:OtherPostretirementBenefitPlansDefinedBenefitMember2025-01-012025-12-310000895728us-gaap:OtherContractMemberus-gaap:CashFlowHedgingMember2024-01-012024-12-310000895728enb:MaritimesAndNortheastPipelineMember2025-12-310000895728us-gaap:FairValueInputsLevel3Memberus-gaap:ForeignExchangeContractMemberus-gaap:EstimateOfFairValueFairValueDisclosureMember2024-12-310000895728enb:EnbridgeGasOhioMemberus-gaap:GasDistributionMember2025-11-300000895728us-gaap:OperatingSegmentsMemberenb:OtherRevenueMemberenb:LiquidsPipelinesSegmentMember2024-01-012024-12-310000895728us-gaap:FairValueInputsLevel1Memberus-gaap:EquitySecuritiesMember2025-12-310000895728enb:Series4PreferredStockMember2025-01-012025-12-310000895728us-gaap:DefinedBenefitPlanCashAndCashEquivalentsMemberus-gaap:ForeignPlanMemberus-gaap:OtherPostretirementBenefitPlansDefinedBenefitMemberus-gaap:EstimateOfFairValueFairValueDisclosureMember2025-12-310000895728enb:ElectricityRevenueMemberus-gaap:OperatingSegmentsMemberenb:LiquidsPipelinesSegmentMember2025-01-012025-12-3100008957282031-01-012025-12-310000895728enb:SeriesLPreferredStockMemberus-gaap:PreferredStockMember2024-12-310000895728enb:UncommittedCreditFacilityMember2024-12-310000895728us-gaap:FairValueInputsLevel3Memberenb:DomesticGovernmentBondsMemberus-gaap:ForeignPlanMemberus-gaap:OtherPostretirementBenefitPlansDefinedBenefitMemberus-gaap:EstimateOfFairValueFairValueDisclosureMember2024-12-310000895728enb:OtherEquityInvesteeMemberus-gaap:InvesteeMemberenb:GasTransmissionSegmentMembersrt:MaximumMember2025-12-310000895728enb:PublicServiceCompanyOfNorthCarolinaIncorporatedMember2023-01-012023-12-310000895728enb:OtherCountriesMember2023-01-012023-12-310000895728enb:PublicServiceCompanyOfNorthCarolinaIncorporatedPSNCAcquisitionMember2024-01-012024-12-310000895728us-gaap:ForeignExchangeContractMemberus-gaap:EstimateOfFairValueFairValueDisclosureMember2024-12-310000895728enb:ForeignExchangeCollarsSellContractMember2025-12-310000895728us-gaap:PreferredStockMemberenb:Series9PreferredStockMember2025-01-012025-12-310000895728enb:DeferredAmountsAndOtherMember2025-12-310000895728us-gaap:PensionPlansDefinedBenefitMemberus-gaap:DefinedBenefitPlanEquitySecuritiesNonUsMemberus-gaap:ForeignPlanMember2024-12-310000895728us-gaap:FairValueInputsLevel2Memberus-gaap:ForeignPlanMemberus-gaap:OtherPostretirementBenefitPlansDefinedBenefitMemberus-gaap:EstimateOfFairValueFairValueDisclosureMember2024-12-310000895728enb:A4.97SeniorNotesNoteTwoMemberenb:EnbridgeHoldingsTomorrowRNGLLCMember2025-01-012025-01-310000895728enb:GasDistributionSalesMemberus-gaap:OperatingSegmentsMemberenb:LiquidsPipelinesSegmentMember2025-01-012025-12-310000895728us-gaap:RestrictedStockUnitsRSUMember2025-12-310000895728us-gaap:ForeignTaxJurisdictionOtherMember2024-01-012024-12-310000895728us-gaap:DesignatedAsHedgingInstrumentMemberenb:DeferredAmountsAndOtherMemberus-gaap:InterestRateContractMemberus-gaap:FairValueHedgingMember2025-12-310000895728us-gaap:PreferredStockMemberenb:Series7PreferredStockMember2024-12-310000895728us-gaap:CommonStockMemberenb:AtTheMarketOfferingMember2024-07-310000895728us-gaap:AccumulatedGainLossNetCashFlowHedgeParentMember2024-01-012024-12-310000895728us-gaap:AociDerivativeQualifyingAsHedgeExcludedComponentParentMember2024-12-310000895728us-gaap:OperatingSegmentsMemberenb:GasTransmissionSegmentMemberenb:CommoditySalesMember2024-01-012024-12-310000895728us-gaap:FairValueInputsLevel1Memberus-gaap:EquitySecuritiesMember2024-12-310000895728us-gaap:DesignatedAsHedgingInstrumentMemberus-gaap:ForeignExchangeContractMemberus-gaap:OtherCurrentAssetsMemberus-gaap:CashFlowHedgingMember2025-12-310000895728us-gaap:FairValueInputsLevel3Memberus-gaap:ForeignPlanMemberus-gaap:OtherPostretirementBenefitPlansDefinedBenefitMember2024-12-310000895728enb:GasTransmissionSegmentMemberus-gaap:InvesteeMemberenb:OffshoreJointVenturesMember2024-12-310000895728us-gaap:NoncontrollingInterestMember2024-12-310000895728us-gaap:NoncontrollingInterestMember2025-01-012025-12-310000895728us-gaap:PensionPlansDefinedBenefitMembercountry:CA2023-12-310000895728enb:SeriesLPreferredStockMemberus-gaap:PreferredStockMember2025-01-012025-12-310000895728enb:DeferredAmountsAndOtherMemberus-gaap:CommodityContractMember2024-12-310000895728enb:LandAndRightOfWayMember2025-12-310000895728us-gaap:AccumulatedDefinedBenefitPlansAdjustmentMember2024-12-310000895728enb:DebenturesAndTermNotesMember2025-01-012025-12-310000895728us-gaap:DerivativeMember2024-12-310000895728enb:TransportationRevenueMember2023-01-012023-12-310000895728srt:MaximumMember2025-01-012025-12-310000895728us-gaap:DesignatedAsHedgingInstrumentMemberus-gaap:ForeignExchangeContractMemberus-gaap:FairValueHedgingMember2025-12-310000895728srt:ParentCompanyMemberenb:SeniorNotesDueFebruary2031Member2025-11-300000895728enb:Series9PreferredStockMember2025-01-012025-12-310000895728enb:A210SeniorNotesMemberenb:BlaurackeGMBHMember2025-10-310000895728us-gaap:FairValueInputsLevel1Memberus-gaap:DefinedBenefitPlanEquitySecuritiesNonUsMemberus-gaap:ForeignPlanMemberus-gaap:OtherPostretirementBenefitPlansDefinedBenefitMember2025-12-310000895728us-gaap:PensionPlansDefinedBenefitMemberus-gaap:FairValueInputsLevel1Memberus-gaap:DefinedBenefitPlanEquitySecuritiesNonUsMemberus-gaap:ForeignPlanMember2025-12-310000895728us-gaap:RestrictedStockUnitsRSUMember2024-01-012024-12-310000895728us-gaap:PensionPlansDefinedBenefitMembercountry:CA2024-12-310000895728us-gaap:NonUsMemberus-gaap:ForeignCountryMember2024-01-012024-12-310000895728us-gaap:PensionPlansDefinedBenefitMemberus-gaap:FairValueInputsLevel1Memberus-gaap:DefinedBenefitPlanEquitySecuritiesNonUsMembercountry:CA2025-12-310000895728enb:RenewablePowerGenerationSegmentMemberenb:GasDistributionSalesMemberus-gaap:OperatingSegmentsMember2025-01-012025-12-310000895728us-gaap:CommonStockMember2025-01-012025-12-310000895728us-gaap:OtherCurrentLiabilitiesMemberus-gaap:InterestRateContractMember2025-12-310000895728enb:CanadianMainlineMember2024-12-310000895728enb:AlbertaMember2023-01-012023-12-310000895728enb:AccumulatedNetGainLossNetInvestmentHedgeParentMember2025-01-012025-12-310000895728enb:TransportationAndOtherServicesRevenuesMember2025-01-012025-12-310000895728us-gaap:DesignatedAsHedgingInstrumentMemberus-gaap:OtherCurrentLiabilitiesMemberus-gaap:CashFlowHedgingMember2025-12-310000895728us-gaap:InterestRateContractMemberus-gaap:EstimateOfFairValueFairValueDisclosureMember2025-12-310000895728us-gaap:NoncontrollingInterestMember2023-01-012023-12-310000895728us-gaap:CarryingReportedAmountFairValueDisclosureMember2025-12-310000895728us-gaap:DesignatedAsHedgingInstrumentMemberus-gaap:CashFlowHedgingMemberus-gaap:CommodityContractMember2025-12-310000895728us-gaap:DesignatedAsHedgingInstrumentMemberus-gaap:CashFlowHedgingMemberus-gaap:InterestRateContractMember2025-12-310000895728us-gaap:FairValueInputsLevel3Memberenb:PhysicalForwardCommodityContractMemberus-gaap:MarketApproachValuationTechniqueMemberenb:PowerMembersrt:MaximumMember2025-12-310000895728us-gaap:FairValueInputsLevel3Memberus-gaap:InterestRateContractMemberus-gaap:EstimateOfFairValueFairValueDisclosureMember2024-12-310000895728us-gaap:FairValueInputsLevel2Member2024-12-310000895728enb:DelawareBasinResidueLLCMemberus-gaap:InvesteeMemberenb:GasTransmissionSegmentMember2024-10-310000895728enb:WestcoastEnergyLimitedPartnershipMemberenb:FirstNationsPartnershipMemberus-gaap:CapitalUnitClassAMember2025-07-020000895728us-gaap:ParentMember2024-12-310000895728enb:TheEastOhioGasCompanyEOGMember2024-03-060000895728srt:AffiliatedEntityMember2025-12-310000895728enb:CommittedCreditFacilityMember2025-12-310000895728us-gaap:TransferredAtPointInTimeMemberenb:LiquidsPipelinesSegmentMember2024-01-012024-12-310000895728enb:DeferredProjectsCostsMember2024-12-310000895728enb:Series3PreferredStockMember2025-01-012025-12-310000895728us-gaap:FairValueInputsLevel2Memberus-gaap:PensionPlansDefinedBenefitMemberenb:DefinedBenefitPlanEquitySecuritiesGlobalMemberus-gaap:ForeignPlanMember2024-12-310000895728us-gaap:SeriesDPreferredStockMemberus-gaap:PreferredStockMember2023-12-310000895728us-gaap:FairValueInputsLevel2Memberenb:DefinedBenefitPlanAlternativesMemberus-gaap:ForeignPlanMemberus-gaap:OtherPostretirementBenefitPlansDefinedBenefitMemberus-gaap:EstimateOfFairValueFairValueDisclosureMember2025-12-310000895728enb:RenewablePowerGenerationSegmentMemberenb:OtherEquityInvesteeMemberus-gaap:InvesteeMember2024-12-310000895728us-gaap:FairValueInputsLevel2Memberus-gaap:PensionPlansDefinedBenefitMembercountry:CA2024-12-310000895728us-gaap:DesignatedAsHedgingInstrumentMemberenb:DeferredAmountsAndOtherMemberus-gaap:CashFlowHedgingMemberus-gaap:CommodityContractMember2024-12-310000895728us-gaap:PensionPlansDefinedBenefitMemberenb:DefinedBenefitPlanAlternativesMemberus-gaap:ForeignPlanMember2025-12-310000895728us-gaap:DomesticCountryMember2024-01-012024-12-310000895728enb:RenewablePowerGenerationSegmentMemberenb:ElectricityRevenueMemberus-gaap:OperatingSegmentsMember2025-01-012025-12-310000895728us-gaap:FairValueInputsLevel1Memberus-gaap:InterestRateContractMemberus-gaap:EstimateOfFairValueFairValueDisclosureMember2025-12-310000895728enb:A880Medium-TermNotesMemberenb:WestcoastEnergyIncorporationMember2025-11-300000895728us-gaap:EmployeeStockOptionMember2025-01-012025-12-3100008957282024-12-31iso4217:EURxbrli:pureiso4217:JPYiso4217:CADutr:MMBTUenb:Compensationplaniso4217:CADutr:bbliso4217:CADenb:Segmentutr:MWhiso4217:CADxbrli:sharesxbrli:sharesutr:MMBblsenb:Promissorynoteiso4217:GBPenb:DepreciationMethodenb:Facilityutr:Bcfiso4217:USDiso4217:CADutr:MWhenb:Project
s
UNITED STATES
SECURITIES AND EXCHANGE COMMISSION
Washington, D.C. 20549
FORM 10-K
|
|
|
☒ |
|
ANNUAL REPORT PURSUANT TO SECTION 13 OR 15(d) OF THE SECURITIES EXCHANGE ACT OF 1934 |
For the fiscal year ended December 31, 2025
or
|
|
|
☐ |
|
TRANSITION REPORT PURSUANT TO SECTION 13 OR 15(d) OF THE SECURITIES EXCHANGE ACT OF 1934 |
For the transition period from to
Commission file number 001-15254
ENBRIDGE INC.
(Exact Name of Registrant as Specified in Its Charter)
|
|
|
Canada |
|
98-0377957 |
(State or Other Jurisdiction of Incorporation or Organization) |
|
(I.R.S. Employer Identification No.) |
200, 425 - 1st Street S.W.
Calgary, Alberta, Canada T2P 3L8
(Address of Principal Executive Offices) (Zip Code)
(403) 231-3900
(Registrant’s Telephone Number, Including Area Code)
Securities registered pursuant to Section 12(b) of the Act:
|
|
|
|
|
Title of each class |
|
Trading Symbol(s) |
|
Name of each exchange on which registered |
Common Shares |
|
ENB |
|
New York Stock Exchange |
Securities registered pursuant to Section 12(g) of the Act: None
Indicate by check mark if the registrant is a well-known seasoned issuer, as defined in Rule 405 of the Securities Act. Yes ☒ No ☐
Indicate by check mark if the registrant is not required to file reports pursuant to Section 13 or Section 15(d) of the Act. Yes ☐ No ☒
Indicate by check mark whether the registrant (1) has filed all reports required to be filed by Section 13 or 15(d) of the Securities Exchange Act of 1934 during the preceding 12 months (or for such shorter period that the registrant was required to file such reports), and (2) has been subject to such filing requirements for the past 90 days. Yes ☒ No ☐
Indicate by check mark whether the registrant has submitted electronically every Interactive Data File required to be submitted pursuant to Rule 405 of Regulation S-T (§232.405 of this chapter) during the preceding 12 months (or for such shorter period that the registrant was required to submit such files). Yes ☒ No ☐
Indicate by check mark whether the registrant is a large accelerated filer, an accelerated filer, a non-accelerated filer, a smaller reporting company, or an emerging growth company. See the definitions of “large accelerated filer,” “accelerated filer”, “smaller reporting company,” and "emerging growth company" in Rule 12b-2 of the Exchange Act.
|
|
|
|
|
Large accelerated filer |
☒ |
|
Accelerated filer |
☐ |
Non-accelerated filer |
☐ |
|
Smaller reporting company |
☐ |
Emerging growth company |
☐ |
|
|
|
If an emerging growth company, indicate by check mark if the registrant has elected not to use the extended transition period for complying with any new or revised financial accounting standards provided pursuant to Section 13(a) of the Exchange Act. ☐
Indicate by check mark whether the registrant has filed a report on and attestation to its management's assessment of the effectiveness of its internal control over financial reporting under Section 404(b) of the Sarbanes-Oxley Act (15 U.S.C. 7262(b)) by the registered public accounting firm that prepared or issued its audit report. Yes ☒ No ☐
If securities are registered pursuant to Section 12(b) of the Act, indicate by check mark whether the financial statements of the registrant included in the filing reflect the correction of an error to previously issued financial statements. ☐
Indicate by check mark whether any of those error corrections are restatements that required a recovery analysis of incentive-based compensation received by any of the registrant's executive officers during the relevant recovery period pursuant to § 240.10D-1(b). ☐
Indicate by check mark whether the registrant is a shell company (as defined in Rule 12b-2 of the Exchange Act). Yes ☐ No ☒
The aggregate market value of the registrant’s common shares held by non-affiliates computed by reference to the price at which the common equity was last sold on June 30, 2025, was approximately US$98.8 billion.
As at February 6, 2026, the registrant had 2,181,830,165 common shares outstanding.
DOCUMENTS INCORPORATED BY REFERENCE:
Not applicable.
EXPLANATORY NOTE
Enbridge Inc., a corporation existing under the Canada Business Corporations Act, qualifies as a foreign private issuer in the United States (US) for purposes of the Securities Exchange Act of 1934, as amended (the Exchange Act). Although, as a foreign private issuer, Enbridge Inc. is not required to do so, Enbridge Inc. currently files annual reports on Form 10-K, quarterly reports on Form 10-Q, and current reports on Form 8-K with the US Securities and Exchange Commission (SEC) instead of filing the reporting forms available to foreign private issuers.
Enbridge Inc. intends to prepare and file a management information circular and related material under Canadian requirements. As Enbridge Inc.’s management information circular is not filed pursuant to Regulation 14A, Enbridge Inc. may not incorporate by reference information required by Part III of this Form 10-K from its management information circular. Accordingly, in reliance upon and as permitted by Instruction G(3) to Form 10-K, Enbridge Inc. will be filing an amendment to this Form 10-K containing the Part III information no later than 120 days after the end of the fiscal year covered by this Form 10-K.
GLOSSARY
|
|
"we", "our", "us" and "Enbridge" |
Enbridge Inc. |
AFUDC |
Allowance for funds used during construction |
AI |
Artificial Intelligence |
Aitken Creek |
Aitken Creek Gas Storage Facility |
Algonquin |
Algonquin Gas Transmission, LLC |
AOCI |
Accumulated other comprehensive income/(loss) |
Army Corps |
the US Army Corps of Engineers |
ARO |
Asset retirement obligations |
Aux Sable |
US Midstream ownership interest in Aux Sable Liquid Products LP, Aux Sable Midstream LLC, Aux Sable Canada LP |
BC |
British Columbia |
bcf/d |
Billion cubic feet per day |
CEP |
Capital Expenditure Programs |
CER |
Canada Energy Regulator |
Dawn |
An extensive network of underground storage pools at the Tecumseh Gas Storage facility and Dawn Hub |
DCP |
DCP Midstream, LP |
East Tennessee |
East Tennessee Natural Gas, LLC |
EBITDA |
Earnings before interest, income taxes and depreciation and amortization |
EEP |
Enbridge Energy Partners, L.P. |
EIEC |
Enbridge Ingleside Energy Center |
EIS |
Environmental Impact Statement |
Enbridge Gas Ontario |
Enbridge Gas Inc. |
EOG |
The East Ohio Gas Company |
EPA |
The US Environmental Protection Agency |
EPS |
Emissions Performance Standards |
Exchange Act |
United States Securities Exchange Act of 1934 |
FERC |
Federal Energy Regulatory Commission |
GHG |
Greenhouse gas |
Gray Oak |
Gray Oak Pipeline, LLC |
Idaho Commission |
Idaho Public Utilities Commission |
ISO |
Incentive Stock Options |
kbpd |
Thousand barrels per day |
LMCI |
Land Matters Consultation Initiative |
LNG |
Liquefied natural gas |
M&N |
Maritimes & Northeast Pipeline |
M&N Canada |
Canadian portion of our Maritimes & Northeast Pipeline |
Michigan State Officials |
the Governor of Michigan and Director of the Michigan Department of Natural Resources |
MPLX |
MPLX LP |
MTS |
Mainline Tolling Settlement |
MW |
Megawatts |
NCI |
Noncontrolling interests |
NEXUS |
NEXUS Gas Transmission, LLC |
NGL |
Natural gas liquids |
North Carolina Commission |
North Carolina Utilities Commission |
OBPS |
Output-based pricing system |
OCI |
Other comprehensive income/(loss) |
OEB |
Ontario Energy Board |
Ohio Commission |
Public Utilities Commission of Ohio |
|
|
OPEB |
Other postretirement benefit obligations |
Phase 1 Decision |
The Ontario Energy Board's Decision and Order on December 21, 2023, on Phase 1 of Enbridge Gas Inc.'s application to establish a 2024 through 2028 Incentive Regulation rate setting framework |
PIR |
Pipeline Infrastructure Replacement |
PSNC |
Public Service Company of North Carolina, Incorporated |
PSU |
Performance Stock Units |
Questar |
Questar Gas Company |
RNG |
Renewable natural gas |
ROE |
Return on Equity |
ROU |
Right-of-use |
RSU |
Restricted Stock Units |
SEC |
US Securities and Exchange Commission |
SEP |
Spectra Energy Partners, LP |
Sixth Circuit |
the US Court of Appeals for the Sixth Circuit |
Spectra Energy |
Spectra Energy, LLC |
Texas Eastern |
Texas Eastern Transmission, LP |
the Band |
Bad River Band of the Lake Superior Tribe of Chippewa Indians |
the Board |
Board of Directors of Enbridge |
the Court |
The US District Court for the Western District of Wisconsin |
the EOG Acquisition |
Enbridge Inc. acquisition of all of the outstanding shares of capital stock of The East Ohio Gas Company on March 6, 2024 |
the First Nations Partnership |
Stonlasec8 Indigenous Investments Limited Partnership |
the Guaranteed Enbridge Notes |
Enbridge's outstanding guaranteed notes |
the Partnerships |
Spectra Energy Partners, LP and Enbridge Energy Partners, L.P. |
the PSNC Acquisition |
Enbridge Inc. acquisition of all of the membership interests of Fall North Carolina Holdco LLC (now Enbridge PSNC Holdings II, LLC), which owns 100% of Public Service Company of North Carolina, Incorporated on September 30, 2024. |
the Questar Acquisition |
Enbridge Inc. acquisition of all of the membership interests of Fall West Holdco LLC (now Enbridge Questar Holdings II, LLC), which owns 100% of Questar Gas Company and its related Wexpro companies on May 31, 2024. |
the Reservation |
The Bad River Reservation |
the Whistler Parent JV |
The joint venture formed by Enbridge Inc., WhiteWater / I Squared Capital and MPLX LP on May 29, 2024 |
TIER |
Alberta’s Technology Innovation and Emissions Reduction Regulation |
Tomorrow RNG |
Six Morrow Renewables operating landfill gas-to-renewable natural gas production facilities |
Tres Palacios |
Tres Palacios Holdings LLC |
UK |
United Kingdom |
US |
United States of America |
US District Court |
US District Court in the Western District of Michigan |
US GAAP |
Generally accepted accounting principles in the United States of America |
US Gas Utilities / the Acquisitions |
Enbridge Inc.'s acquisitions of three US gas utilities from Dominion Energy, Inc. |
USGC |
US Gulf Coast |
Utah Commission |
Utah Public Service Commission |
Vector |
Vector Pipeline L.P. |
VIEs |
Variable interest entities |
Westcoast |
Westcoast Energy Inc. |
Westcoast LP |
Westcoast Energy Limited Partnership |
|
|
Wexpro |
Wexpro Company and its consolidated subsidiaries |
Wyoming Commission |
Wyoming Public Service Commission |
CONVENTIONS
The terms "we", "our", "us" and "Enbridge" as used in this report refer collectively to Enbridge Inc. and its subsidiaries unless the context suggests otherwise. These terms are used for convenience only and are not intended as a precise description of any separate legal entity within Enbridge.
Unless otherwise specified, all dollar amounts are expressed in Canadian dollars, all references to "dollars" or "$" are to Canadian dollars and all references to "US$" are to US dollars. All amounts are provided on a before-tax basis, unless otherwise stated.
FORWARD-LOOKING INFORMATION
Forward-looking information, or forward-looking statements, have been included in this Annual Report on Form 10-K to provide information about us and our subsidiaries and affiliates, including management’s assessment of our and our subsidiaries’ future plans and operations. This information may not be appropriate for other purposes. Forward-looking statements are typically identified by words such as ‘‘anticipate”, “believe”, “estimate”, “expect”, “forecast”, “intend”, “likely”, “plan”, “project”, “target” and similar words suggesting future outcomes or statements regarding an outlook. Forward-looking information or statements included or incorporated by reference in this document include, but are not limited to, statements with respect to the following: our corporate vision and strategy, including strategic priorities and enablers; expected supply of, demand for, exports of and prices of crude oil, natural gas, natural gas liquids (NGL), liquefied natural gas (LNG), renewable natural gas (RNG) and renewable energy; energy transition and lower-carbon energy, and our approach thereto; environmental, social and governance (ESG) and sustainability goals, practices and performance; industry and market conditions; anticipated utilization of our assets; dividend growth and payout policy; financial strength and flexibility; expectations on sources of liquidity and sufficiency of financial resources; expected strategic priorities and performance of the Liquids Pipelines, Gas Transmission, Gas Distribution and Storage, and Renewable Power Generation businesses; the characteristics, anticipated benefits, financing and timing of our acquisitions, dispositions and other transactions, including the anticipated benefits of the acquisitions of three US gas utilities (US Gas Utilities) from Dominion Energy, Inc. (the Acquisitions); expected future actions of regulators and courts; government trade policies and potential impacts of potential and announced tariffs, duties, fees, economic sanctions, or other trade measures and the timing thereof; expected costs, benefits and in-service dates related to announced projects and projects under construction; expected capital expenditures; investable capacity and capital allocation priorities; expected equity funding requirements for our commercially secured growth program; expected future growth, development and expansion opportunities; expected optimization and efficiency opportunities; expectations about our joint venture partners’ ability to complete and finance projects under construction; our ability to successfully integrate the US Gas Utilities; expected closing of acquisitions, dispositions and other transactions and the timing thereof; toll and rate case discussions and proceedings and anticipated timeline and impact therefrom, including those relating to the Gas Distribution and Storage and Gas Transmission businesses; operational, industry, regulatory, climate change and other risks associated with our businesses; and our assessment of the potential impact of the various risk factors identified herein.
Although we believe these forward-looking statements are reasonable based on the information available on the date such statements are made and processes used to prepare the information, such statements are not guarantees of future performance and readers are cautioned against placing undue reliance on forward-looking statements. By their nature, these statements involve a variety of assumptions, known and unknown risks and uncertainties and other factors, which may cause actual results, levels of activity and achievements to differ materially from those expressed or implied by such statements. Material assumptions include the following: the expected supply of, demand for, export of and prices of crude oil, natural gas, NGL, LNG, RNG and renewable energy; anticipated utilization of our assets; exchange rates; inflation; interest rates; tariffs and trade policies; availability and price of labor and construction materials; the stability of our supply chain; operational reliability; maintenance of support and regulatory approvals for our projects and transactions; anticipated in-service dates; weather; the timing, terms and closing of acquisitions, dispositions and other transactions; the realization of anticipated benefits of transactions, including the Acquisitions; governmental legislation; litigation; estimated future dividends and impact of our dividend policy on our future cash flows; our credit ratings; capital project funding; hedging program; expected earnings before interest, income taxes, and depreciation and amortization (EBITDA); expected earnings/(loss); expected future cash flows; and expected distributable cash flow. Assumptions regarding the expected supply of and demand for crude oil, natural gas, NGL, LNG, RNG and renewable energy, and the prices of these commodities, are material to and underlie all forward-looking statements, as they may impact current and future levels of demand for our services. Similarly, exchange rates, inflation, interest rates and tariffs impact the economies and business environments in which we operate and may impact levels of demand for our services and cost of inputs, and are therefore inherent in all forward-looking statements. The most relevant assumptions associated with forward-looking statements regarding announced projects and projects under construction, including estimated completion dates and expected capital expenditures, include the following: the availability and price of labor and construction materials; the stability of our supply chain; the effects of inflation and foreign exchange rates on labor and material costs; the effects of interest rates on borrowing costs; the impact of weather; and customer, government, court and regulatory approvals on construction and in-service schedules and cost recovery regimes.
Our forward-looking statements are subject to risks and uncertainties pertaining to the successful execution of our strategic priorities; operating performance; legislative and regulatory parameters; litigation; acquisitions, dispositions and other transactions and the realization of anticipated benefits therefrom (including the anticipated benefits from the Acquisitions); evolving government trade policies, including potential and announced tariffs, duties, fees, economic sanctions or other trade measures; operational dependence on third parties; dividend policy; project approval and support; renewals of rights-of-way; weather; economic and competitive conditions; public opinion; changes in tax laws and tax rates; exchange rates; inflation; interest rates; commodity prices; access to and cost of capital; our ability to maintain adequate insurance in the future at commercially reasonable rates and terms; political decisions; global geopolitical conflicts and conditions; and the supply of, demand for and prices of commodities and other alternative energy, including but not limited to, those risks and uncertainties discussed in this Annual Report on Form 10-K and in our other filings with Canadian and US securities regulators. The impact of any one assumption, risk, uncertainty or factor on a particular forward-looking statement is not determinable with certainty as these are interdependent and our future course of action depends on management’s assessment of all information available at the relevant time. Except to the extent required by applicable law, we assume no obligation to publicly update or revise any forward-looking statements made in this Annual Report on Form 10-K or otherwise, whether as a result of new information, future events or otherwise. All forward-looking statements, whether written or oral, attributable to us or persons acting on our behalf, are expressly qualified in their entirety by these cautionary statements.
NON-GAAP AND OTHER FINANCIAL MEASURES
Part II. Item 7. Management's Discussion and Analysis of Financial Condition and Results of Operations (MD&A) in this Annual Report on Form 10-K makes reference to non-GAAP and other financial measures, including EBITDA. EBITDA is defined as earnings before interest, income taxes and depreciation and amortization. Management uses EBITDA to assess the performance of Enbridge and to set targets. Management believes the presentation of EBITDA gives useful information to investors as it provides increased transparency and insight into the performance of Enbridge.
The non-GAAP and other financial measures are not measures that have a standardized meaning prescribed by the accounting principles generally accepted in the US (US GAAP) and are not US GAAP measures. Therefore, these measures may not be comparable with similar measures presented by other issuers. A reconciliation of historical non-GAAP and other financial measures to the most directly comparable GAAP measures is set out in this MD&A and is available on our website. Additional information on non-GAAP and other financial measures may be found on our website,www.sedarplus.ca or www.sec.gov.
PART I
ITEM 1. BUSINESS
Enbridge is a leading North American energy infrastructure company. Our core businesses include Liquids Pipelines, which consists of pipelines and terminals in Canada and the US that transport, store and export various grades of crude oil and other liquid hydrocarbons; Gas Transmission, which consists of investments in natural gas pipelines and gathering, processing and storage facilities in Canada and the US; Gas Distribution and Storage, which consists of natural gas utility operations that serve residential, commercial and industrial customers in Canada and the US; and Renewable Power Generation, which consists primarily of investments in wind and solar power generation facilities, as well as geothermal assets, in North America and Europe.
Enbridge is a public company, with common shares that trade on the Toronto Stock Exchange (TSX) and New York Stock Exchange (NYSE) under the symbol ENB. We were incorporated on April 13, 1970 under the Companies Ordinance of the Northwest Territories and were continued under the Canada Business Corporations Act on December 15, 1987.
A more detailed description of each of our businesses and underlying assets is provided below under Business Segments.
CORPORATE VISION AND STRATEGY
VISION
Enbridge, through its diversified businesses, fuels people's quality of life in a safe and socially responsible manner. Our vision is to provide energy in a more planet-friendly way, everywhere people need it. In pursuing this vision, we seek to play a critical role enabling the economic and social well-being of society by providing access to affordable, reliable, and secure energy through our infrastructure which transports, stores, distributes, and generates energy, including liquids, natural gas, renewable power, and lower-carbon fuels.
We aim to be a first-choice investment, supported by our investor value proposition of predictable and stable cash flows, a strong investment grade balance sheet to facilitate growth, 31 years of consecutive dividend increases, and a diversified opportunity set of growth projects in multiple jurisdictions to support continued EBITDA and distributable cash flow per share growth. Our assets are underpinned by long-term contracts, regulated cost-of-service tolling frameworks, power purchase agreements (PPAs), and other low-risk commercial arrangements.
We strive to be the leading energy delivery company in North America and beyond—for customers, communities, investors, regulators, policymakers, and employees. We approach this goal with a focus on worker and public safety, stakeholder relations, customer service, community investment, sustainability, and employee engagement. As part of our community engagement, we remain committed to meaningful dialogue with Indigenous peoples to achieve common goals and constructive outcomes from our projects and operations. We are also committed to advancing investment opportunities with Indigenous groups, as demonstrated by recent partnerships on our oil and gas pipelines and in the development of renewable energy projects.
STRATEGY
Our strategy is underpinned by a deep understanding of local, North American and global energy fundamentals. Through disciplined capital allocation, aligned with our outlook on energy markets, we have become an industry leader with a diversified portfolio of infrastructure super systems across the North American continent, creating a platform for incremental growth. Our robust opportunity set across all businesses, strategic partnerships, and ongoing efficiency improvements position us to drive our business forward. We remain confident in our balanced growth strategy and expect to continue to invest in our diversified footprint of both conventional businesses and complementary lower-carbon opportunities. This includes expanding our gas transmission and storage assets to meet LNG export demand, increasing our gas distribution footprint to meet growing natural gas demand, and continually optimizing and expanding our liquids system. We plan to capitalize on North American electrification trends, including the expansion of data centers, where we can provide integrated customer solutions through our natural gas and renewable power businesses, as well as infrastructure to support ongoing coal-to-gas conversions. Additionally, we are committed to effectively managing our emissions from our operations and building lasting relationships with our stakeholders.
Our assets have reliably generated low-risk, resilient cash flows through multiple commodity cycles as well as various economic and geopolitical environments. We believe that our asset quality, diversity, and ability to provide comprehensive solutions to customers are key differentiators that enable us to be flexible in an uncertain business environment.
As an industry leader that continues to create value over the short and long term, we maintain a robust strategic planning process. We regularly conduct scenario and resiliency analysis on both our assets and business strategy, including testing various opportunities for value enhancements and optimizations. Our Board of Directors (the Board) reviews and provides input on Enbridge's strategy during a dedicated annual strategic planning session and receives updates throughout the year. This enables the Board to monitor progress and consider adjustments as needed.
Consistent with our strategy, we have progressed several of our priorities. For example:
•Our Liquids Pipelines business saw strong volumes on the Mainline System. Newly sanctioned investments include: Mainline Capital Investment, Mainline Optimization Phase 1 (which will increase capacity by 250 thousand barrels per day (kbpd)), Southern Illinois Connector project, and the Pelican Carbon Dioxide (CO2) Hub, partnering with Occidental Petroleum Corporation. Mainline Optimization Phase 2 is in development, subject to finalizing commercial agreements, securing the necessary environmental and regulatory approvals, and meeting investment criteria. We continue to pursue capital efficient optimizations and expansions to provide customers with incremental egress options for North American liquids.
•Our Gas Transmission business grew our Permian natural gas infrastructure presence through a 10% stake in the 2.5 billion cubic feet per day (bcf/d) Matterhorn Express Pipeline, reaching final investment decision on the 3.7 bcf/d Eiger Express Pipeline, and sanctioning the US Gulf Coast Storage Growth Program with 23 billion cubic feet (bcf) of incremental capacity. We made progress in the US Northeast region by sanctioning the Algonquin Gas Transmission Enhancement project. We strengthened our Canadian presence by sanctioning the Birch Grove project, and a 40 bcf expansion of the Aitken Creek gas storage facility (Aitken Creek) to support growing west coast LNG export demand. With the additional growth projects, Gas Transmission comprises approximately 50% of Enbridge’s secured capital program. We continue to work with customers on opportunities to supply gas for new power generation that supports data centers and overall demand growth, and capitalize on strong gas fundamentals to deliver safe, reliable, and lower-carbon energy to North Americans while simultaneously growing LNG exports.
•Our Gas Distribution and Storage business added approximately 68,000 new customers across our utility jurisdictions, reached supportive settlements on rate cases in North Carolina and Utah, continued to advance data center and power generation opportunities, and doubled the capacity of the T-15 Reliability Project which is expected to deliver 0.51 bcf/d to Duke Energy’s Roxboro power plant in North Carolina. We remain committed to assessing low-risk, capital investment opportunities, and providing safe, affordable and reliable energy to customers in Ontario, Québec, Ohio, North Carolina, Utah, Wyoming, and Idaho.
•Our Renewable Power Generation business continued to execute on growth opportunities, including our onshore business where we brought into service the 130 megawatt (MW) Orange Grove Solar facility and advanced construction on the 815 MW Sequoia Solar project, including completion of the first phase during the fourth quarter of 2025. We also sanctioned the 152 MW Easter renewable power and 600 MW Clear Fork Solar projects in Texas, and the Cowboy Phase 1 project, a 365 MW solar farm and an on-site 135 MW battery energy storage system, in Wyoming. We also continued to progress opportunities in our offshore wind business in Europe, including placing the 25 MW Provence Grand Large floating offshore wind project into service, continuing the construction of the Courseulles (Calvados) Offshore Wind project, and successfully implementing a range of portfolio rationalization and cost-efficiency measures.
•We continued to make meaningful progress toward our sustainability goals, reducing emissions from our operations through multiple pathways, including system modernization, and continuing to invest in our lower-carbon businesses. We updated our Indigenous Reconciliation Action Plan to reaffirm our commitment to reconciliation (including new and renewed commitments) and report on our progress, including advancing vital economic partnerships.
•We continued to recycle capital at attractive valuations; in 2025, this included Stonlasec8 Indigenous Investments Limited Partnership (the First Nations Partnership), a group of 38 First Nations in British Columbia (BC), investing in the Westcoast natural gas pipeline system for a 12.47% redeemable noncontrolling interest. We remain focused on disciplined capital allocation, portfolio optimization and diversification, the continued enhancement of our industry-leading cash flow profile and financial strength and flexibility. In addition, we continue to prioritize operating cost reductions across our business to increase our competitiveness and profitability.
These achievements are discussed in further detail in Part II. Item 7. Management's Discussion and Analysis of Financial Condition and Results of Operations.
Looking ahead, our near-term strategic priorities remain similar to past years. As always, our top priorities include proactively advancing the safety of our people and assets, protecting the environment, and maintaining system reliability. We are focused on maintaining and enhancing the value of our existing assets through further optimization, prioritizing in-franchise organic growth, pursuing export-driven opportunities, and continuing to explore complementary lower-carbon investments.
As an example, we are continuing to pursue opportunities related to electrification in North America, where we can utilize our existing gas transmission and distribution infrastructure to safely deliver gas to existing and new power plants being developed, given surging power demand. We are also pursuing opportunities to build new natural gas infrastructure along our network and within our gas distribution territories, combined with providing gas supply and storage to customers. To complement our natural gas offerings, we are also able to provide renewable energy solutions (electricity and renewable credits/offsets) to customers, which we view as a strategic competitive advantage, enabling us to expand our customer base and further extend our growth.
We aim to invest on an attractive, risk-adjusted basis to advance our strategy and maintain an enduring competitive advantage.
Our key strategic priorities include:
Safety and Operational Reliability
Safety and operational reliability are the foundation of our strategy. We strive to achieve and maintain industry leadership in all facets of safety (process, public and personal) and to uphold the highest standards of reliability and integrity across our system to protect our communities and the environment.
Extend Growth
The cornerstone of our growth lies in the successful execution of our slate of secured projects (currently $39 billion through 2033) on schedule and within estimated costs, while maintaining standards for safety, quality, customer satisfaction, and environmental and regulatory compliance. For a discussion of our current portfolio of capital projects, refer to Part II. Item 7. Management's Discussion and Analysis of Financial Condition and Results of Operations - Growth Projects - Commercially Secured Projects.
Our high-quality growth opportunities continue to evolve based on a more positive policy landscape for conventional energy infrastructure. We continue to direct capital towards optimal uses, prioritizing balance sheet strength, investment in capital efficient growth, and regulated utility or utility-like projects. Our scale and diversification drive competitive advantages across the enterprise and generate opportunities for collaboration across businesses. Our four business units share commercial advantages and strong stakeholder relationships that enable opportunities to cross-sell to customers across the business units, providing additional value and the potential for future growth. We carefully assess our investable capacity, deploying capital to the most value-enhancing opportunities available to us, including further organic growth, and complementary accretive "tuck-in" acquisitions that improve our competitive positioning or further strengthen our balance sheet.
Looking ahead, we see strong utilization of our network and opportunities for growth within each of our businesses. For example, we expect that:
•Our infrastructure within the Liquids Pipelines business will remain a vital connection between key supply basins and demand-pull markets such as the refinery hubs in the US Midwest, eastern Canada, and the US Gulf Coast. We are advancing discussions with customers for additional Western Canadian Sedimentary Basin (WCSB) pipeline capacity. We continue to explore capital efficient growth opportunities via system expansions and optimization of operations. Our crude oil export infrastructure will also enable the opportunity to transport lower-carbon fuels and NGL. Leveraging our transportation expertise, we expect additional new growth opportunities for carbon capture and storage in jurisdictions with supportive regulatory regimes.
•Our Gas Transmission business seeks opportunities to extend and expand pipelines and storage, driven by new load demand from gas-fired power generation (to support opportunities like data centers, electrification, coal-to-gas, and reshoring manufacturing), industrial growth, and coastal LNG plants. Our strategic asset positions produce opportunities to accelerate growth and meet customer needs. Our rate regulated cost-of-service business model creates secured growth opportunities that yield predictable, low-risk cash flows. We are also focused on facilitating the connection of new gas supply to key demand centers and the build-out of our Permian gas value chain.
•Our Gas Distribution and Storage business continues to be well positioned to capitalize on the growth offered by the increased need for power, including data centers, modernization of assets, storage development, and major projects supporting commercial and industrial customers' growth needs. We expect to continue to grow our gas utility business through the addition of residential, commercial and industrial sector customers, making capital investments consistent with our regulatory construct.
•Our Renewable Power Generation business continues to be well positioned to capitalize on the continued demand for renewable power, including data centers, through disciplined capital allocation and opportunistic development in supportive jurisdictions. We continue to leverage our strong internal capabilities and customer relationships to execute our development portfolio of high-quality assets.
In addition, we aim to drive growth through optimization and modernization of our systems, including the application of drag-reducing agents and pump station modifications to optimize throughput on our liquids system, capital efficient compression projects in our gas transmission business, and modernization and value chain integration to enhance reliability for customers at our gas utilities. We prioritize the execution of toll settlements and rate case filings to optimize revenue within our liquids, gas transmission and gas distribution businesses. Finally, we are focused on improving productivity and efficiency across all our businesses through innovation, process improvement, and system enhancements.
Maintain Financial Strength and Flexibility
Our financing strategies are designed to maintain strong, investment-grade credit ratings, have the financial capacity to meet our capital funding needs and provide flexibility to manage capital market disruptions. We expect that the current secured capital program can be financed through an equity self-funded model. For further discussion on our financing strategies, refer to Part II. Item 7. Management's Discussion and Analysis of Financial Condition and Results of Operations - Liquidity and Capital Resources.
Disciplined Capital Allocation
We assess the latest fundamental trends, monitor the business landscape, and proactively conduct business development activities with the goal of identifying an industry-leading opportunity set. We screen, analyze and assess these opportunities using a disciplined investment framework with the objective of effectively deploying capital to grow while achieving attractive risk-adjusted returns, within our low-risk utility-like business model.
All investment opportunities are evaluated based on their return profile, potential to advance our strategy, mitigate risks, support our sustainability goals, and create additional financial flexibility. Our primary emphasis in the near term is on capital efficient opportunities to enhance returns across existing businesses (organic expansions and optimizations), system modernization, and utility rate-based investments. We also continue to assess other strong value-enhancing opportunities, including accretive acquisitions that can complement our portfolio.
In evaluating typical investment opportunities, we also consider other potential capital allocation alternatives. Other alternatives for capital deployment depend on our current outlook and include further debt reduction, dividend increases, and share buy-backs.
An "All-of-the-Above" Approach to Energy Evolution
As the global population grows and standards of living continue to improve around the world, we expect energy demand to rise. We, and the communities in which we operate, increasingly recognize the need for affordable, secure and reliable energy while concurrently focusing on environmental impacts. Through collaboration with our stakeholders (including regulators, policymakers, customers, and Indigenous partners), we aim to balance these factors and believe this will take an "all-of-the-above" approach. As a company with diverse energy infrastructure, we are uniquely positioned to help support the energy transition or energy evolution. To meet increased demand across North America and around the world, while continuing to drive down emissions intensity, we believe an energy evolution, which will take all forms of energy, will be required.
Our portfolio of oil, natural gas, and renewable power assets is critical to maintaining a balanced approach that we believe enables a durable energy evolution. For us, this includes reducing the emissions intensity of the conventional fuels we transport and store, facilitating the shift from higher emission energy sources to natural gas, advancing the integration of renewable energy sources, and investing in infrastructure for emerging lower-carbon solutions, all while supporting projects that meet our risk and return criteria.
We work closely with our customers, stakeholders, and third-party experts to monitor the evolving energy system and actively leverage our execution and sustainability capabilities to advance our positioning as a differentiated energy provider.
STRATEGIC ENABLERS
To successfully execute our strategy and build competitive advantages, we focus on sustainability, operations and development, talent, technology, and growth capabilities.
Sustainability
Sustainability is foundational to Enbridge’s strategy and long-term value creation. Our performance as a safe operator, environmental steward, inclusive employer, and responsible corporate citizen directly supports our ability to deliver reliable and affordable energy.
Since setting our sustainability goals in 2020, we have made considerable progress integrating sustainability into our strategy, governance, operations, and decision-making. We have linked sustainability performance to incentive compensation and are making meaningful progress toward these goals by executing on our action plans. Our 24th annual Sustainability Report details our progress and can be found at https://www.enbridge.com/sustainability-reports.
Unless otherwise specifically stated, none of the information contained on, or connected to, the Enbridge website, including our annual Sustainability Report, is incorporated by reference in, or otherwise part of, this Annual Report on Form 10-K.
Operations and Development
As a major infrastructure developer and operator, Enbridge focuses on excellence in our business, specifically in safety, regulatory, project execution, and efficiency. Safety is foundational at Enbridge, and our safety-first mindset reflects our commitment to protecting the public, our workers, the environment, and the health of our pipelines and facilities. We recognize the importance of having strong trusted relationships with our regulators as we plan and execute projects, and sustain ongoing operations. We are committed to being proactive on regulatory matters at the federal, regional, and local levels to develop and maintain a safe and reliable energy system that our customers and the public can count on.
Robust project development, execution, governance, stakeholder relations, and supply chain optimization are also key to delivering projects on time, at high quality, and within estimated costs. We continually seek ways to improve our organizational efficiency and effectiveness across all our core functions, including streamlining structures, simplifying processes, improving accountability, and effectively managing risk to drive top-tier performance.
Talent
Our workforce is essential to our success; our focus remains on enhancing the capabilities and skills of our people, and we believe our approach to people leadership drives business performance. We are evolving our talent strategy, enhancing our employee experience, and elevating our focus on learning and development. Furthermore, we strive to maintain industry-competitive compensation, flexibility, and retention programs that provide both short- and long-term performance incentives. We prioritize inclusion and diversity of thought, along with our other business strategies, because it is fundamentally important to our values and culture.
Technology
We recognize the vital role technology plays in helping us achieve our strategic objectives. Our digital business enablement strategy focuses on innovation and digital technology solutions that further our safety and reliability, maximize revenues, reduce costs, and enable transition to new energy solutions. We focus on the resilience and reliability of our systems from a cybersecurity perspective, including enhancing our capabilities and educating our workforce to protect our critical infrastructure system from increasing threats. We continue to leverage artificial intelligence (AI) to drive advancements in safety, emissions reduction, and asset optimization. Examples include the application of machine learning to optimize energy usage and the use of advanced AI models to support pipeline system optimization. This strategy has also enabled us to make AI accessible across Enbridge in various forms, from self-service tools to custom-built solutions.
Growth Capabilities
To achieve our vision, we emphasize specific capabilities, including the ability to offer integrated and differentiated solutions, that will help us grow and build competitive advantages within our core and potential new businesses. We continue to focus on our customers so that we are responsive to their needs. We are continuing to invest in leading corporate development capabilities to enable us to identify and execute on attractive acquisitions and capital recycling opportunities. Finally, we believe that the future energy system will not only continue to be highly integrated but will also become more complex. Strengths in partnership structuring and relationship management is an important factor in building and maintaining robust energy infrastructure systems.
BUSINESS SEGMENTS
During 2025, our activities were carried out through four business segments: Liquids Pipelines, Gas Transmission, Gas Distribution and Storage, and Renewable Power Generation, as discussed below.
LIQUIDS PIPELINES
Liquids Pipelines consists of pipelines and terminals in Canada and the US that transport, store and export various grades of crude oil and other liquid hydrocarbons. The system delivers approximately six million barrels per day (mmbpd) and represents the largest global crude oil and liquids network.
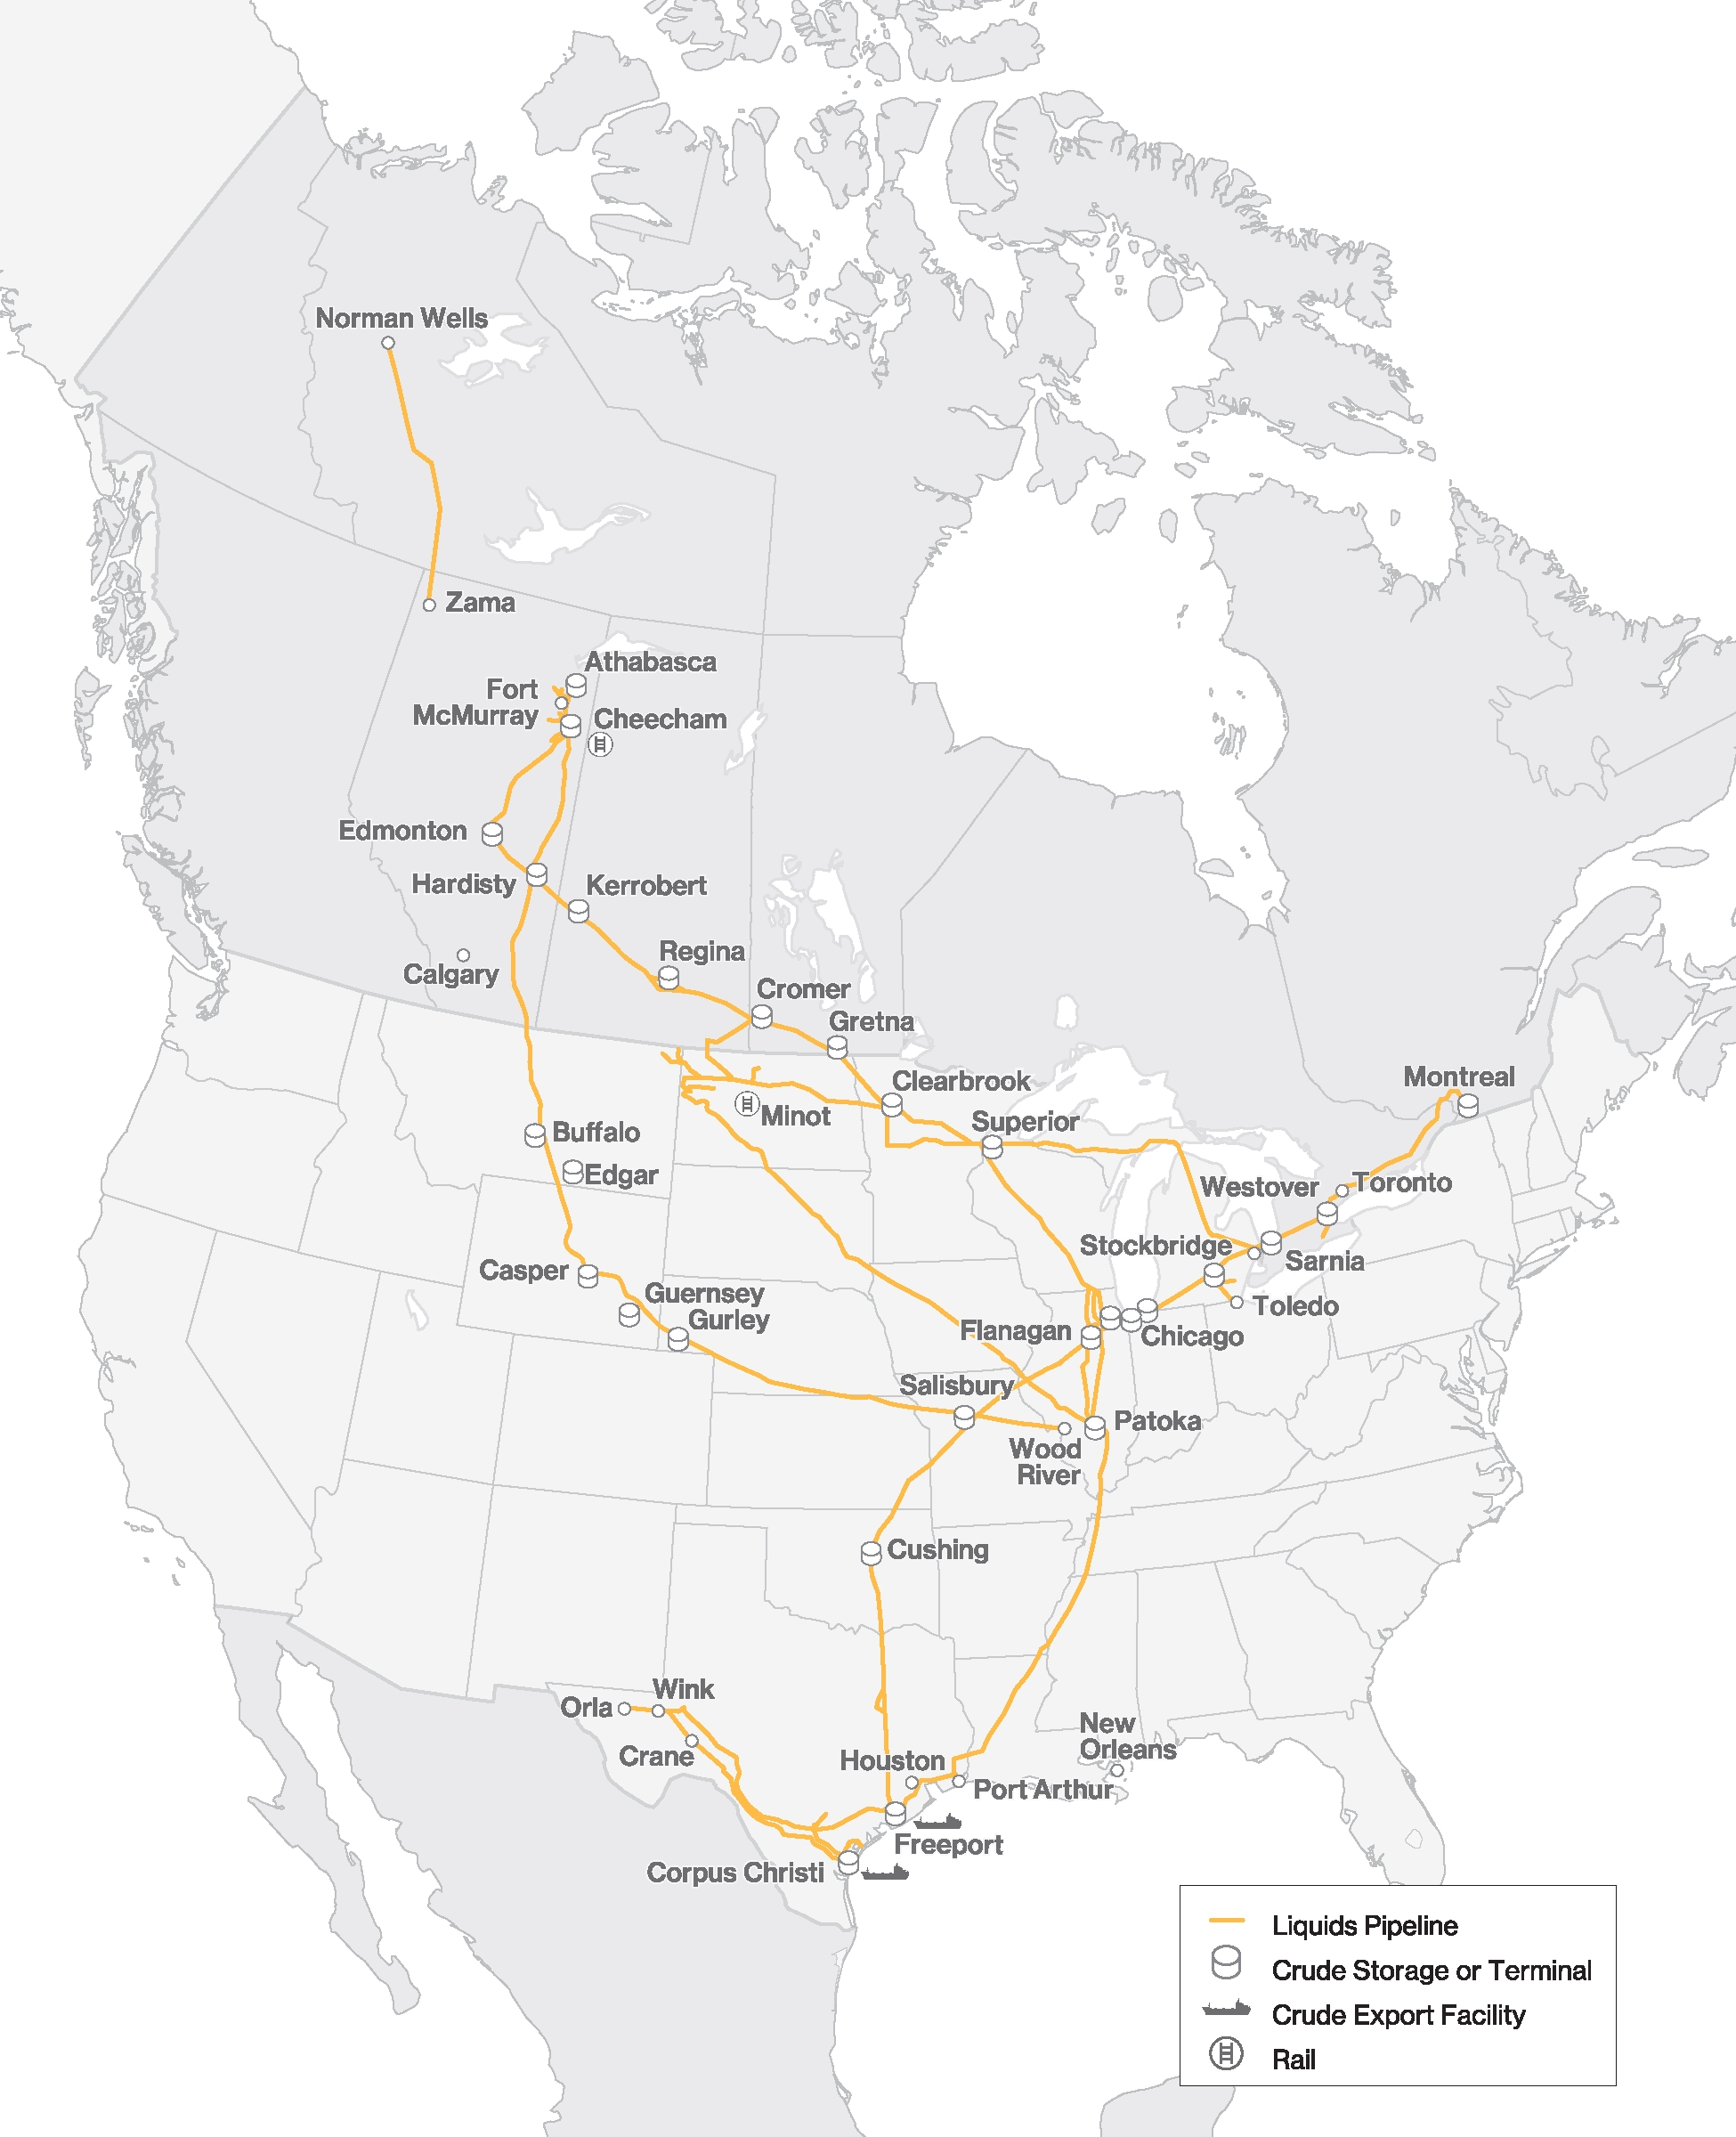
MAINLINE SYSTEM
The Mainline System is a common carrier pipeline comprised of the Canadian Mainline and the Lakehead System. The Canadian Mainline transports various grades of crude oil and other liquid hydrocarbons within western Canada and from western Canada to the Canada/US border near Gretna, Manitoba and Neche, North Dakota and from the US/Canada border near Port Huron, Michigan and Sarnia, Ontario to eastern Canada. The Canadian Mainline includes six adjacent pipelines with a combined operating capacity of approximately 3.2 mmbpd that connect with the Lakehead System at the Canada/US border, as well as five pipelines that deliver crude oil and refined products into eastern Canada. We have operated, and frequently expanded, the Canadian Mainline since 1949. The Lakehead System is the portion of the Mainline System in the US. It is an interstate common carrier pipeline system regulated by the Federal Energy Regulatory Commission (FERC) and is the primary transporter of crude oil and liquid hydrocarbons from western Canada to the US.
Tolling Framework
The Mainline Tolling Settlement (MTS) is a negotiated settlement with a term of seven and a half years through the end of 2028 that covers both the Canadian and US portions of the Mainline, except for Lines 8 and 9 which are tolled on a separate basis. The CER issued an order on March 4, 2024 approving Enbridge’s application as filed. The MTS provides for a Canadian Local Toll for deliveries within western Canada, as well as an International Joint Tariff (IJT) for crude oil shipments originating in western Canada, on the Canadian Mainline, and delivered into the US, via the Lakehead System, and into eastern Canada. Under the MTS, the Mainline operates as a common carrier system available to all shippers on a monthly nomination basis.
The MTS includes:
•an IJT, for heavy crude oil movements from Hardisty to Chicago, comprised of an initial Canadian Mainline Toll of $1.65 per barrel plus an initial Lakehead System Toll of US$2.57 per barrel, plus the applicable Line 3 Replacement surcharge;
•toll escalation for operation, administration, and power costs tied to US consumer price and US and Canadian power indices;
•tolls that are distance and commodity adjusted, and utilize a dual currency IJT; and
•a financial performance collar that provides incentives for Enbridge to optimize throughput and cost, but also provides downside protection in the event of extreme supply or demand disruptions or unforeseen operating cost exposure. This performance collar is intended to ensure the Mainline earns 11% to 14.5% returns, on a deemed 50% equity capitalization.
Approximately 70% of Mainline deliveries are tolled under this settlement, while approximately 30% of deliveries are tolled on a full path basis to markets downstream of the Mainline.
Lakehead System Local Tolls
Transportation rates are governed by the FERC for deliveries from the Canada/US border near Neche, North Dakota, Clearbrook, Minnesota and other points to principal delivery points on the Lakehead System. The Lakehead System periodically adjusts these transportation rates as allowed under the FERC’s index methodology and tariff agreements, the main components of which are index rates and the Facilities Surcharge Mechanism (FSM). Index rates, the base portion of the transportation rates for the Lakehead System, are subject to an annual inflationary adjustment which cannot exceed established ceiling rates as approved by the FERC. The FSM allows the Lakehead System to recover costs associated with certain shipper-requested projects through an incremental surcharge in addition to the existing base rates and is subject to annual adjustment on April 1 of each year.
The Lakehead tolls are subject to the Lakehead System Settlement approved by the FERC on November 27, 2023.
The Lakehead System Settlement establishes a depreciation truncation date of December 31, 2048 for the rate base applicable to the Index and FSM, and sets out on the terms for future recovery - through the Facilities Surcharge - of two Line 5 projects: the Wisconsin Relocation Project and the Straits of Mackinac Tunnel.
REGIONAL OIL SANDS SYSTEM
The Regional Oil Sands System includes seven intra-Alberta long-haul pipelines: the Athabasca Pipeline, Waupisoo Pipeline, Woodland and Woodland Extension Pipelines, Wood Buffalo and Wood Buffalo Extension/Athabasca Twin pipeline system and the Norlite Pipeline System (Norlite), as well as two large terminals: the Athabasca Terminal located north of Fort McMurray, Alberta and the Cheecham Terminal, located south of Fort McMurray, Alberta. The Regional Oil Sands System also includes numerous laterals and related facilities which provide connectivity for several oil sands customers to the Edmonton and Hardisty areas.
The combined capacity of the intra-Alberta long-haul pipelines is approximately 1.1 mmbpd to Edmonton and 1.4 mmbpd into Hardisty, with Norlite providing approximately 230 kbpd of diluent capacity into the Fort McMurray region. We have a 50% interest in the Woodland Pipeline and a 70% interest in Norlite. The Regional Oil Sands System is anchored by long-term agreements with multiple oil sands producers that provide cash flow stability and also include provisions for the recovery of some of the operating costs of this system.
Athabasca Indigenous Investments Limited Partnership, an entity representing 23 First Nation and Metis communities, own an 11.6% non-operating interest in the seven intra-Alberta long-haul pipelines in the Regional Oil Sands System.
GULF COAST AND MID-CONTINENT SYSTEMS
Gulf Coast includes Flanagan South, Spearhead Pipeline, Seaway Crude Pipeline System (Seaway Pipeline), the Mid-Continent System (Cushing Terminal), Gray Oak, and the Enbridge Ingleside Energy Center (EIEC).
Flanagan South is a 950 kilometer (590 mile), 36-inch diameter interstate crude oil pipeline that originates at our terminal at Flanagan, Illinois, a delivery point on the Lakehead System, and terminates in Cushing, Oklahoma. Flanagan South has a capacity of approximately 700 kbpd.
Spearhead Pipeline is a 938 kilometer (583 mile), 22-to-24-inch diameter long-haul pipeline that delivers crude oil from Flanagan, Illinois, a delivery point on the Lakehead System, to Cushing, Oklahoma. The Spearhead Pipeline has a capacity of approximately 193 kbpd.
We have a 50% interest in the 1,078 kilometer (670 mile) Seaway Pipeline, including the 805 kilometer (500 mile), 30-inch diameter long-haul system between Cushing, Oklahoma and Freeport, Texas, as well as the Texas City Terminal and Distribution System, which serve refineries in the Houston and Texas City areas. Total aggregate capacity on the Seaway Pipeline system is approximately 950 kbpd. The Seaway Pipeline also includes 8.8 million barrels of crude oil storage tank capacity on the Texas Gulf Coast export docks.
The Mid-Continent System is comprised of storage terminals at Cushing Terminal, consisting of over 110 individual storage tanks ranging in size from 78 to 570 thousand barrels. Total storage shell capacity of Cushing Terminal is approximately 26 million barrels. A portion of the storage facilities are used for operational purposes, while the remainder is contracted to various crude oil market participants for their term storage requirements. Contract fees include fixed monthly storage fees, throughput fees for delivering crude to connecting pipelines and terminals, and blending fees.
Gray Oak is a 1,368 kilometer (850 mile) crude oil system, transporting light crude oil, with origination points in the Eagle Ford and Permian Basins in West Texas. Gray Oak has delivery points at the US Gulf Coast and Houston refining region. As part of a phased expansion, Gray Oak added 80 kbpd to its capacity in 2025, bringing the current average annual capacity to 980 kbpd; phase two of the expansion is expected to add a further 40 kbpd to the system, and increase average annual capacity to 1.0 mmbpd in 2026. Our effective economic interest in Gray Oak is 68.5%. Enbridge has been the operator of Gray Oak since April 2023.
We own 100% of the EIEC, the largest crude oil export terminal by volume in North America. EIEC has an export capability of 1.6 mmbpd. EIEC’s total storage capability is 17.6 million barrels with construction underway to add a further two million barrels of storage in early 2026 as part of a Phase VII expansion project. We also own 100% interest in each of the 300-kbpd Viola pipeline, and the 350-thousand barrel Taft Terminal, both located near Corpus Christi, Texas. Additionally, in October 2024 we completed the acquisition of two marine docks and land adjacent to EIEC. This acquisition adds crude oil export capacity and streamlines existing EIEC operations by increasing Very Large Crude Carrier windows on the primary facility docks. We also have a total 30% non-operating ownership interest in Cactus II Pipeline, a pipeline that travels from Wink to Ingleside within Texas.
OTHER
Other includes Southern Lights Pipeline, Express-Platte System, Bakken System and Feeder Pipelines and Other.
The Southern Lights Pipeline is a single stream 2,560 kilometer (1,591 mile) 198 kbpd 16/18/20-inch diameter pipeline that ships diluent from the Manhattan Terminal near Chicago, Illinois to delivery facilities, located in Edmonton, Alberta. The Canadian portion of the Southern Lights Pipeline receives tariff revenues under long-term contracts with committed shippers, in addition to both the Canadian and US segments receiving toll revenue from uncommitted transportation movements. The Southern Lights Pipeline capacity is approximately 90% contracted with the remaining capacity made available for uncommitted volumes. A fully subscribed open season was completed in December 2024, which ensures contract levels remain at 90% through mid-2030.
The Express-Platte System consists of the Express Pipeline and the Platte Pipeline, and crude oil storage of approximately 5.6 million barrels. It is an approximately 2,736 kilometer (1,700 mile) long, 20-to-24-inch diameter crude oil transportation system, which begins at Hardisty, Alberta, and terminates at Wood River, Illinois. The 310 kbpd Express Pipeline carries crude oil to US refining markets in the Rocky Mountains area, including Montana, Wyoming, Colorado and Utah. The 145 to 164 kbpd Platte Pipeline, which interconnects with the Express Pipeline at Casper, Wyoming, transports crude oil predominantly from the Bakken shale and western Canada to refineries in the Midwest. The Express Pipeline capacity is typically committed under long-term take-or-pay contracts with shippers. A small portion of the Express Pipeline capacity and all of the Platte Pipeline capacity is used by uncommitted shippers who pay only for the pipeline capacity they actually use in a given month.
The Bakken System consists of the North Dakota System and the Bakken Pipeline System, with total length of 3,080 kilometers (1,914 miles) and 30-inch diameter. The North Dakota System services the Bakken Basin in North Dakota and is comprised of a crude oil gathering and interstate pipeline transportation system. The gathering system provides delivery to Clearbrook, Minnesota for service on the Lakehead system or a variety of interconnecting pipelines. The interstate portion of the system has both US and Canadian components that extend from Berthold, North Dakota into Cromer, Manitoba.
Tariffs on the US portion of the North Dakota System are regulated by the FERC. The Canadian portion is categorized as a Group 2 pipeline, and as such, its tolls are regulated by the CER on a complaint basis.
We have an effective 27.6% interest in the Bakken Pipeline System, which connects the Bakken Basin in North Dakota to markets in eastern Petroleum Administration for Defense Districts (PADD) II and the US Gulf Coast. The Bakken Pipeline System consists of the Dakota Access Pipeline from the Bakken area in North Dakota to Patoka, Illinois, and the Energy Transfer Crude Oil Pipeline from Patoka, Illinois to Nederland, Texas. Current capacity is approximately 750 kbpd of crude oil with the potential to be expanded through additional pumping horsepower. The Bakken Pipeline System is anchored by long-term throughput commitments from a number of producers.
Feeder Pipelines and Other includes a number of liquids storage assets and pipeline systems in Canada and the US.
Key assets included in Feeder Pipelines and Other are the Hardisty Contract Terminal and Hardisty Storage Caverns located near Hardisty, Alberta, a key crude oil pipeline hub in western Canada and the Southern Access Extension (SAX) Pipeline which originates in Flanagan, Illinois and delivers to Patoka, Illinois. We have an effective 65% interest in the 300 kbpd SAX pipeline. The majority of the SAX Pipeline's capacity is commercially secured under long-term take-or-pay contracts with shippers.
Feeder Pipelines and Other also includes Patoka Storage, the Toledo pipeline system and the Norman Wells (NW) System. Patoka Storage is comprised of four storage tanks with 480 thousand barrels of shell capacity located in Patoka, Illinois. The 180 kbpd Toledo pipeline system connects with the Lakehead System and delivers to Ohio and Michigan. The 45 kbpd NW System transports crude oil from Norman Wells in the Northwest Territories to Zama, Alberta and has a cost-of-service rate structure based on established terms with shippers. In January 2026, our sole customer of the NW system announced that they will cease operations in Norman Wells later in 2026.
The Liquids Pipelines segment also includes the crude oil marketing business in Canada and the US, which provides physical commodity marketing and logistical services to North American refiners, producers, and other customers. The business is primarily focused on servicing customers across the value chain and capturing value from quality, time, and location price differentials when opportunities arise. To execute these strategies, the crude oil marketing business transports and stores on both Enbridge-owned and third-party assets using a combination of contracted pipeline, storage, railcar, and truck capacity agreements.
COMPETITION
Competition for our liquids pipelines network comes primarily from infrastructure or logistics alternatives (e.g., rail or trucking) that transport liquid hydrocarbons from production basins in which we operate to markets in Canada, the US and internationally. Competition from existing pipelines is based primarily on access to supply, end use markets, the cost of transportation, contract structure and the quality and reliability of service. Additionally, volatile crude price differentials and insufficient pipeline capacity on either our or competitors' pipelines can make transportation of crude oil by rail competitive, particularly to markets not currently served by pipelines.
We believe that our liquids pipelines systems will continue to provide competitive and attractive options to producers in the WCSB, the Bakken Basin, and the Permian Basin, due to our market access, competitive tolls and flexibility through our multiple delivery and storage points. We also employ long-term agreements with shippers, which mitigate competition risk by ensuring consistent supply to our liquids pipelines network. We have a proven track record of successfully executing projects to meet the needs of our customers.
Earnings from our crude oil marketing business are primarily generated from arbitrage opportunities which, by their nature, can be replicated by competitors. An increase in market participants entering into similar arbitrage strategies could have an impact on our earnings. Efforts to mitigate competition risk include diversification of the marketing business by transacting at the majority of major hubs in North America and establishing long-term relationships with clients and pipelines.
SUPPLY AND DEMAND
We have an established and successful history of being the largest transporter of crude oil to the US, the world’s largest market for crude oil. We expect that US demand for Canadian crude oil production will continue to support the use of our infrastructure for the foreseeable future.
Under most base case forecasts, demand is expected to grow into the next decade, primarily driven by emerging economies in regions outside the Organization for Economic Cooperation and Development (OECD), such as India and broader Southeast Asia. In North America, demand growth for transportation fuels is expected to slow over time due to vehicle fuel efficiency improvement and rising adoption of electric vehicles.
The Organization of Petroleum Exporting Countries is expected to continue to balance markets and manage prices with production quotas, despite accelerated developments of offshore production in both Brazil and Guyana and continued growth from Canada and the US. In the US, long-term growth will likely be driven by the Permian Basin, a large and cost-competitive light crude oil resource base. In addition, heavy crude oil growth is expected from the WCSB as additional egress availability will likely support expansion of existing projects and some potential new greenfield facilities.
Our Mainline System was effectively fully utilized in 2025, delivering 3.1 mmbpd. Refinery demand in the upper Midwest PADD II market has been strong. On the US Gulf Coast, lower supply of heavy crude from Latin America and the Middle East continues to drive increased demand for Canadian heavy crude. Many of the refineries connected to the Mainline System are complex and competitive in the global context.
The anticipated combination of long-term demand growth in non-OECD nations, domestic demand contraction over time, and continued production growth in the Permian Basin and WCSB, highlights the importance of our strategic asset footprint and reinforces the need for additional export-oriented infrastructure. We believe that we are well positioned to meet these evolving supply and demand fundamentals through expansion of system capacity for incremental access to the US Gulf Coast, and through further development of our EIEC in Corpus Christi, including the full integration and optimization of the Flint Hills marine docks and land acquired in October 2024.
Opposition to fossil fuel development in conjunction with evolving consumer preferences and new technologies could underpin energy transition scenarios impacting long-term supply and demand of crude oil. We continue to closely monitor the evolution of all of these factors to be able to proactively adapt our business to help meet our customers’ and society’s energy needs.
These supply and demand dynamics are evolving, as the current political climate in Canada and the US continues to shift, including as a result of changes in governments, trade relations, and global geopolitical conflicts and conditions, such as the political situation in Venezuela. We continue to monitor these developments together with their impact on our business.
GAS TRANSMISSION
Gas Transmission consists of our investments in natural gas pipelines and gathering, processing and storage facilities in Canada and the US, including US Gas Transmission, Canadian Gas Transmission, and Other assets.
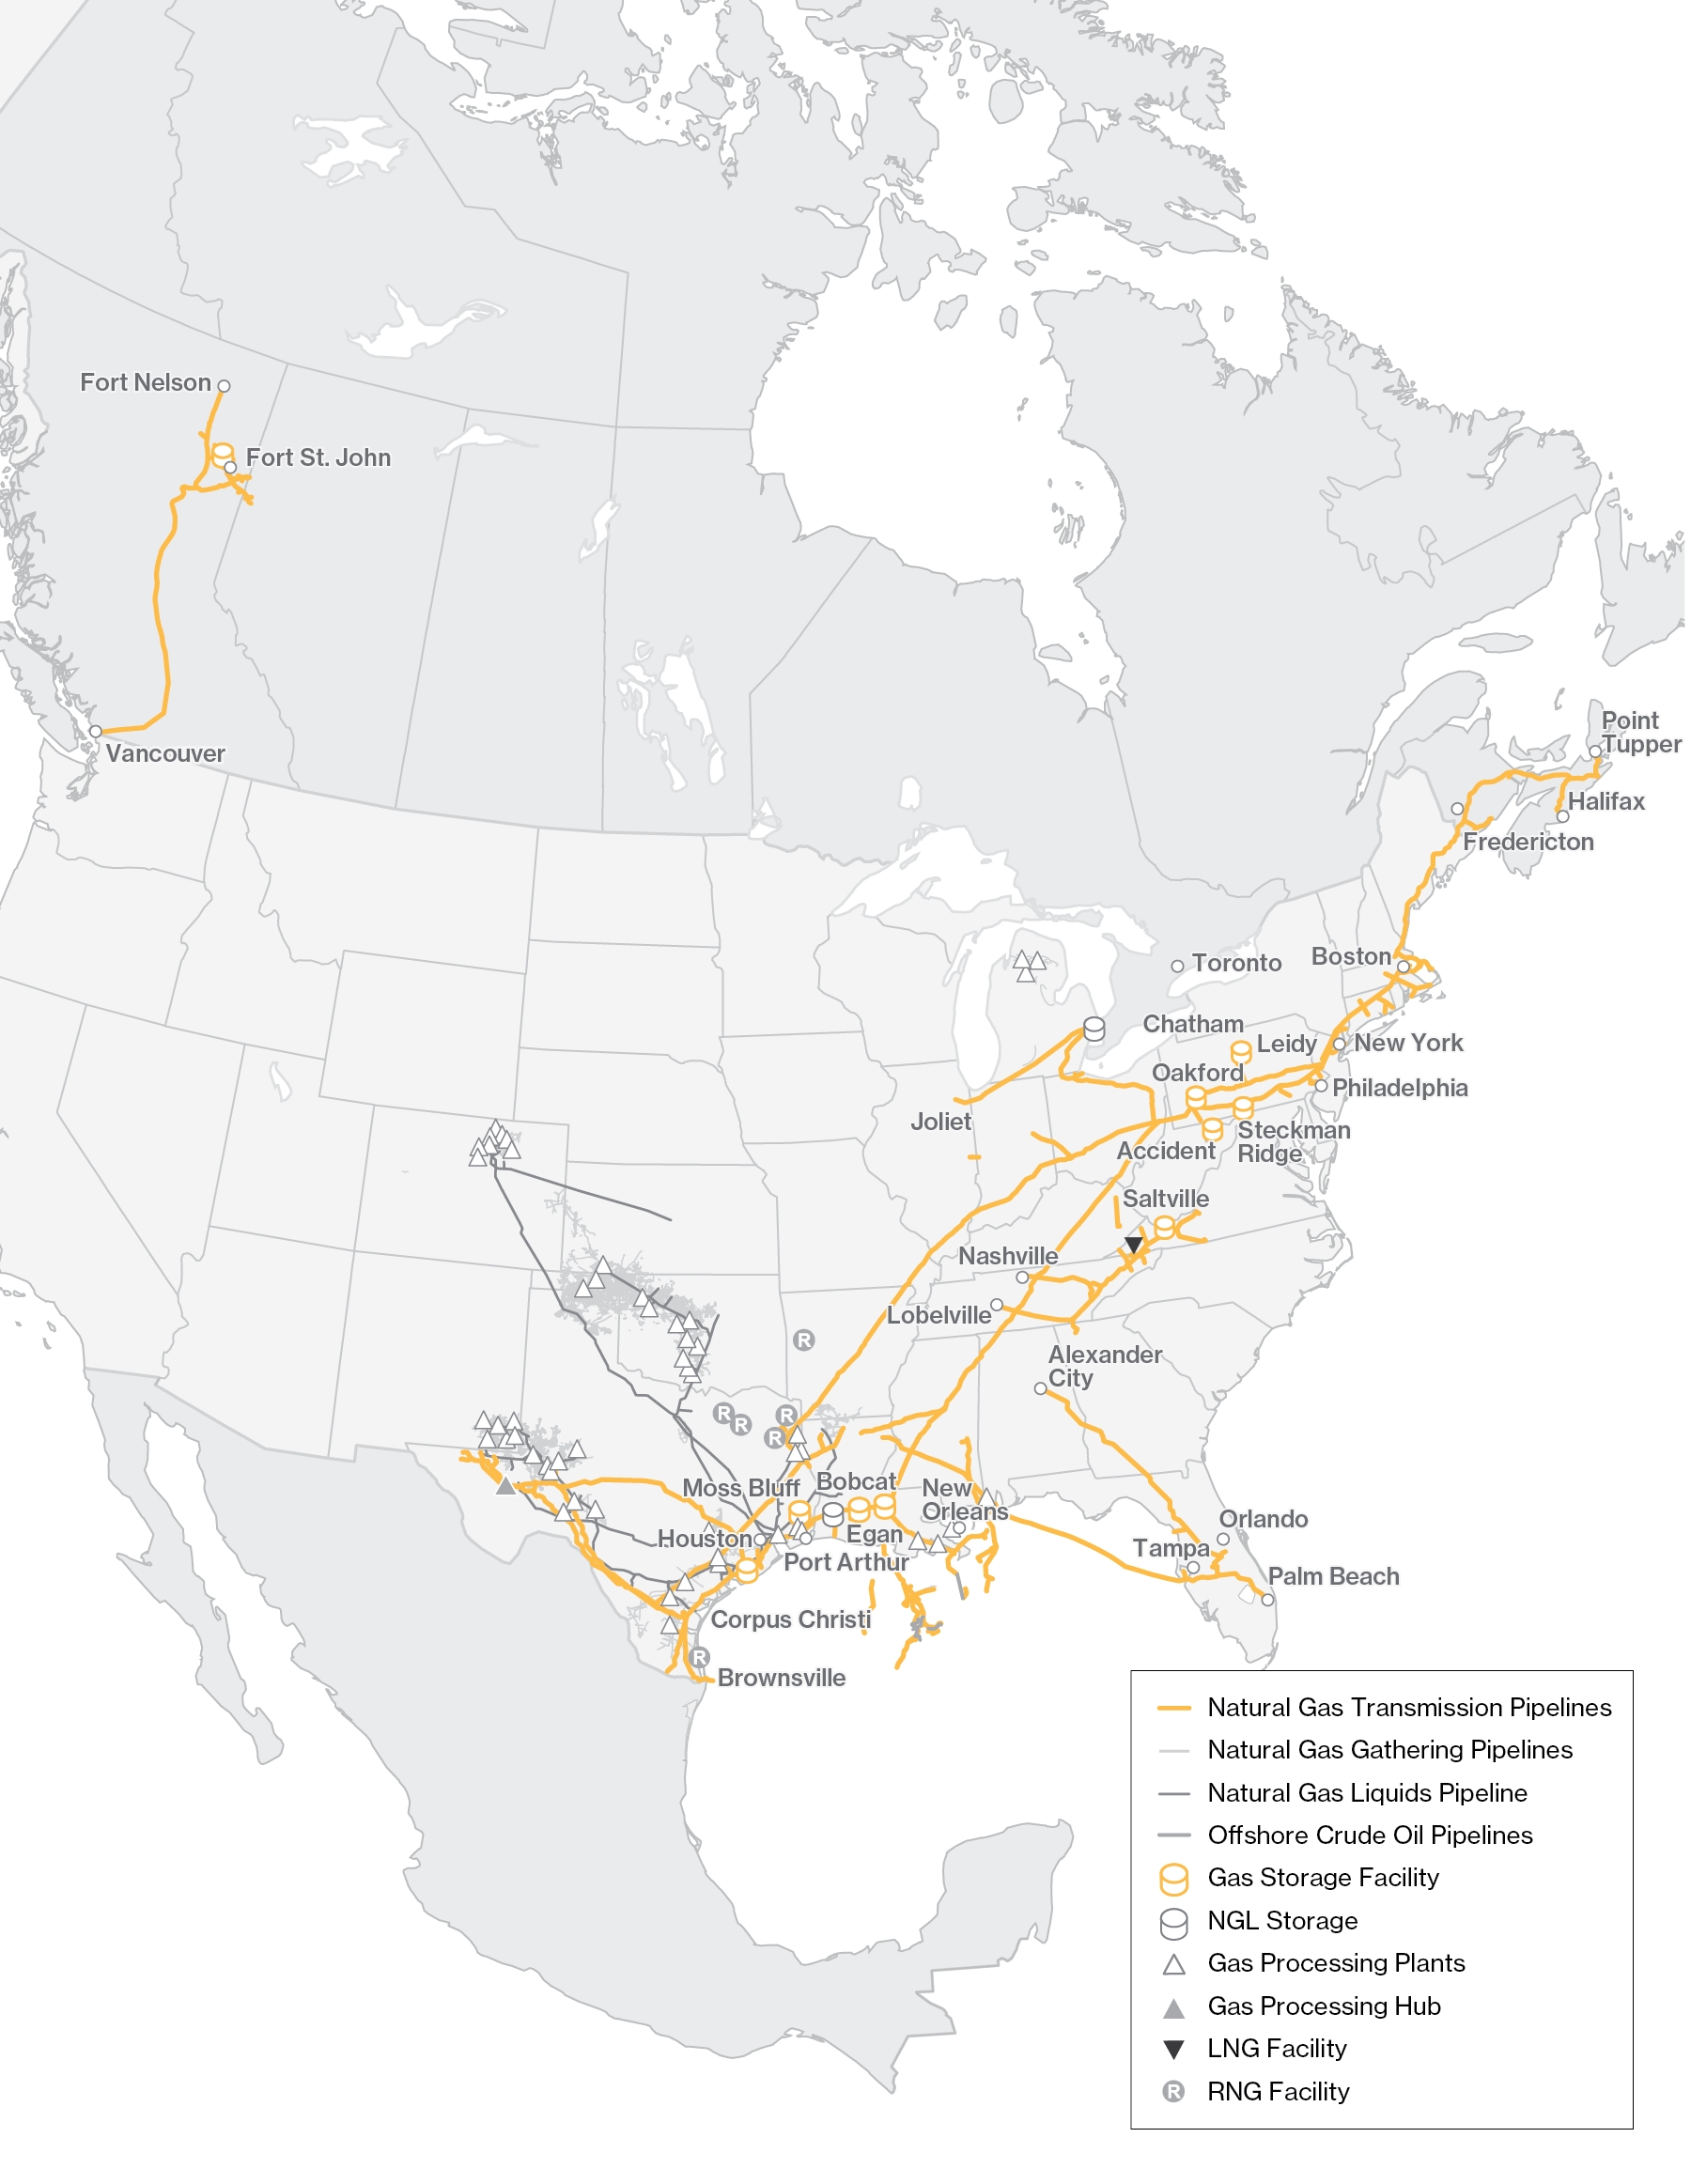
US GAS TRANSMISSION
US Gas Transmission includes ownership interests in Texas Eastern Transmission, LP (Texas Eastern), Algonquin Gas Transmission, LLC (Algonquin), Maritimes & Northeast (M&N) (US and Canada), East Tennessee Natural Gas, LLC (East Tennessee), Valley Crossing Pipeline, LLC (Valley Crossing), Vector Pipeline L.P. (Vector), Gulfstream Natural Gas System, L.L.C. (Gulfstream), Sabal Trail Transmission, LLC (Sabal Trail), NEXUS Gas Transmission, LLC (NEXUS), Southeast Supply Header, LLC (SESH), , Whistler Parent, LLC (Whistler Parent JV), Delaware Basin Residue, LLC (DBR), Matterhorn Express, LLC (MXP) and certain other gas pipeline and storage assets. The US Gas Transmission business primarily provides transmission and storage of natural gas through interstate pipeline systems for customers in various regions of the northeastern, southern and Midwestern US.
The Texas Eastern interstate natural gas transmission system extends from supply and demand centers in the Gulf Coast region of Texas and Louisiana to supply and demand centers in Ohio, Pennsylvania, New Jersey and New York. Texas Eastern's onshore system has a peak day capacity of 12.1 bcf/d of natural gas on approximately 13,745 kilometers (8,541 miles) of pipeline and associated compressor stations. Texas Eastern is also connected to five affiliated storage facilities that are partially or wholly-owned by other entities within the US Gas Transmission business, including the Tres Palacios Holdings LLC storage facility that we acquired in 2023.
The Algonquin interstate natural gas transmission system connects with Texas Eastern’s facilities in New Jersey and extends through New Jersey, New York, Connecticut, Rhode Island and Massachusetts where it connects to M&N US. The system has a peak day capacity of 3.1 bcf/d of natural gas on approximately 1,817 kilometers (1,129 miles) of pipeline with associated compressor stations.
M&N US has a peak day capacity of 0.8 bcf/d of natural gas on approximately 552 kilometers (343 miles) of mainline interstate natural gas transmission system, including associated compressor stations, which extends from northeastern Massachusetts to the border of Canada near Baileyville, Maine. M&N Canada has a peak day capacity of 0.5 bcf/d on approximately 885 kilometers (550 miles) of interprovincial natural gas transmission mainline system that extends from Goldboro, Nova Scotia to the US border near Baileyville, Maine. We have a 78% interest in M&N US and M&N Canada.
East Tennessee’s interstate natural gas transmission system has a peak day capacity of 1.9 bcf/d of natural gas, crosses Texas Eastern’s system at two locations in Tennessee, and consists of two mainline systems totaling approximately 2,449 kilometers (1,522 miles) of pipeline in Tennessee, Georgia, North Carolina and Virginia, with associated compressor stations. East Tennessee has an LNG storage facility in Tennessee and also connects to the Saltville storage facilities in Virginia.
Valley Crossing is an approximately 285 kilometer (177 mile) intrastate natural gas transmission system, with associated compressor stations. The pipeline infrastructure is located in Texas and provides market access of up to 2.6 bcf/d of design capacity to the Comisión Federal de Electricidad, Mexico’s state-owned utility.
Vector is an approximately 560 kilometer (348 mile) pipeline travelling between Joliet, Illinois in the Chicago area and Ontario. Vector can deliver 1.7 bcf/d of natural gas, of which 455 million cubic feet per day (mmcf/d) is leased to NEXUS. We have a 60% interest in Vector.
Gulfstream is an approximately 1,199 kilometer (745 mile) interstate natural gas transmission system with associated compressor stations. Gulfstream has a peak day capacity of 1.4 bcf/d of natural gas from Mississippi, Alabama, Louisiana and Texas, crossing the Gulf Coast to markets in central and southern Florida. We have a 50% interest in Gulfstream.
Sabal Trail is an approximately 832 kilometer (517 mile) interstate pipeline that provides firm natural gas transportation. Facilities include a pipeline, laterals and various compressor stations. The pipeline infrastructure is located in Alabama, Georgia and Florida, and adds approximately 1.0 bcf/d of capacity enabling the access of onshore gas supplies. We have a 50% interest in Sabal Trail.
NEXUS is an approximately 414 kilometer (257 mile) interstate natural gas transmission system with associated compressor stations. NEXUS transports natural gas from our Texas Eastern system in Ohio to our Vector interstate pipeline in Michigan, with peak day capacity of 1.4 bcf/d. Through its interconnect with Vector, NEXUS provides a connection to Dawn Hub, the largest integrated underground storage facility in Canada and one of the largest in North America, located in southwestern Ontario adjacent to the Greater Toronto Area. We have a 50% interest in NEXUS.
SESH is an approximately 462 kilometer (287 mile) interstate natural gas transmission system with associated compressor stations. SESH extends from the Perryville Hub in northeastern Louisiana where the shale gas production of eastern Texas, northern Louisiana and Arkansas, along with conventional production, is reached from six major interconnections. SESH extends to Alabama, interconnecting with 14 major north-south pipelines and three high-deliverability storage facilities and has a peak day capacity of 1.1 bcf/d of natural gas. We have a 50% interest in SESH.
The Whistler Parent JV, formed in May 2024, holds a 100% interest in Whistler Pipeline, LLC (Whistler), a 450 mile intrastate pipeline with associated compressor stations that extends from the Permian Basin to Agua Dulce, Texas area with a capacity of 2.5 bcf/d, a 70% interest in ADCC Pipeline, LLC, a 40 mile pipeline that extends from Agua Dulce, Texas to Cheniere Energy’s Corpus Christi LNG export facility with a capacity of 1.7 bcf/d, and a 50% interest in Waha Gas Storage, LLC, a 2.0 bcf gas storage cavern facility connecting to key Permian egress pipelines including Whistler. We have a 19% interest in the Whistler Parent JV.
DBR holds a 100% interest in Agua Blanca, LLC, Waha Connector, LLC, and Gateway Pipeline, LLC, a combined network of pipelines that connects Permian supply to Whistler and other pipelines transporting natural gas from the Permian Basin to downstream markets, and the remaining 50% interest in Waha Gas Storage, LLC not held by Whistler Parent JV. We have a 15% interest in DBR.
The MXP Parent JV, a joint venture formed by Enbridge, WhiteWater Midstream, ONEOK, Inc and MPLX LP, holds (i) a 100% interest in MXP, which owns the Matterhorn Express Pipeline, an approximately 580 mile intrastate pipeline with associated compressor stations that extends from the Permian Basin to the Katy, Texas area with a capacity of 2.5 bcf/d; and (ii) a 70% equity interest in the 3.7 bcf/d Eiger Express Pipeline, which has a route parallel to the Matterhorn Express Pipeline. We have a 10% interest in the MXP Parent JV.
Transmission and storage services are generally provided under firm agreements where customers reserve capacity in pipelines and storage facilities. The vast majority of these agreements provide for fixed reservation charges that are paid monthly regardless of the actual volumes transported on the pipelines, plus a small variable component that is based on volumes transported, injected or withdrawn, which is intended to recover variable costs.
Interruptible transmission and storage services are also available where customers can use capacity if it exists at the time of the request and are generally at a higher toll than long-term contracted rates. Interruptible revenues depend on the amount of volumes transported or stored and the associated rates for this service. Storage operations also provide a variety of other value-added services including natural gas parking, loaning and balancing services to meet customers’ needs.
CANADIAN GAS TRANSMISSION
Canadian Gas Transmission is comprised of Westcoast Energy Inc.’s (Westcoast) BC Pipeline, and other minor midstream gas gathering pipelines. It also includes the Aitken Creek, located in BC, Canada, which we acquired on November 1, 2023.
The BC Pipeline provides natural gas transmission services, transporting processed natural gas from facilities located primarily in northeastern BC to markets in BC and the US Pacific Northwest. It has a peak day capacity of 3.6 bcf/d of natural gas on approximately 2,950 kilometers (1,833 miles) of transmission pipeline in BC and Alberta, as well as associated mainline compressor stations. BC Pipeline is regulated by the CER under cost-of-service regulation.
The majority of transportation services provided by Canadian Gas Transmission are under firm agreements, which provide for fixed reservation charges that are paid monthly regardless of actual volumes transported on the pipeline, plus a small variable component that is based on volumes transported to recover variable costs. Canadian Gas Transmission also provides interruptible transmission services where customers can use capacity if it is available at the time of request. Payments under these services are based on volumes transported.
On July 1, 2025, Westcoast completed a reorganization in which substantially all of the property and assets relating to the BC Pipeline were transferred to a newly formed partnership, Westcoast Energy Limited Partnership. On July 2, 2025, the First Nations Partnership, an entity representing 38 First Nations in BC, invested approximately $736 million in our Westcoast BC Pipeline. As at December 31, 2025, the First Nations Partnership owns a 12.47% redeemable noncontrolling interest in the BC Pipeline system. Subsequent to the First Nations Partnership's investment, we continue to manage and operate the pipeline system.
OTHER
Other consists primarily of our offshore and midstream assets.
Enbridge Offshore Pipelines is comprised of 12 natural gas gathering and FERC regulated transmission pipelines and five oil pipelines. These pipelines are located in four major corridors in the Gulf Coast, extending to deepwater developments, and include almost 2,200 kilometers (1,365 miles) of underwater pipe and onshore facilities with total capacity of approximately 6.6 bcf/d.
In 2023, Enbridge acquired a 10% cost investment in Divert Inc., a RNG infrastructure company, which provides Enbridge with an option to invest up to $1.3 billion (US$1.0 billion) in food waste to RNG projects across the US.
On January 2, 2024, we acquired six operating landfill gas-to-RNG production facilities from Morrow Renewables located in Texas and Arkansas. These assets are operated under Tomorrow RNG, a wholly owned subsidiary of Enbridge and further advanced Enbridge’s low-carbon strategy by accelerating RNG production capacity across key markets.
Midstream assets include a 13.2% effective economic interest in DCP Midstream, LP (DCP). DCP is a joint venture, with a diversified portfolio of assets, engaged in the business of gathering, compressing, treating, processing, transporting, storing and selling natural gas; producing, fractionating, transporting, storing and selling NGL, and recovering and selling condensate. DCP owns and operates more than 33 plants and approximately 83,176 kilometers (51,683 miles) of natural gas and NGL pipelines, with operations in seven states across major producing regions.
COMPETITION
Our natural gas transmission and storage businesses compete with similar facilities that serve our supply and market areas in the transmission and storage of natural gas. The principal elements of competition are location, rates, terms of service, flexibility and reliability of service.
The natural gas transported in our business competes with other forms of energy available to our customers and end-users, including electricity, coal, propane, fuel oils, nuclear and renewable energy. Factors that influence the demand for natural gas include price changes, the availability of natural gas and other forms of energy, levels of business activity, long-term economic conditions, conservation, legislation, governmental regulations, the ability to convert to alternative fuels, weather and other factors.
Competitors predominantly include interstate/interprovincial and intrastate/intraprovincial pipelines or their affiliates and other midstream businesses that transport, gather, treat, process and market natural gas or NGL. Because pipelines are generally the most efficient mode of transportation for natural gas over land, the most significant competitors of our natural gas pipelines are other pipeline companies.
SUPPLY AND DEMAND
Our gas transmission assets make up one of the largest natural gas transportation networks in North America, driving connectivity between prolific supply basins and major demand centers within the continent. Our systems have been integral to the transition in supply and demand markets over the last decade, and we expect to continue to play a part as the energy landscape evolves.
Natural gas production in the Appalachian and Permian Basins has grown dramatically in the past decade. Today, these regions produce more than 58 bcf/d of natural gas on a combined basis. Improved technology and increased shale gas drilling have increased the supply of low-cost natural gas. As well, there has been, and continues to be, a corresponding increase in demand for our natural gas infrastructure in North America. Through a series of expansions and reversals on our core systems, combined with the execution of greenfield projects and strategic acquisitions, we have been able to meet the needs of both producers and consumers. Our US Gas Transmission systems were initially designed to transport natural gas from the Gulf Coast to the supply-constrained northeast markets. Our asset base now has the capability to transport diverse bi-directional supply to the Northeast, Southeast, Midwest, Gulf Coast and LNG markets on a fully subscribed and highly utilized basis.
The northeast market continues its role as a predominantly supply constrained region with steady demand. The bi-directional capabilities offered by our US Gas Transmission system allow us to deliver in an efficient manner to our regional customers. The region has seen an increase in natural gas supply due to the development of the Marcellus and Utica shales in the Appalachia region.
The southeast market is linked to multiple, highly liquid supply pools that include the Marcellus and Utica shale developments, offering consistent supply and stable pricing to a growing population of end-use customers across our multiple systems under long-term, utility-like arrangements.
With connectivity to the Appalachian, the Midwest market has access to a low cost gas producing region on the continent. As demand in the region is expected to remain stable over the next decade, maintaining this link will remain important. Flexibility in supply for this market is especially critical to maintaining liquidity and price stability as natural gas continues to replace coal-fired generation.
Gulf Coast demand growth is being driven by an increase in the volume of LNG exports, an ongoing wave of gas-intensive petrochemical facilities and additional pipeline exports to Mexico. Demand in this region is anticipated to grow by approximately 20 bcf/d through 2040. The Gulf Coast market has been the beneficiary of low-cost capacity on our system as the relationship between supply and market centers has shifted. Such cost-effective capacity is difficult to access or replicate, offering existing shippers and transporters stability of capacity and utilization. Tide-water market access and proximity to Mexico continue to make this region a platform of global trade as pipeline and LNG exports continue their growth trajectory. In 2025, the US exported over 16 bcf/d of natural gas to LNG markets, primarily from the Gulf Coast region.
Western Canada is also a source of low-cost supply seeking access to premium markets in North America and globally. One of the few vital links to demand centers in the Pacific Northwest is our BC Pipeline, which is highly utilized. The continental supply profile has shifted to natural gas shale plays, such as the Montney and Duvernay within western Canada. These plays are expected to fulfill an integral role as Canada enters the global market as an LNG exporter. Western Canada's production is forecasted to increase from 19 bcf/d in 2025 to 25 bcf/d by 2040. This growth is supported by LNG exports growing from 0.5 bcf/d in 2025 to 5 bcf/d by 2040. These supply shifts have shaped our growth strategies and affect the nature of the projects anticipated in the capital expenditures discussed below in Part II. Item 7. Management's Discussion and Analysis of Financial Condition and Results of Operations - Growth Projects - Commercially Secured Projects.
Global energy demand is expected to increase approximately 20% by 2050, according to the 2025 International Energy Agency (IEA) report, driven primarily by economic growth in non-OECD countries. According to the IEA Stated Policy Scenario, natural gas will play an important role in meeting this energy demand, and gas consumption is anticipated to grow by approximately 16% during this period as one of the world’s most significant energy sources. North American exports are expected to play a significant part in meeting global demand, underscoring the ability of our assets to remain highly utilized by shippers, and highlighting the need for incremental transportation solutions across North America, as well as for the further build-out of export facilities to meet international demand.
The long-term effects on global gas markets of the ongoing conflict in Ukraine remain uncertain. In 2022, Europe saw a sharp rise in natural gas prices due to a decrease in supply from Russia. Global LNG markets responded, and LNG cargoes were redirected from the Asian market to Europe which allowed Europe to meet peak demand during what turned out to be a mild winter. Natural gas storage volumes have been strong entering the 2025–2026 winter season in Europe, and mild winter temperatures have thus far helped to moderate prices. The outlook for gas prices remains somewhat volatile but is generally anticipated to see a gradual normalization as LNG export volumes are expected to ramp up in 2026–2027.
Opposition to natural gas development, including new pipeline projects, exists in certain jurisdictions, which may challenge continued growth of the North American gas market and the ability to efficiently connect supply and demand. We are responding to the need for regional infrastructure with additional investments in Canadian and US gas transportation facilities. Progress on the development and construction of our commercially secured growth projects is discussed in Part II. Item 7. Management’s Discussion and Analysis of Financial Condition and Results of Operations - Growth Projects - Commercially Secured Projects.
RNG is seen as a more environmentally friendly alternative to traditional natural gas, as it is derived from organic waste sources such as agricultural residues, food waste, and other organic waste material. The production process most commonly involves the anaerobic digestion of these organic materials, resulting in the generation of biogas composed primarily of methane. Unlike conventional natural gas, RNG is considered carbon-neutral or even carbon-negative, as the carbon dioxide that is ultimately released during combustion is offset by the carbon captured during the organic matter's growth. This closed-loop cycle can contribute to mitigating Greenhouse Gas (GHG) emissions. RNG can be seamlessly integrated into existing natural gas infrastructure, offering a versatile energy source for heating, transportation, and electricity generation. As societies increasingly prioritize reducing emissions, RNG has the potential to play an important role in the transition towards a cleaner and more resilient energy future. Global RNG consumption is expected to increase with a 11% compound annual growth rate until 2050, according to IEA's recently released Stated Policy Scenario.
These supply and demand dynamics are evolving, as the current political climate in Canada and the US continues to shift, including as a result of changes in governments. We continue to monitor these developments together with their impact on our business.
GAS DISTRIBUTION AND STORAGE
Gas Distribution and Storage consists of our rate-regulated natural gas utility operations, which serves residential, commercial and industrial customers in Ontario, Québec, Ohio, North Carolina, Utah, Wyoming, and Idaho as well as Wexpro Company (Wexpro), which develops and produces natural gas reserves on behalf of Enbridge Gas Utah, Enbridge Gas Wyoming, and Enbridge Gas Idaho. Our distribution systems, which are supported by storage and compression assets, carry natural gas supply to customers across North America.
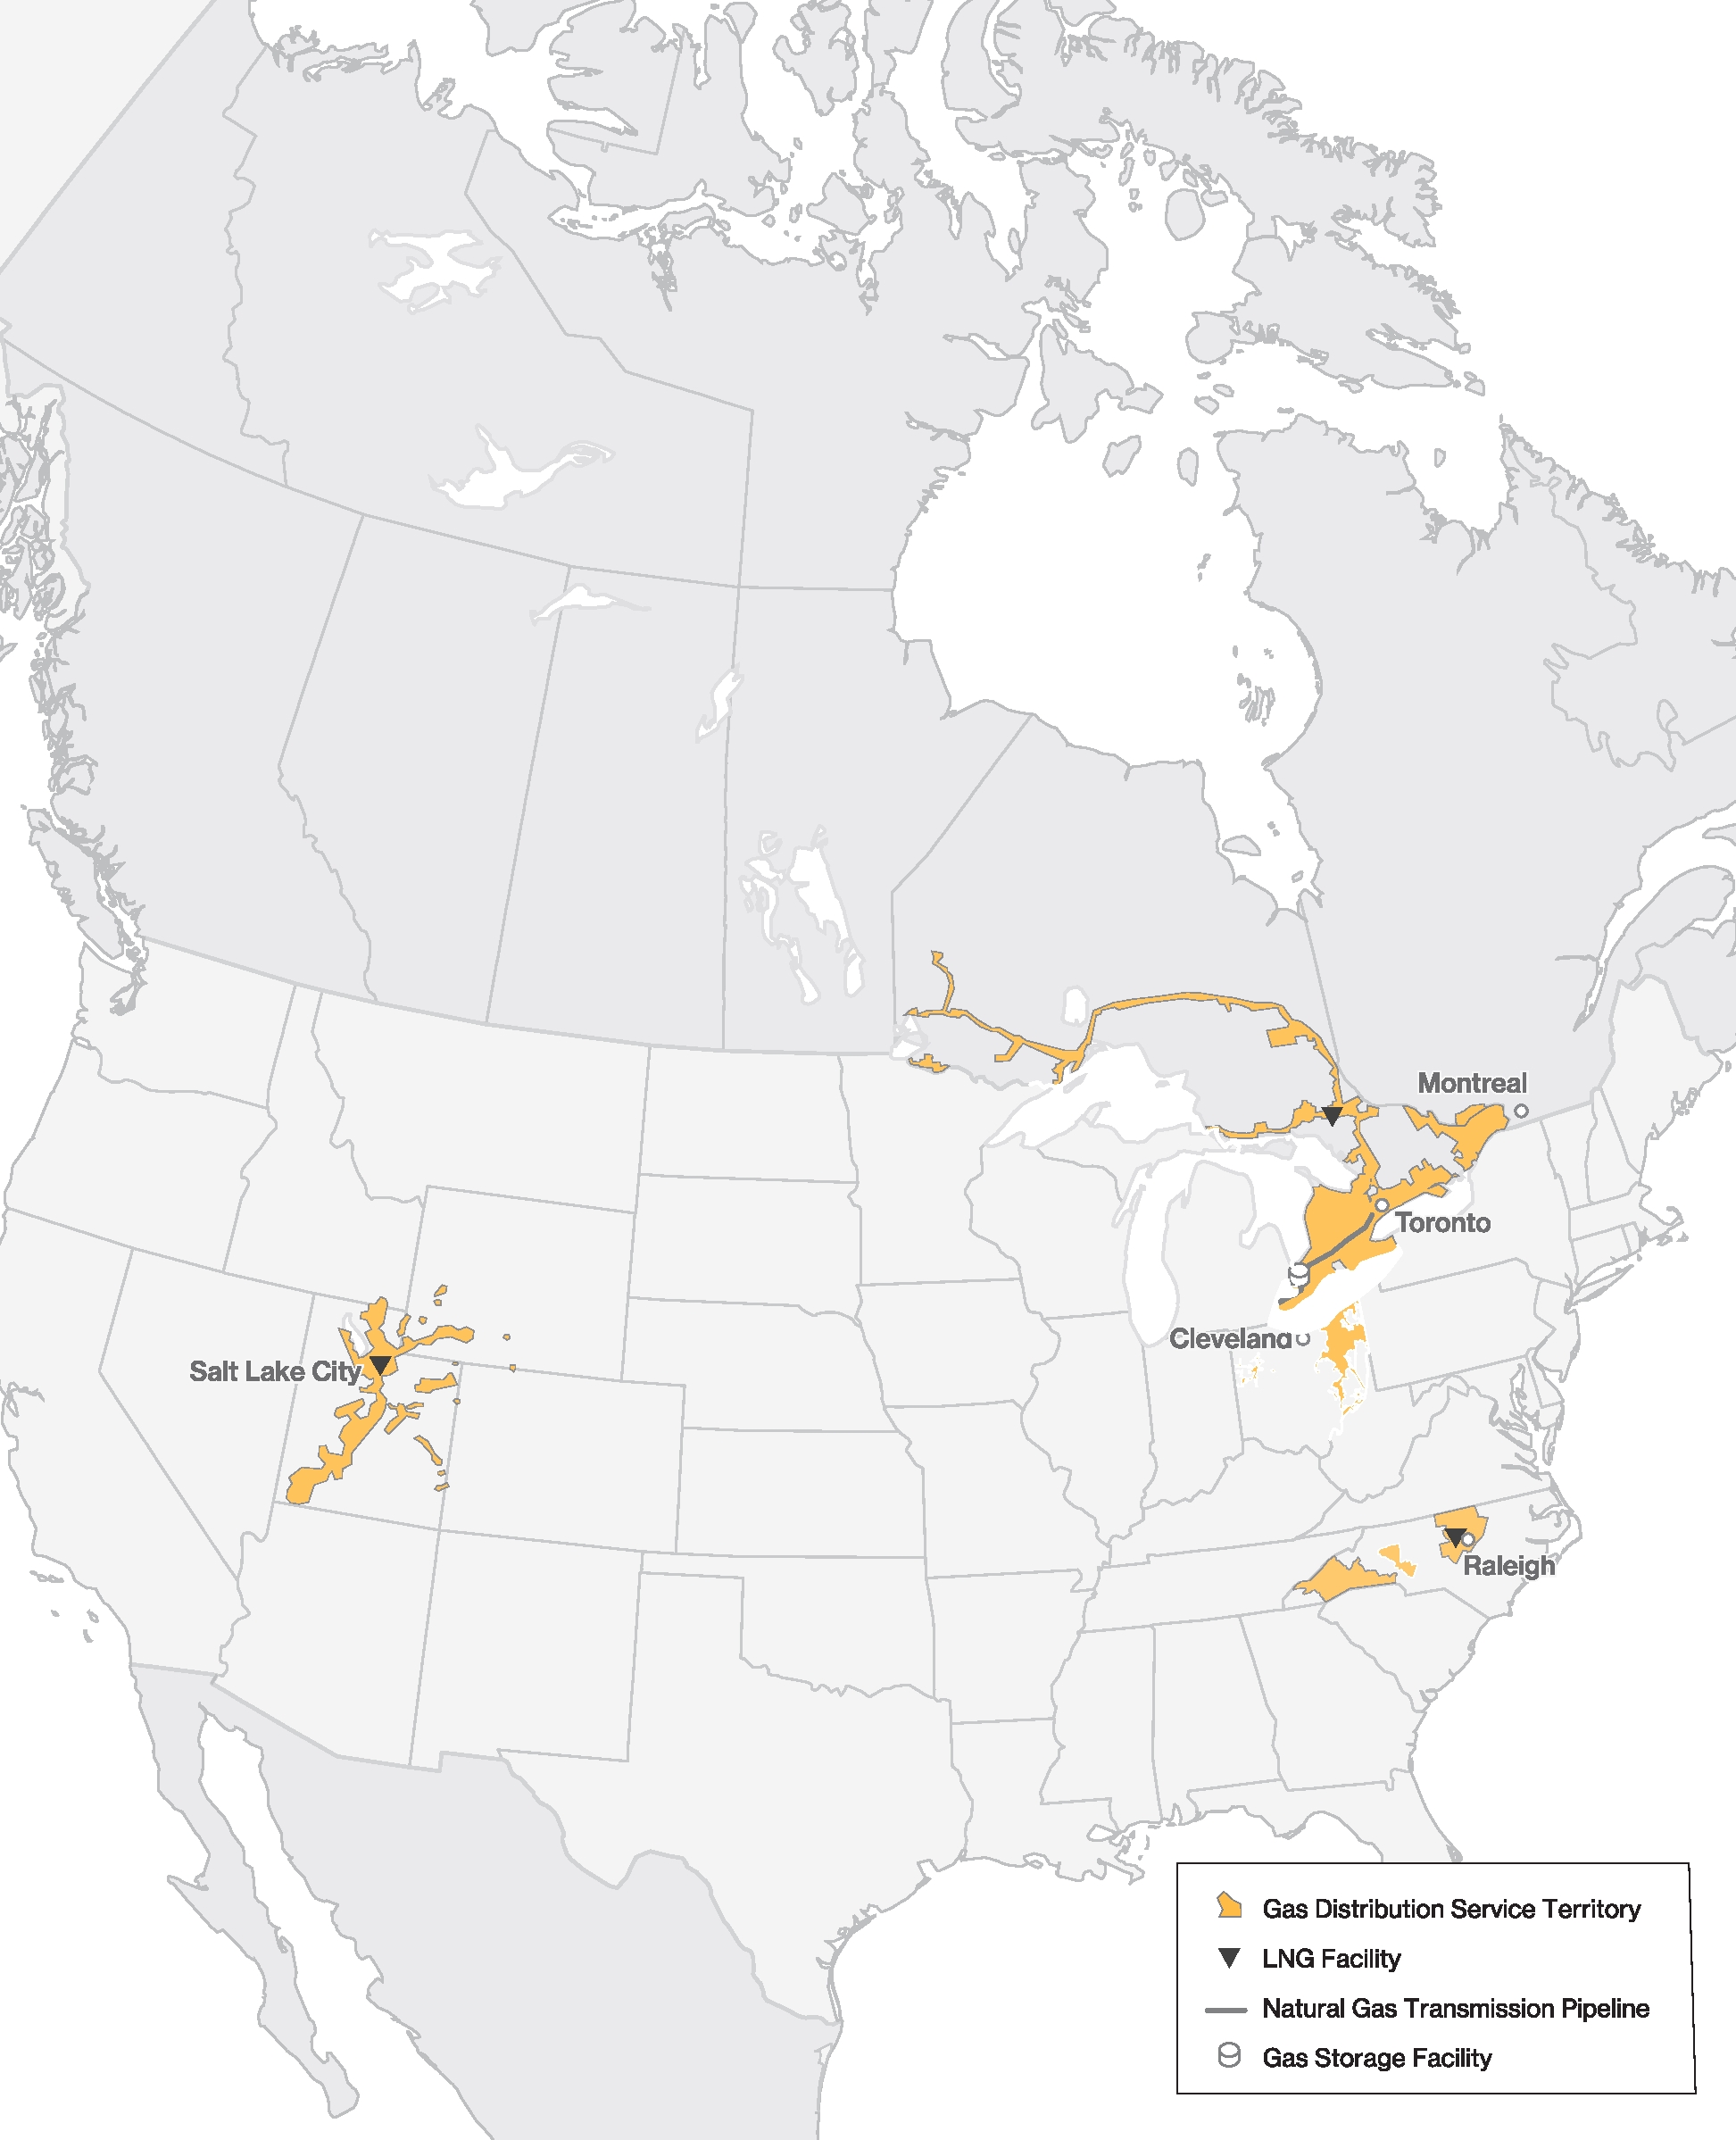
There are three principal interrelated aspects of the natural gas distribution business in which our utilities are directly involved: Distribution, Transportation, and Storage. The number of customers, and approximate combined length of pipelines for each of our major distribution and transmission systems as at December 31, 2025 are as follows:
|
|
|
As at December 31, 2025 |
Number of Customers (in millions) |
Combined Length |
Enbridge Gas Ontario |
4.0 |
157,000 km (97,804 miles) |
Enbridge Gas Ohio |
1.2 |
53,800 km (33,430 miles) |
Enbridge Gas Utah, Wyoming and Idaho |
1.2 |
55,700 km (34,610 miles) |
Enbridge Gas North Carolina |
0.7 |
39,400 km (24,482 miles) |
Our storage system principally consists of our assets at the Dawn Hub and the Tecumseh Gas Storage facility (collectively, Dawn).
Distribution
The principal source of revenue for Gas Distribution and Storage arises from the distribution of natural gas to customers. The services provided to residential, small commercial and small industrial customers are primarily on a general service basis, without a specific fixed term or fixed price contract. The services provided to larger commercial and industrial customers are usually on an annual contract basis under firm or interruptible service. Under a firm contract, we are obligated to deliver natural gas to the customer up to a maximum daily volume. The service provided under an interruptible contract is similar to that of a firm contract, except that it allows for service interruption at our discretion, primarily to meet seasonal or peak demands of firm customers. The respective regulator for each province or state approves rates for both contract and general services.
Certain customers have a choice with respect to natural gas supply depending upon the state or province. In those cases, customers may purchase and deliver their own natural gas to points upstream of the distribution system or directly into our distribution systems, or, alternatively, they may choose a system supply option, whereby customers purchase natural gas from our supply portfolio. A significant portion of our customers in Ohio participate in the Energy Choice program, under which residential customers are encouraged to purchase gas directly from retail suppliers or through a community aggregation program and have it delivered by us. Customers in our other franchise areas predominantly purchase gas from our diversified natural gas supply portfolio, which we maintain by acquiring supply from multiple supply basins and purchase points across North America. We contract for firm transportation services to deliver the natural gas supply from the purchase location to our franchise areas. Certain of our US Gas Utilities have a revenue decoupling mechanism whereby non-gas supply revenues are decoupled from the temperature-adjusted usage per customer, which allows for the collection of an allowed monthly revenue per customer and supports the promotion of energy conservation.
Transportation
Enbridge Gas Inc. (Enbridge Gas Ontario) offers firm and interruptible transportation services on its Dawn-Parkway pipeline system. Enbridge Gas Ontario’s transmission system also links an extensive network of underground storage pools at the Dawn Hub to major Canadian and US markets, and forms an important link in moving natural gas from western Canada and US supply basins to eastern Canadian and northeastern US markets.
As the supply of natural gas in areas close to Ontario has continued to grow, there has been increased demand to access these diverse supplies at Dawn and transport them along the Dawn-Parkway pipeline system to markets in Ontario, eastern Canada and the northeastern US. A substantial amount of Enbridge Gas Ontario’s transportation revenue is generated by fixed annual demand charges.
Enbridge Gas Ohio system expansion projects over the last decade have provided the opportunity to offer transportation services as an attractive outlet for shale production, by virtue of their proximity to the Utica and Marcellus shale basins while enhancing on-system operational flexibility.
Storage
Our gas distribution business is highly seasonal as daily market demand for natural gas fluctuates with changes in weather, with peak consumption occurring in the winter months. Utilization of storage facilities allows us to take delivery of natural gas on favorable terms during off-peak summer periods for subsequent use during the winter heating season. This practice helps to minimize the annual cost of transportation of natural gas from its supply basins, assists in reducing our overall cost of natural gas supply, and adds a measure of security in the event of any short-term interruption of transportation of natural gas to our franchise areas.
The storage facility at Dawn is located in southwestern Ontario and has a total working capacity of approximately 290 bcf in 35 underground facilities located in depleted gas fields. Dawn is the largest integrated underground storage facility in Canada and one of the largest in North America. A substantial amount of Enbridge Gas Ontario’s storage revenue is generated by fixed annual demand charges. There is approximately 60 bcf of underground storage in Ohio that provides additional flexibility for system reliability and managing the cost of supply for customers.
COMPETITION
Our gas distribution systems are regulated by the Ontario Energy Board (OEB), the Québec Régie de l’énergie, the Public Utilities Commission of Ohio (Ohio Commission), the North Carolina Utilities Commission (North Carolina Commission), the Utah Public Service Commission (Utah Commission), the Wyoming Public Service Commission (Wyoming Commission), and the Idaho Public Utilities Commission (Idaho Commission). Our gas distribution systems are not generally subject to third-party distribution competition within their franchise areas.
Our gas distribution business competes with other forms of energy available to customers and end-users, including electricity, coal, propane and fuel oils. Factors that influence the demand for natural gas include weather, price changes, the availability of natural gas and other forms of energy, the level of business activity, conservation, legislation, governmental regulations, the ability to convert to alternative fuels, and other factors.
SUPPLY AND DEMAND
We anticipate that demand for natural gas in North America will stabilize over the long term with potential growth in peak day demands and from the data center build-out; however, there are risks to the natural gas market that may challenge its growth prospects.
Net-zero carbon policies, evolving customer preferences for lower-carbon fuels and more efficient technologies, combined with continued opposition to natural gas development in certain parts of North America, may reduce the markets’ ability to efficiently deploy capital to connect supply and demand. We monitor these factors closely in order to align our business strategy with shifts in customer preferences and public policy requirements.
Enbridge continues to focus on promoting conservation as a strategy to improve affordability and energy efficiency by undertaking activities focused on reducing natural gas consumption through various demand side management programs offered across all markets.
Supply and demand are also impacted by the legislative environments in which our utilities operate. For example, effective April 1, 2025 the federal carbon levy unit rate in Ontario was set to zero. Additionally in June 2025, the Government of Ontario’s first Integrated Energy Plan, which emphasizes energy affordability and customer choice, identified natural gas as a critical and vital component of Ontario’s energy mix. In 2023, House Bill 507 was signed in Ohio officially defining natural gas as a "green energy". In 2021, Ohio and Utah both passed bills (House Bill 201 and House Bill 17, respectively) prohibiting bans on natural gas. The laws prohibit municipalities and counties from enacting "an ordinance, a resolution, or a policy that prohibits, or has the effect of prohibiting, the connection or reconnection of an energy utility service." However, they do not block local or county officials from supporting electrification through incentives or restricting gas use in municipal or county buildings. In 2021, House Bill 951 was signed in North Carolina, directing the North Carolina Commission to develop a plan, known as the NC Carbon Plan, for a 70% reduction in carbon emissions in the electricity sector by 2030 that is driving coal-to-gas generation switching.
Over the past decade, growth in the North American gas supply landscape, driven mainly by the development of unconventional gas resources in the Montney, Permian, Marcellus and Utica supply basins, has resulted in lower annual commodity prices and narrower seasonal price spreads. Natural gas prices have been impacted by lower weather-related demand and higher North American inventory levels resulting in more stable and lower prices.
Enbridge Gas Utah, Enbridge Gas Wyoming, and Enbridge Gas Idaho have a cost-of-service agreement with Wexpro, which develops and produces natural gas reserves on behalf of the utility. Wexpro's production supplies up to 55% of annual demand for the utility (up to 65% if certain conditions are met and approvals obtained) and provides a physical hedge against commodity price volatility while maintaining the option to purchase from third-party suppliers at market rates through long-term contracts. Wexpro's operations stretch from the northern tip of the Greater Green River Basin in Pinedale, Wyoming, through the Vermillion Basin of Wyoming and Colorado, down to the Uinta Basin of Utah. Wexpro establishes its annual drilling program by forecasting the utility's consumption needs.
Magna LNG is a 1.3 bcf LNG facility located in Magna, Utah. The facility provides system reliability for Enbridge Gas Utah's customers in Salt Lake City and the surrounding counties. LNG is produced primarily during the warmer months of the year and then stored to be used when needed for reliability.
RENEWABLE POWER GENERATION
Renewable Power Generation consists primarily of investments in wind and solar power generation facilities, as well as an equity interest in geothermal power facilities. In Canada, our assets are located in Québec, Ontario and Alberta. In the US, our renewable assets are primarily in Texas, Ohio, Indiana, Colorado, and West Virginia. In Europe, we hold equity interests in operating offshore wind facilities in the coastal waters of the United Kingdom (UK), France, and Germany, as well as interests in offshore wind projects under construction or in active development in France and the UK.
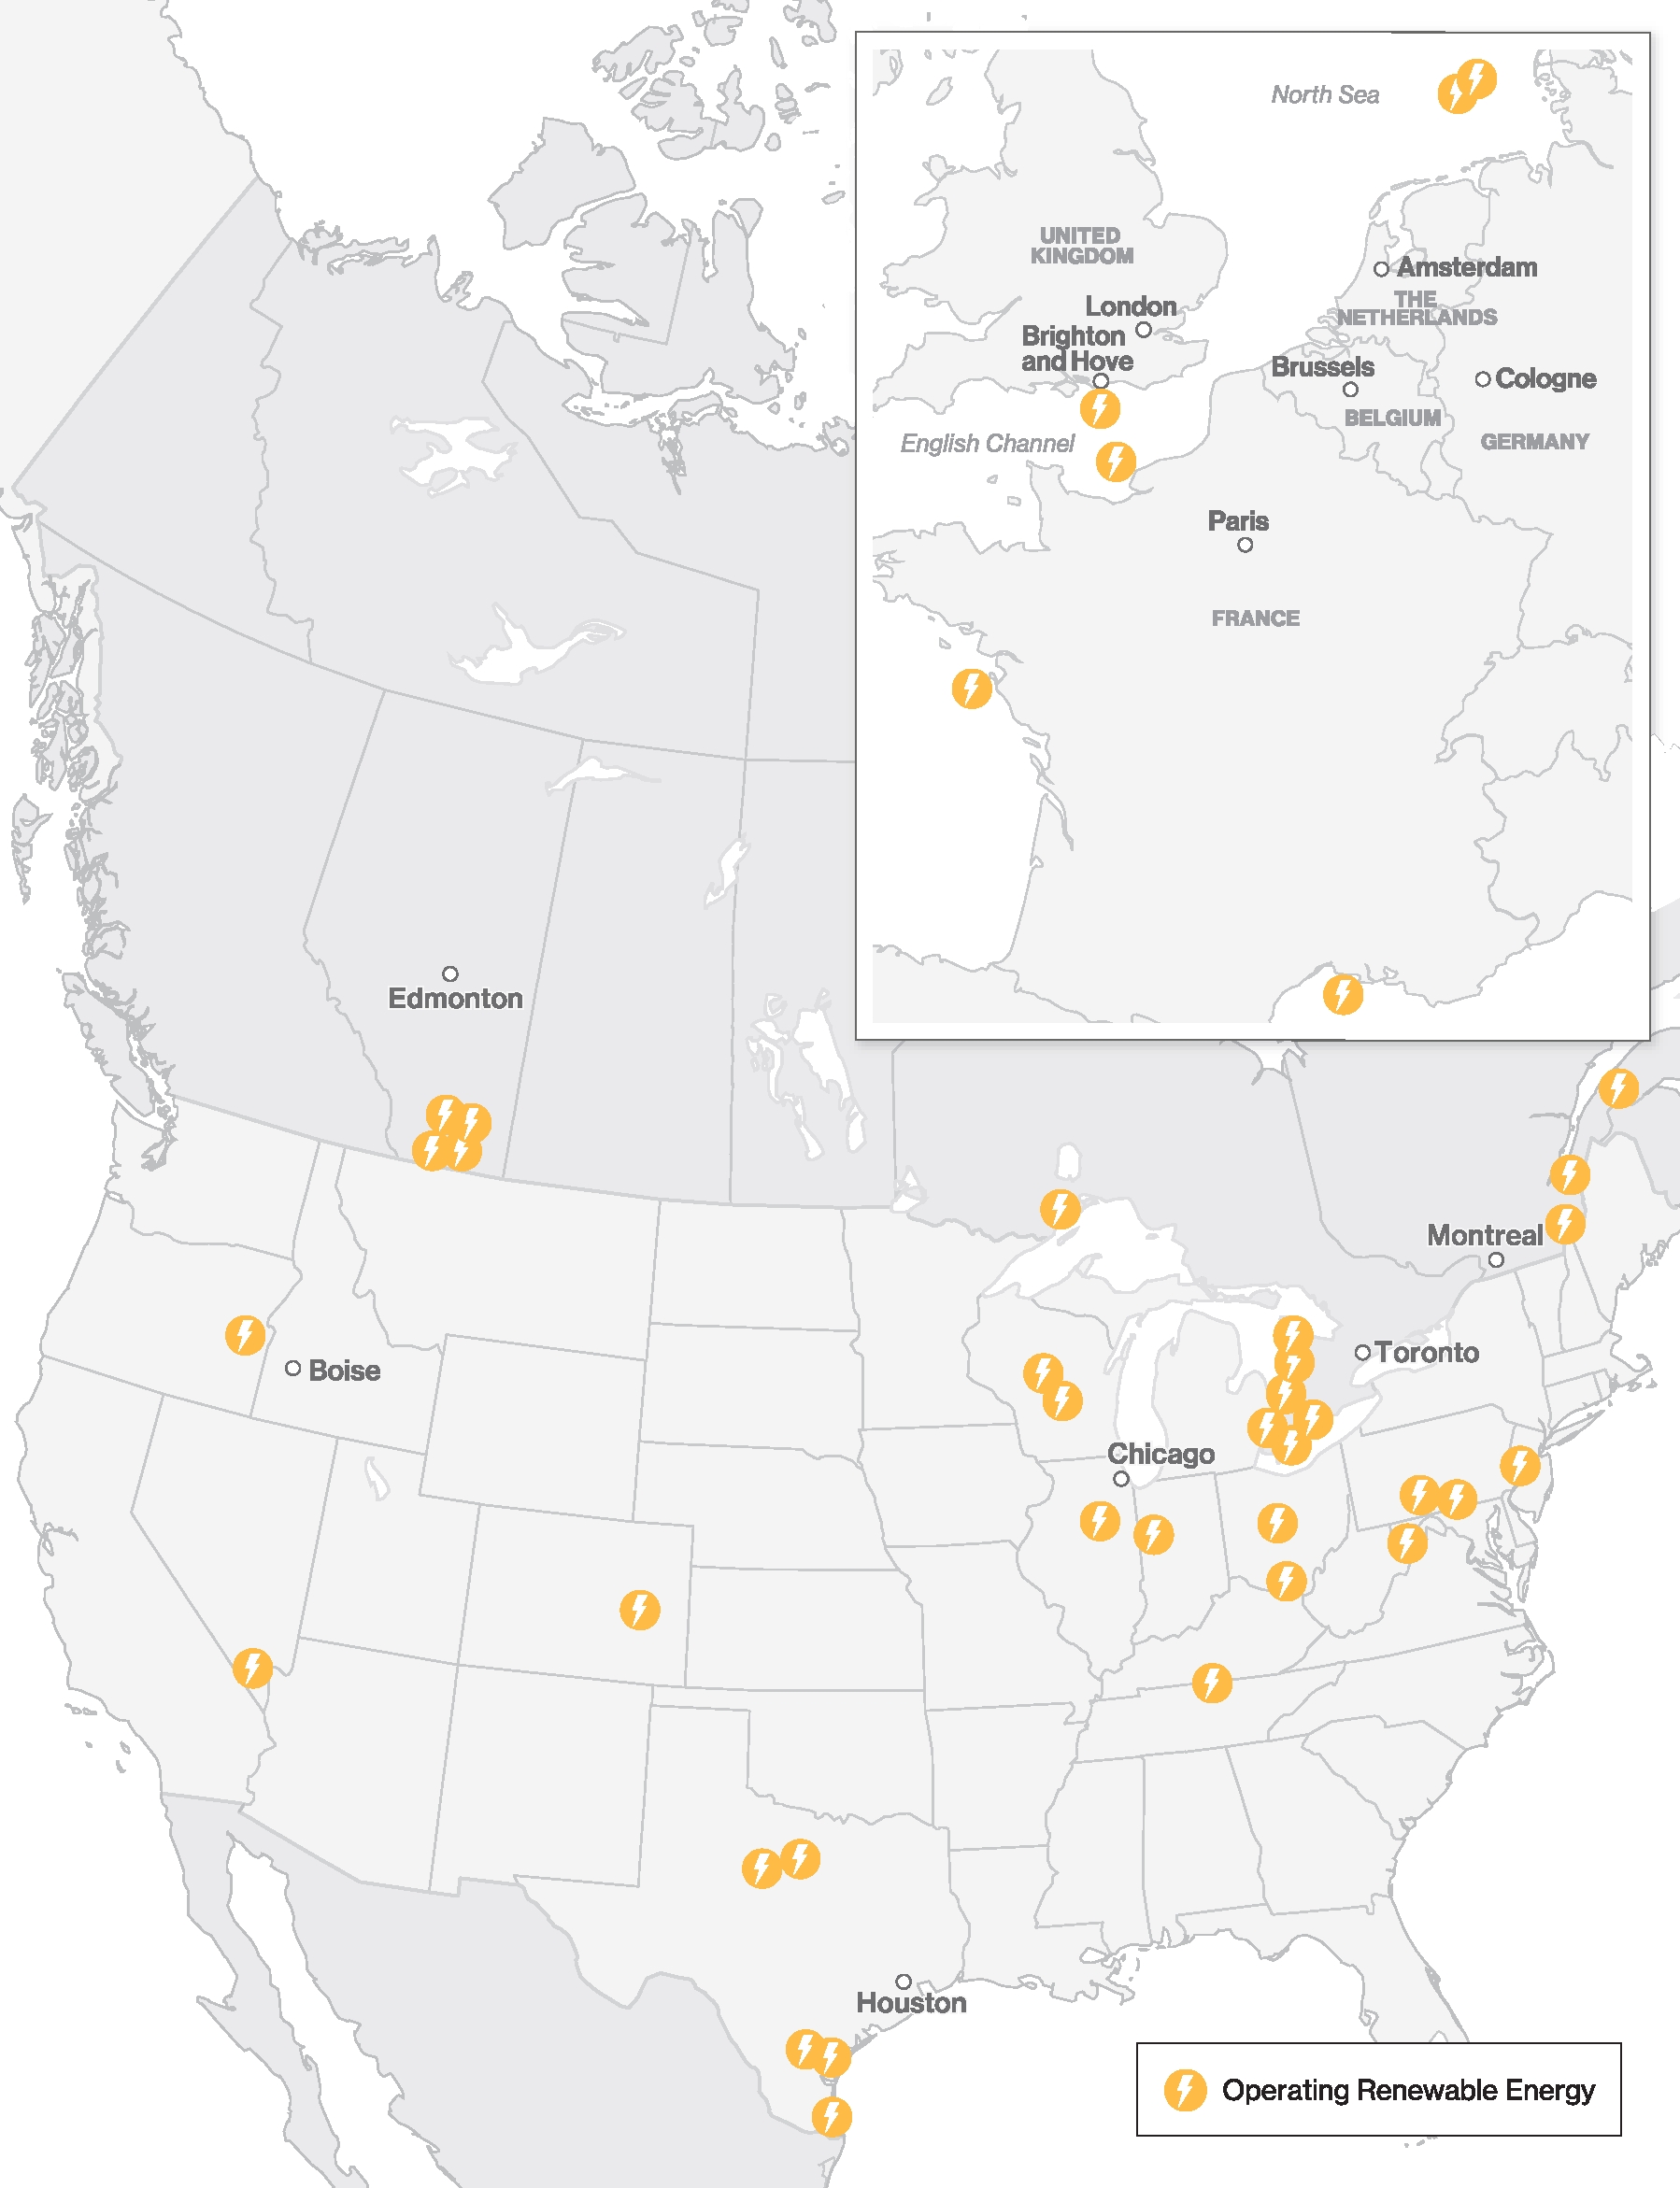
Combined Renewable Power Generation investments represent approximately 4,100 MW of net generation capacity, which primarily consists of:
•1,399 MW generated by North American wind facilities;
•967 MW generated by operating North American solar facilities, with an additional 1,015 MW in projects under construction;
•621 MW generated by European offshore wind facilities; and
•97 MW expected to be generated by the Courseulles (Calvados) Offshore Wind Project in France, which is currently under construction.
The vast majority of the power produced from these facilities is sold under long-term PPAs.
Most of our investments in Canadian, US and European offshore wind and solar assets are held within joint ventures.
COMPETITION
Renewable Power Generation operates in the North American and European power markets, which are subject to competition and supply and demand fundamentals for power in the jurisdictions in which it operates. The majority of our revenue is generated from long-term PPAs. As such, financial performance is not significantly impacted by fluctuating power prices arising from supply/demand imbalances or the actions of competing facilities during the term of the applicable contracts. However, the renewable energy sector includes large utilities, small independent power producers and private equity investors, which are expected to aggressively compete for new project development opportunities and for the right to supply customers when contracts expire.
To grow in a competitive environment, we strategically target regions with commercial constructs consistent with our low-risk business model. In addition, we leverage our expertise in developing and constructing large-scale infrastructure projects.
SUPPLY AND DEMAND
Strong load growth across North America is anticipated, driven by growing data center power demand and other large industrial load, as well as the continued electrification within the residential, transportation and industrial sectors. Additionally, corporate electricity end-users seeking to reduce their emissions continue to drive demand for renewable electricity and environmental attributes.
In response to the growing demand outlook, North America requires significant new generation capacity from preferred technologies. Gas-fired and renewable energy facilities, including solar and wind (which make up the bulk of our renewable power assets), are generally the preferred sources to meet the increased load.
Falling capital and operating costs of wind and solar, combined with their improving capacity factors, are expected to reinforce the long-term competitiveness of renewable energy and sustain investment, even in the absence of government incentives. Aside from the construction of new wind and solar facilities, other growth opportunities include repowering projects to increase output from and extend the project-life of our existing facilities.
In Europe, the renewable energy outlook is robust. Demand for electricity is expected to gradually increase, driven by electrification of transportation and buildings, and the desire to reduce reliance on gas sourced from Russia. Energy efficiency gains are expected to temper, but not eliminate, demand growth. Renewable power is expected to play a significant role in Europe’s ability to meet its aggressive lower-carbon and renewable energy targets.
Through our European joint ventures, we continue to explore opportunities in European offshore wind to meet the growing demand.
ELIMINATIONS AND OTHER
Eliminations and Other includes operating and administrative costs that are not allocated to business segments, the impact of foreign exchange hedge settlements and the activities of our wholly-owned captive insurance subsidiary. The principal activity of our captive insurance subsidiary is providing insurance and reinsurance coverage for certain insurable property and casualty risk exposures of our operating subsidiaries and certain equity investments. Eliminations and Other also includes new business development activities and corporate investments, natural gas and power marketing and logistical services to North American refiners, producers, and other customers, and elimination of transactions between segments required to present our financial performance and financial position on a consolidated basis.
REGULATION
Our assets and activities are subject to extensive governmental and environmental regulation by various federal, provincial, state and local authorities. These include operational regulations related to safety and environmental protection and economic regulations governing the rates we charge customers for our services. These requirements impact our operations, capital expenditures, earnings, cash flows, financial and competitive positions. Non-compliance may result in fines, penalties, remediation, operating restrictions, increased regulatory and stakeholder scrutiny, increased operating and compliance costs and potential reputational damage. We continually monitor rulemakings and rate proceedings and incorporate compliance investments into our capital plans. We maintain regulatory compliance programs and management systems to mitigate these potential risks.
GOVERNMENT REGULATION
Operational Regulations
US
In the US, our liquids and natural gas pipeline operations are subject to pipeline safety laws and regulations administered by the Pipeline and Hazardous Materials Safety Administration (PHMSA), an agency within the US Department of Transportation (DOT) as well as by certain state regulatory authorities. These laws and regulations require us to comply with a significant set of requirements for the design, construction, maintenance and operation of our interstate and intrastate pipelines, including, among other things, requirements to monitor and maintain the integrity of our pipelines and to operate them within permissible design limits, such as pressures. Pipeline failure or failures to comply with applicable regulations could result in a variety of enforcement measures, for example, reduction of allowable operating pressures, which would reduce available capacity on our pipelines. PHMSA continues to review existing regulations and establishes new regulations to support safety standards that are designed to improve operations integrity management processes and reduce methane emissions.
Canada
In Canada, our liquids and natural gas pipeline operations are subject to safety regulations administered by the CER or provincial regulators. Applicable legislation and regulations require us to comply with a significant set of requirements for the design, construction, maintenance and operation of our pipelines. Among other obligations, this regulatory framework imposes requirements to monitor and maintain the integrity of our pipelines. The CER has authority to impose a variety of enforcement measures, including administrative monetary penalties for non-compliance, and may impose financial requirements for future abandonment costs and major pipeline releases. In the event of a significant release or other noncompliance, the CER could impose pressure restrictions, which could result in adverse operational and financial impacts. As in the US, laws and regulations aimed at enhancing pipeline safety in Canada have continued to evolve and are being monitored on an ongoing basis.
Economic Regulations
Pipelines and Facilities
Our pipeline and facility operations are subject to economic regulation by various regulators in both Canada and the US, including the CER and the FERC. These regulators oversee transportation and storage rates, tolls, and tariffs for our assets. Our ability to establish transportation and storage rates on our US interstate natural gas facilities and transportation rates on our US interstate oil pipelines is subject to regulation by the FERC, whose rulings and policies impact our ability to recover the full cost of operating these pipeline and storage assets, including a reasonable rate of return. Tolls of our inter-provincial pipelines in Canada are subject to the regulation by the CER. Regulatory or administrative actions by the CER, FERC and other regulators, including rate proceedings, review of proposed commercial arrangements (for example, toll settlements with shippers), decisions on applications (for example, new expansion projects), and regulatory policies (for example, depreciation and amortization policies), can affect our business. The rejection or revision of applications for approval of new tariff, tolling or rate structures or proposed commercial arrangements, or changes in interpretation of existing regulations by courts or regulators, could have an adverse effect on our revenues and earnings.
Tax policy changes could also affect both existing assets and future development opportunities. For instance, recent updates to US tax legislation implemented in the One Big Beautiful Bill Act provides for immediate expensing of capital expenditures as well as changes to allow for additional interest expense to be deducted. In addition, Canada and the US have extended tax incentives for Carbon Capture, Utilization, and Storage investments. Tax policy changes, along with introduction of tariffs, could change capital costs and impact development plans.
Natural Gas Utilities
Our natural gas utility operations in Canada and the US are regulated by provincial and state utility regulators.
Gas Regulation in Canada
Enbridge Gas Ontario's operations are regulated by the OEB and Enbridge Gaz Québec's operations are regulated by the Québec Régie de l’énergie.
Enbridge Gas Ontario is operating under a multi-year rate framework established by the OEB that began with cost-of-service base rates for 2024 and is followed by a price cap incentive rate-setting mechanism for 2025–2028.
Enbridge Gaz Québec is operating under a multi-year rate framework established by the Régie de l’énergie that began with cost-of-service base rates for 2025 and streamlined rate-setting method that includes a parametric formula for indexing operating costs applicable for years 2026 and 2027. Enbridge Gaz Québec also has a full revenue decoupling mechanism in place since 2024 and will remain in effect through 2027 (inclusive).
Gas Regulation in Ohio
Enbridge Gas Ohio is subject to regulation of rates and other aspects of its business by the Ohio Commission. When necessary, Enbridge Gas Ohio seeks general base rate increases to recover increased operating costs and a fair return on rate base investments. Base rates are set based on the cost-of-service by rate class. A straight-fixed-variable rate design, in which the majority of operating costs are recovered through a monthly charge rather than a volumetric charge, is utilized to establish rates for a majority of Enbridge Gas Ohio’s customers.
The Ohio Commission has also approved several stand-alone cost recovery mechanisms to recover specified costs and a return for infrastructure, information technology and integrity or compliance-related projects between general base rate cases.
Gas Regulation in North Carolina
Enbridge Gas North Carolina is subject to regulation of rates and other aspects of its business by the North Carolina Commission. When necessary, Enbridge Gas North Carolina seeks general base rate increases to recover increased operating costs and a fair return on rate base investments. Base rates are set based on the cost-of-service by rate class. Base rates for Enbridge Gas North Carolina are designed primarily based on rate design methodology in which the majority of operating costs are recovered through volumetric charges. The volumetric charges for the residential and commercial customers are subject to revenue decoupling and adjusted for changes in usage per customer.
Gas Regulation in Utah, Wyoming, and Idaho
Enbridge Gas Utah, Enbridge Gas Wyoming, and Enbridge Gas Idaho are subject to regulation of rates and other aspects of its business by the Utah Commission, the Wyoming Commission, and the Idaho Commission, respectively. The Idaho Commission has contracted with the Utah Commission for rate oversight of Enbridge Gas Idaho’s operations in a small area of southeastern Idaho.
Base rates are set based on the cost-of-service by rate class. Base rates are designed primarily based on rate design methodology in which the majority of operating costs are recovered through volumetric charges. The volumetric charges for the residential and small commercial customers in Utah and Wyoming are subject to revenue decoupling and adjusted for changes in usage per customer.
Crude Oil Marketing
The crude oil marketing business is regulated by government authorities in the areas of commodity trading, import and export compliance and the transportation of commodities. In the US, commodity marketing is regulated by the Commodity Futures Trading Commission, the FERC, the SEC, the Federal Trade Commission, various commodity exchanges, the US Department of Justice, and state regulators. In Canada, provincial and other territorial securities regulators similarly regulate commodity marketing within Canada. These various regulators enforce, among other things, the prohibition of market manipulation, fraud and disruptive trading. The transportation of crude oil and NGL by railcar or truck is regulated by the US DOT, Transport Canada and provincial or state regulatory agencies, which require compliance with security, safety, emergency management, and environmental laws and regulations related to ground transportation of commodities. Non-compliance with governing rules and regulations could result in fines, penalties, remediation and operating restrictions.
Renewable Power Generation
Renewable Power Generation is subject to numerous operational rules and regulations mandated by governments and applicable regulatory authorities. The North American Electric Reliability Corporation (NERC) is an international regulatory authority responsible for establishing and enforcing reliability standards to reduce risks to the reliability and security of the grid in Canada, the US, and Mexico. It is subject to oversight from the FERC in the US and provincial governments in Canada. The FERC has authority over many markets in the US and is tasked with ensuring safe, reliable, and secure interstate transmission of electricity, natural gas, and oil. This includes establishing reliability standards, market rates, and determining certain pricing aspects of transmission development and access, among others. NERC and FERC standards and pricing decisions are also updated from time to time.
Policy changes in both Canada and the US could affect both existing assets and future development opportunities for Renewable Power Generation. For instance, in Canada, the Clean Electricity Regulations, which came into force in 2025, require Canada’s electricity grid to reach net-zero by 2050 with initial limitations beginning in 2035. Canada has also implemented legislation introducing a tax credit for low-emission generation, storage and transmission projects. In the US, legislation such as the One Big Beautiful Bill Act, phases out clean energy tax credits and creates limits on foreign content. Conversely, the current US administration’s directive to implement an AI action plan could lead to higher electricity demand, supporting new opportunities.
Renewable Power Generation is also subject to provincial and state regulations governing the energy resource mix on the grid, emissions levels of the electricity grid, and market regulations related to emergency operations, extreme weather preparedness, and market participation, among others. These regulations may change from time to time, which could impact our operations and increase the costs of participating in regional electricity markets. Other state and provincial governments are also prioritizing reliability and more dispatchable generation characteristics in their markets.
Our Renewable Power Generation assets in France and Germany operate under federal policies and are also subject to directives and regulations established and enforced by the European Union (EU). The EU is also responsible for establishing environmental protection rules and permitting standards. The federal policies and regulations in place are subject to change from time to time, which could impact our operations and related expenditures; however, the EU’s general direction is to facilitate increased renewable power integration to its grid.
The UK government is responsible for establishing renewable energy and carbon pricing policies for the entire UK, as well as long-term electricity sector planning and procurement. Each country within the UK (e.g., England, Scotland) is also responsible for establishing its own environmental and permitting regulations. The offshore wind sector is further supported by the UK’s commitment to reaching net zero by 2050.
ENVIRONMENTAL REGULATION
Our operations across all business segments are subject to extensive environmental laws, regulations, and policies at the federal, provincial or state, and municipal levels. These requirements apply across environmental domains, including air and water quality, waste and land management, habitat protection, wildlife and protected species, noise, emergency response, and the remediation of historical contaminated sites, among others. Because these laws vary by jurisdiction, continue to evolve, and may at times conflict, they introduce regulatory uncertainty and compliance complexity. Meeting these obligations can require significant capital investment and increase operating costs, and non‑compliance or environmental incidents can result in substantial remediation obligations, enforcement actions, financial penalties, operational interruptions, or mandatory deployment of advanced pollution‑control technologies. Regulatory breaches may also lead to third‑party liability claims and reputational impacts, contributing to long‑term risk exposure. Refer to Item 1A. Risk Factors - Risks Related to Government Regulation and Legal Risks for further discussion.
Across Canada and the US, our operations are governed by multi-layered environmental regulatory regimes that differ in scope, structure, and enforcement. In Canada, oversight is shared between federal legislation and provincial frameworks that regulate emissions, carbon pricing, land use, and permitting, creating distinct compliance pathways across provinces.
In the United States, federal air regulations under the Clean Air Act, administered by the US Environmental Protection Agency (EPA), drive significant operational and financial implications, with standards for criteria pollutants, hazardous air pollutants, and methane requiring ongoing investment in detection, monitoring, and advanced control technologies. While recent federal actions have introduced uncertainty, including potential revisions or pauses to certain reporting and compliance requirements, the long‑term trend points toward increasingly stringent emissions controls and the possibility of methane fees. Enbridge anticipates that continued EPA rulemaking, together with state‑level programs that may exceed federal baselines or address gaps left by federal adjustments, is expected to require sustained adaptability, proactive compliance planning, and careful cost management.
Air Quality
On March 7, 2025, Canada published the Reduction in the Release of Volatile Organic Compounds (VOC) (Storage and Loading of Volatile Petroleum Liquids) Regulations (VOC Regulations), which impact our Liquids Pipelines assets, specifically petroleum liquid storage tanks and loading operations. The VOC Regulations require emission control equipment, record keeping, inspections and maintenance of in-scope storage tanks and loading racks. Liquids Pipelines has implemented a structured program to meet all requirements. These regulatory changes will require additional capital and operating expenditures, and we continue to monitor developments and coordinate across functions to enable timely compliance.
Proposed amendments to the Canadian federal methane regulations are part of the government’s effort to achieve at least a 75% reduction in methane emissions from the oil and gas sector by 2030, relative to 2012 levels. These proposed amendments aim to further reduce methane emissions by limiting venting, imposing gas destruction, and increasing fugitive emissions management, affecting our Gas Transmission and Gas Distribution and Storage assets. An alternative performance-based compliance pathway using an emissions monitoring system is also proposed. The regulations are expected to be finalized by spring of 2026.
The Government of Canada adopted a pan-Canadian carbon pricing framework in 2016 through the Greenhouse Gas Pollution Pricing Act (GGPPA), establishing an output-based pricing system (OBPS) for industrial facilities. Part 1 of the GGPPA, which applied a consumer fuel charge, was repealed on April 1, 2025, and as a result Enbridge Gas Ontario removed the Federal Carbon Charge from customer bills. The OBPS under Part 2 continues to apply to large emitters, imposing compliance obligations for emissions above facility specific limits and enabling credits for emissions below those limits. In April 2025, the federal carbon price applicable to industrial emitters increased from $80 to $95 per tonne of carbon dioxide equivalent (CO2e), and under the GGPPA schedule the price will continue to rise by $15 per tonne annually to reach $170 per tonne of CO2e in 2030.
In March 2022, the Government of Canada published its 2030 Emissions Reduction Plan, which builds upon the pan-Canadian framework and the Net-Zero Emissions Accountability Act. This legislation establishes a roadmap to achieve a 40–45% reduction in GHG emissions by 2030 and net-zero emissions by 2050, supported by complementary policies and programs. Enbridge Gas Ontario, which distributes approximately 2.3 bcf/d of natural gas across Ontario and Québec, is directly affected by the requirements. These frameworks materially influence the Company’s operational planning, investment strategy, and compliance obligations. Enbridge Gas Ontario is actively assessing the role of its existing infrastructure in light of applicable government emission reduction policies.
In the US, several key EPA regulatory initiatives continue to affect our US operations as follows:
•The Good Neighbor Rule, which sets new nitrogen oxide emission limits for certain industrial sources, remains temporarily stayed nationwide pending litigation, creating uncertainty around timelines and compliance obligations.
•The New Source Performance Standards (NSPS) under 40 Code of Federal Regulations Part 60 Subparts OOOOb and OOOOc, imposes new VOC, sulfur dioxide, and methane requirements on new and existing crude oil and natural gas facilities, with certain compliance deadlines postponed to 2027 under a 2025 interim final rule.
•On January 15, 2026, the EPA finalized amendments to the NSPS applicable to stationary combustion turbines, introducing revised requirements to limit nitrogen oxides emissions and, in defined situations, requiring the installation of emissions control or monitoring equipment. The final rule also replaces the prior Subpart KKKK requirements for new sources. We continue to assess the potential capital, operating, and compliance cost impacts of this rule for current and planned turbine assets.
•In 2024, the EPA proposed updates to the National Ambient Air Quality Standards lowering the annual Fine Particulate Matter from 12.0 to 9.0 micrograms per cubic meter of air. For our Gas Transmission and Gas Distribution and Storage business units, this change would significantly increase regulatory and permitting obligations in regions that fail to meet the new threshold. However, the rule remains under reconsideration, and the EPA has not yet issued state recommendations for nonattainment designations.
Pursuant to US federal regulations, facilities emitting 25,000 metric tons CO2e per year or more must report GHG emissions through the Mandatory GHG Reporting Program. The EPA revised the program in 2024, to include additional sources and new measurement and calculation methodologies for the oil and gas sector, effective for the 2025 reporting year. These changes were designed to comply with the requirement under the Inflation Reduction Act to utilize more empirical data. We are preparing to report 2025 emissions in 2026; however, a proposal was issued in September 2025 to stop some of the reporting requirements and pause other portions of reporting until 2034.
Waste Management
Our US Gas Utilities are subject to various federal and state laws and regulations governing the management, storage, treatment, reuse, and disposal of waste materials and hazardous substances. Wexpro's operations and construction activities related to oil and gas production and gas storage wells generate waste. Completion water is disposed of at commercial disposal facilities, while produced water is either hauled for disposal, evaporated, or injected into Wexpro and third party-owned underground injection wells. Wells drilled in tight-gas-sand and shale reservoirs require hydraulic-fracture stimulation to achieve economic production rates and recoverable reserves. The majority of Wexpro's current and future production and reserve potential comes from reservoirs that need hydraulic-fracture stimulation to be commercially viable. Currently, all well construction activities, including hydraulic-fracture stimulation and the management and disposal of hydraulic fracturing fluids, are regulated by federal and state agencies that review and approve all aspects of gas and oil well design and operation.
Protected Species
The Canadian federal Species at Risk Act protects listed wildlife species and prohibits the destruction of or damage to critical habitat or residences. Similarly, in the US, the Endangered Species Act protects imperiled wildlife species. As additional species are proposed or newly listed to those acts, interactions with certain assets, particularly wind power generation, may increase, potentially affecting permitting, operation and associated expenditures of our Renewable Power Generation assets.
Other Regulations
New York’s State Climate Leadership and Community Protection Act
Enacted in 2019, the Climate Leadership and Community Protection Act (Climate Act) is one of the most ambitious climate laws in the US. It mandates economy-wide GHG reductions of 40% by 2030, at least 85% by 2050 from 1990 levels, and requires 100% zero-emission electricity by 2040. The Climate Act established a Climate Action Council to develop a plan to achieve these targets and directed the Department of Environmental Conservation to adopt enforceable regulations. It also provides for an economy-wide cap-and-invest program and a mandatory GHG reporting system. In March 2025, New York released its Mandatory GHG Reporting Program, requiring owners and operators to report direct and indirect GHG emissions beginning with 2026 data, with reporting commencing in 2027 and subject to third-party verification. We are preparing to comply with these additional tracking and reporting requirements while evaluating emissions-reduction strategies. Implementation timing for the cap-and-invest program remain uncertain; it is currently proposed for 2027–2028 but faces ongoing litigation. In addition to the fees associated with the cap-and-invest program, there are fines for minor errors associated with emissions reporting.
BC’s Greenhouse Gas Industrial Reporting and Control Act
In 2024, BC transitioned from an explicit carbon pricing system for large emitters, to the BC OBPS. The BC OBPS is an industrial carbon pricing system and is mandatory for facilities emitting over 10,000 tonnes of CO2e per year. Pipelines are treated as a Linear Facility Operation, resulting in the aggregation of all emission sources. Carbon prices are aligned with the federal benchmark and support provincial targets to reduce emissions by 40% by 2030, 60% by 2040, and 80% by 2050. The BC OBPS covers our Gas Transmission assets in BC, including the Westcoast Pipeline System and Aitken Creek, and imposes an annual obligation for stationary combustion, useful venting, and flaring emissions. Facilities exceeding their limit may comply through earned credits, offset units, or direct payment. However, if annual emissions are below the limit, the assets will earn credits to be banked for future use or sold to other operations.
Alberta’s Technology Innovation and Emissions Reduction Regulation
In May 2025, the Government of Alberta announced a freeze on its industrial carbon price under the Technology Innovation and Emissions Reduction (TIER) Regulation at CAD $95 per tonne of CO2e. Amendments adopted in December 2025 introduced a Direct Investment compliance option and opt-out provisions for smaller facilities, effective in 2026 and retroactive for 2025. We currently have two assets subject to TIER, which are Liquids Pipelines’ South Edmonton Terminal Natural Gas Power Plant and Gas Transmission’s Westcoast Gordondale natural gas compressor station, both of which submitted opt-out applications as of April 1, 2025, and received approval on January 30, 2026 for both facilities. As of December 31, 2025, compliance obligations remained in place; however, the price freeze stabilizes near-term costs compared to prior projections, while benchmark tightening continues at 2% annually. We expect to recognize a reduction in TIER compliance costs in 2026, corresponding to payment for the 2025 reporting year based on the compliance obligations as of March 31, 2025. These changes are not expected to have a material financial impact given the limited scope of regulated facilities and the announced opt-out provisions. We continue to monitor regulatory developments and evaluate TIER to manage cost and maintain compliance.
HUMAN CAPITAL RESOURCES
WORKFORCE SIZE AND COMPOSITION
As at December 31, 2025, we had approximately 14,800 regular employees, including approximately 2,600 unionized employees across our North American operations. Overall headcount rises to over 16,300 if temporary employees and contractors are included. While our strong preference is for direct employment relationships, where we have collectively bargained-for employees, we have mature working relationships with our labor unions and the parties have traditionally committed themselves to the achievement of renewal agreements without a work stoppage.
SAFETY
We believe all injuries, incidents and occupational illnesses are preventable. Our overall focus on employee and contractor safety continues to result in strong performance compared against industry benchmarks and we are actively engaged in continuous improvement as we pursue our goal of zero incidents.
PRODUCTIVITY AND DEVELOPMENT
We continually invest in our people’s personal and professional development and productivity because we recognize their success is our success. Employees are provided access to leading productivity tools and technology and can opt in to a range of development and growth opportunities through a variety of channels, which encourages employees to build new skills needed for our core and emerging lines of business.
EXECUTIVE OFFICERS
The following table sets forth information regarding our executive officers as at February 13, 2026:
|
|
|
Name |
Age |
Position |
Gregory L. Ebel |
61 |
President & Chief Executive Officer |
Patrick R. Murray |
51 |
Executive Vice President & Chief Financial Officer |
Colin K. Gruending |
56 |
Executive Vice President & President, Liquids Pipelines |
Matthew A. Akman |
58 |
Executive Vice President & President, Gas Transmission |
Michele E. Harradence |
57 |
Executive Vice President & President, Gas Distribution and Storage |
Reginald D. Hedgebeth |
58 |
Executive Vice President, External Affairs and Chief Legal Officer |
Allen C. Capps |
55 |
Senior Vice President, Strategy & President, Power |
Dean C. Patry |
53 |
Senior Vice President & Corporate Development Officer |
Laura J. Sayavedra |
58 |
Senior Vice President, Safety, Projects & Chief Administrative Officer |
Gregory L. Ebel became President and Chief Executive Officer (CEO) on January 1, 2023, and is a member of the Board. Mr. Ebel was Chair of the Board from 2017 to 2022 and served as Chairman, President and CEO of Spectra Energy from 2009 until 2017. Prior to that time, Mr. Ebel served as Spectra Energy’s Group Executive and Chief Financial Officer (CFO) beginning in 2007, President of Union Gas Limited from 2005 until 2007, and Vice President, Investor & Shareholder Relations of Duke Energy Corporation from 2002 until 2005.
Patrick R. Murray was appointed Executive Vice President & CFO on July 1, 2023. Mr. Murray has oversight of Enbridge’s financial affairs including investor relations, financial reporting, financial planning, treasury, tax, insurance, risk and audit management functions. He also oversees Enbridge’s technology and information services teams. Prior to assuming his current role, Mr. Murray was Senior Vice President & Chief Accounting Officer of Enbridge from June 2020 to June 2023, Vice President, Financial Planning & Analysis and Controller from June 2019 to May 2020, and Vice President, Financial Planning & Analysis from February 2017 to June 2019.
Colin K. Gruending was appointed Executive Vice President and President, Liquids Pipelines on October 1, 2021. Mr. Gruending is responsible for the overall leadership and operations of Enbridge’s Liquids Pipelines business. Previously, he served as our Executive Vice President and CFO from June 2019 to October 2021; and Senior Vice President, Corporate Development and Investment Review from May 2018 to June 2019.
Matthew A. Akman was appointed Executive Vice President & President Gas Transmission on January 1, 2026. He is responsible for the overall leadership and operations of Enbridge’s natural gas pipeline and midstream business across North America. Prior to assuming his current role, Mr. Akman was Executive Vice President, Corporate Strategy & President, Power from March 2023 to December 2025. Prior thereto, he was Senior Vice President, Corporate Strategy & President, Power from January 2023 to March 2023; Senior Vice President, Strategy, Power & New Energy Technologies from October 2021 to December 2022; and Senior Vice President, Strategy & Power from June 2019 to October 2021.
Michele E. Harradence was appointed Executive Vice President & President, Gas Distribution and Storage on March 5, 2023. She is responsible for the overall leadership and operations of Enbridge’s Gas Distribution and Storage business across North America. Prior to assuming her current role, Ms. Harradence was Senior Vice President & President, Gas Distribution and Storage from March 2022 to March 2023. Prior thereto, she was Senior Vice President and Chief Operations Officer of Enbridge’s Gas Transmission and Midstream business unit from June 2019 to March 2022 and Senior Vice President Operations, Gas Transmission and Midstream from February 2017 to June 2019.
Reginald D. Hedgebeth was appointed Executive Vice President, External Affairs and Chief Legal Officer on January 1, 2024. Mr. Hedgebeth leads our legal, public affairs, communications and sustainability, corporate security and aviation teams across the organization. Prior to joining Enbridge, Mr. Hedgebeth served as Chief Legal Officer of Capital Group from January 2021 to June 2023, Executive Vice President, General Counsel and Chief Administrative Officer of Marathon Oil Corporation from April 2017 to December 2020 and, prior to its merger with Enbridge in 2017, General Counsel, Corporate Secretary and Chief Ethics and Compliance Officer for Spectra Energy.
Allen C. Capps was appointed Senior Vice President, Strategy & President, Power on January 1, 2026. Mr. Capps is responsible for the overall leadership and operations of Enbridge’s power business and also leads our corporate strategy efforts. Prior to assuming his current role, Mr. Capps was Senior Vice President and Chief Commercial Officer, Gas Transmission from March 2022 to December 2025; Senior Vice President, Corporate Development and Energy Services from June 2019 to March 2022; and Senior Vice President and Chief Accounting Officer from February 2017 to June 2019.
Dean C. Patry was appointed Senior Vice President & Corporate Development Officer on November 17, 2025. He is responsible for mergers and acquisitions, capital allocation, investment review, and oversight of the Transaction Management Office. Prior to assuming his current role, Mr. Patry was Senior Vice President, Commercial & Strategy, Power from October 2023 to November 2025; and Senior Vice President, Operations & Engineering, Liquids Pipelines from July 2020 to September 2023. Mr. Patry joined Enbridge as Senior Vice President, Operations, Liquids Pipelines in May 2019.
Laura J. Sayavedra was appointed Senior Vice President, Safety, Projects & Chief Administrative Officer on January 1, 2024. Ms. Sayavedra is responsible for the oversight of our safety, capital project execution, human resources, real estate and supply chain management functions. Prior to assuming her current role, Ms. Sayavedra was Senior Vice President, Safety & Reliability, Projects and Unify from March 2022 to December 2023. Prior to that, she led Finance Transformation at Enbridge, and prior to its merger with Enbridge in 2017, was also Vice President & Treasurer for Spectra Energy, and CFO of Spectra Energy Partners LP.
ADDITIONAL INFORMATION
Additional information about us is available on our website at www.enbridge.com, on SEDAR+ at www.sedarplus.ca and on EDGAR at www.sec.gov. The aforementioned information is made available in accordance with legal requirements and is not, unless otherwise specifically stated, incorporated by reference into this Annual Report on Form 10-K. We make available free of charge, through our website, annual reports on Form 10-K, quarterly reports on Form 10-Q and current reports on Form 8-K and amendments to those reports filed or furnished pursuant to Section 13(a) or 15(d) of the Exchange Act, as well as proxy statements, as soon as reasonably practicable after we electronically file such material with, or furnish it to, the SEC. Reports, proxy statements and other information filed with the SEC may also be obtained through the SEC’s website (www.sec.gov).
ENBRIDGE GAS INC.
Additional information about Enbridge Gas Inc. (operating as Enbridge Gas Ontario) can be found in its annual information form, financial statements and MD&A for the year ended December 31, 2025, which have been filed with the securities commissions or similar authorities in each of the provinces of Canada. These documents contain detailed disclosure with respect to Enbridge Gas Ontario and are publicly available on SEDAR+ at www.sedarplus.ca. These documents are not, unless otherwise specifically stated, incorporated by reference into this Annual Report on Form 10-K.
ENBRIDGE PIPELINES INC.
Additional information about Enbridge Pipelines Inc. (EPI) can be found in its annual information form, financial statements and MD&A for the year ended December 31, 2025, which have been filed with the securities commissions or similar authorities in each of the provinces of Canada. These documents contain detailed disclosure with respect to EPI and are publicly available on SEDAR+ at www.sedarplus.ca. These documents are not, unless otherwise specifically stated, incorporated by reference into this Annual Report on Form 10-K.
WESTCOAST ENERGY INC.
Additional information about Westcoast Energy Inc. (Westcoast) can be found in its financial statements and MD&A for the year ended December 31, 2025, which have been filed with the securities commissions or similar authorities in each of the provinces of Canada. These documents contain detailed disclosure with respect to Westcoast and are publicly available on SEDAR+ at www.sedarplus.ca. These documents are not, unless otherwise specifically stated, incorporated by reference into this Annual Report on Form 10-K.
ITEM 1A. RISK FACTORS
The following risk factors could materially and adversely affect our business, operations, financial results, market price or value of our securities. This list is not exhaustive, and we place no priority or likelihood based on order of presentation or grouping under sub-captions.
RISKS RELATED TO OPERATIONAL DISRUPTION OR CATASTROPHIC EVENTS
Operation of complex energy infrastructure involves many hazards and risks that may adversely affect our business, financial results, the environment, relationships with stakeholders, the safety of the public and our workers, and our reputation.
These operational risks include accidents, third-party damage to assets or systems, equipment failure, process breakdowns, human error, major power disruptions, curtailment or limitations of commodity supply, operational incidents, failure of information technology or operational technology systems, security incidents (cyber or physical), lower than expected levels of operating capacity or efficiency, among others. Such events could be catastrophic in nature.
Operational risk is also intensified by exposure to severe weather conditions and natural disasters, including those related to climate change. Events such as heavy snowfall, extreme precipitation, floods, landslides, wildfires, hurricanes, cyclones, tornadoes, tropical storms, storm surges, ice storms, and extreme temperatures, as well as chronic physical risks like long-term changes in precipitation patterns, or sustained higher temperatures, can affect the safety and reliability of our operations. We have and expect to continue to experience climate-related physical risks, potentially with increasing frequency and severity, and we cannot guarantee that we will not experience catastrophic or other events in the future.
Our assets and operations are vulnerable to damage or disruption from these events, which could result in reduced revenue from business interruptions or reduced capacity and may also increase costs for repairs, remediation or adaptation measures. Such events have led to, and could again lead to, ruptures or product releases from our pipelines or facilities, causing property and environmental damage, personal injury or loss of life. Such an incident has in the past, and could again in the future, result in substantial losses that insurance may not fully cover, negatively impacting earnings. Such incidents could also have lasting reputational impacts and impair stakeholder relationships. For pipeline and storage assets located near populated areas, the potential damage could be even greater. We expect to continue to incur significant costs to prepare for and respond to operational risks. Additionally, we have faced, and could face again, litigation and significant fines and penalties from regulators in connection with such events.
A service interruption could have a significant impact on our operations, and negatively impact financial results, stakeholder relationships and our reputation.
A service interruption could significantly and negatively affect our operations, financial results, stakeholder relationships, the safety of our end-use customers, and our reputation. Interruptions to our crude oil and natural gas transportation services can disrupt customer operations and earnings, as they rely on us to move their products to market and fulfill contractual arrangements. Such disruptions have previously led to claims against us and they may do so again. We have experienced, and may again experience, service interruptions, restrictions or other operational constraints, including those related to operational incidents described in the preceding risk factor.
Our operations involve safety risks to the public and to our workers and contractors.
Enbridge's assets span a broad geographic area and often operate near populated areas. We have experienced major incidents involving these assets that have resulted in, and may again result in, injury or loss of life to members of the public. In addition, given the hazards inherent in our operations, our workers and contractors also face personal safety risks. Despite the precautions we take, such safety incidents have occurred in the past and may occur in the future. Such events could lead to reputational damage, legal claims, material repair costs, and higher operating or insurance costs.
Cyber attacks and other cybersecurity incidents pose significant threats to our technology systems and could materially adversely affect our business, operations, reputation or financial results.
Our business is dependent upon information systems and other digital technologies to control our plants, pipelines and other assets, process transactions, and summarize and report results of operations.
Cybersecurity risks have grown due to the proliferation of new technologies, increasingly sophisticated cyber attacks, and financially-motivated cybercrime, as well as international and domestic political factors, including geopolitical tensions, armed conflicts, civil unrest, sabotage, terrorism, and state-sponsored or other cyber espionage. Human error or malfeasance can also contribute to cyber incidents, which may occur internally or externally and at any point in our supply chain. Because of the critical nature of our infrastructure and our use of information systems and other digital technologies to control our assets, we face a heightened risk of cybersecurity incidents, such as ransomware, theft, misplaced or lost data, programming errors, phishing attacks, denial-of-service attacks, acts of vandalism, computer viruses, malware, hacking, malicious attacks, software vulnerabilities, employee errors and/or malfeasance, or other attacks, security or data breaches, or other cybersecurity incidents. Cyber threat actors have attacked, and continue to threaten to attack, energy infrastructure, including our assets. Government agencies have warned that attacks targeting critical infrastructure - including pipelines, utilities, and power generation facilities - are increasing in sophistication, magnitude, and frequency. These risks may escalate during periods of heightened geopolitical tensions.
We have experienced an increase in unauthorized attempts to access our systems and company data, and expect this trend to continue. While we invest heavily in security measures to prevent unwanted intrusions and to protect our systems and data, whether such data is housed internally or by external third parties, we and our third-party vendors have experienced, and expect to continue to experience, cyber attacks of varying degrees, including denial-of-service attacks. To date, these attacks have not, to our knowledge, had a material adverse impact on our business, operations or financial results, but future incidents could.
We expect that our technology systems, as well as those of our vendors or other service providers, will continue to be targeted, which could compromise our data and systems, and access thereto by us, our customers or others. Such events could disrupt our operations, impair our ability to correctly record, process and report transactions, or result in the loss of information. There is no certainty that our business continuity measures will completely eliminate the risk of disruption or adverse business effects. Furthermore, we and some of our third-party service providers (who may in turn also use third-party service providers) collect, process or store sensitive data in the ordinary course of our business, including personal information of employees, customers, landowners, and investors, as well as intellectual property or other proprietary business information. These risks are heightened following the Acquisitions, which increase the attack surface and the volume of personal customer information processed.
Consequences of a significant cyber incident could include revenue loss, repair, remediation or restoration costs, regulatory action, fines and penalties, litigation, breach of contract or indemnity claims, cyber extortion or ransomware payments, implementation costs for additional security measures, loss of customers, customer dissatisfaction, reputational harm, or other adverse consequences, costs or financial loss. Regardless of the method or form of cyber attack or incident, any or all of the above could materially adversely affect our reputation, business, operations or financial results.
New and changing cybersecurity legislation, regulations and orders have been implemented or are proposed, resulting in additional regulatory oversight and compliance requirements, which require internal and external resources and increase costs. The potential impacts of future cybersecurity-related legislation, regulations or orders on our business remain uncertain and cannot be reliably predicted.
A cyber attack may occur and remain undetected for an extended period, representing an inherent risk that we must continually manage. Investigations of cyber attacks or other security incidents are often unpredictable and typically take time to complete before full and reliable information becomes available. In this period, we may lack visibility into the damage or the optimal corrective approach, allowing issues to persist or escalate and driving up both costs and risks. Remediation efforts may not be successful. Failure to implement, maintain and upgrade adequate safeguards could materially and adversely affect our results of operations, cash flows, and financial condition. Recent rulemakings may require disclosure of cybersecurity incidents before investigations or remediations are complete, adding complexity and risk. As cyber attacks continue to evolve, we may need to invest significant additional resources to strengthen protections and address vulnerabilities.
Media reports about a cyber attack or other significant security incident, whether accurate or not, or our failure to make adequate or timely disclosures to the public, regulators, law enforcement, or affected individuals could negatively impact our operating results and result in other adverse consequences, including reputational harm, damage to our competitiveness, strained relationships with customers, partners, suppliers, investors, and other stakeholders. Such circumstances could also lead to operational disruption, increased remediation and protection costs, significant litigation or regulatory action, fines or penalties, all of which could materially adversely affect our business, operations, reputation or financial results.
Advancements in AI and the speed at which we can implement them or not increases our cybersecurity risks discussed above and also have the potential to negatively affect our business, operations, reputation or financial results.
Secure processing, maintenance and transmission of information are critical to our business. This includes the integration of AI to enhance both efficiency and safety. For example, Enbridge utilizes cloud-based platforms and internal AI assistants to make workflows and data analysis more efficient.
As AI adoption and integration accelerates in our day-to-day operations, the associated technology and cybersecurity risks are also intensifying, increasing the potential for system vulnerabilities and exposure to malicious threats. The continuous evolution and increasing use of generative AI systems both by Enbridge and third parties, as well as the embedding of AI technologies into software, systems and other tools currently used or being considered for use by Enbridge pose a number of risks to Enbridge’s technology, information systems and data privacy. This is due to its potential for user misuse, decision-making based on biased or incorrect models or information, unauthorized exposure of sensitive data, unauthorized use of intellectual property and other risks, all of which potentially compromise safety, productivity and profitability. AI tools have the potential to provide advantages to Enbridge if successfully used, developed and implemented with the proper governance, but those benefits may require significant expenditures and may never materialize, which could adversely affect our business, financial condition and results of operations.
We are subject to risks relating to the integrity of our systems and infrastructure, as well as affiliate and third-party computer systems, computer networks and other communication systems.
System interruption and the lack of integration and redundancy in the information systems and infrastructure, both of our own websites and other computer systems and of affiliate and third-party software, computer networks and other communications systems service providers on which we rely, could adversely affect our ability to conduct our operations. Such interruptions could occur as the result of natural disaster, malicious actions, such as hacking or acts of terrorism or war, human error or other causes, such as break-downs in technology or other malfunctions. With respect to third-party software or systems, there are certain arrangements that are not covered by long-term agreements. In addition, the loss of some or all of certain key personnel could require us to expend additional resources to continue to maintain our software and systems and could subject us to systems interruptions.
While we have backup systems, offsite and cloud-based data centers, and service redundancy for certain aspects of our operations, disaster recovery planning by its nature cannot account for all eventualities. In addition, we may not have adequate insurance coverage to compensate for any or all losses from a major interruption. If any of these adverse events were to occur, it could adversely affect our business, financial condition and results of operations.
Terrorist attacks and threats, escalation of military activity in response to these attacks or acts of war, other civil unrest or activism, or geopolitical uncertainty could adversely affect our business, operations or financial results.
Terrorist attacks and threats (which may take the form of cyber attacks, as outlined above), escalation of military activity, armed hostilities, war, sabotage, or civil unrest or activism may disrupt general economic conditions, cause fluctuations in consumer confidence and spending, and affect market liquidity, all of which could negatively impact our business. Future terrorist attacks, rumors or threats of war, actual conflicts involving the US or Canada, civil unrest or military, trade, or commodity supply and demand disruptions may significantly affect our operations and those of our customers. Strategic critical infrastructure, including energy-related assets, face heightened risk of cyber or physical attacks. Our assets and projects under construction could be direct targets or indirect casualties of such an attack.
In addition, increased environmental activism against energy infrastructure could lead to work delays, reduced demand for our services, new or stricter legislation or public policy, or denial or delay of permits and rights-of-way. We also face risks related to international relations and geopolitical events. Factors such as political, economic, or social instability, trade disputes, increased tariffs, legal and regulatory changes, and shifts in political leadership can lead to volatility in commodity prices and affect energy availability and costs.
RISKS RELATED TO CLIMATE CHANGE
Climate change risks could adversely affect our reputation, strategic plan, business, operations and financial results, and these effects could be material.
Climate change is a systemic risk that presents both physical and transition risks to our organization. A summary of these risks is outlined below. Given the interconnected nature of climate change-related impacts, we also discuss these risks within the context of other risks impacting Enbridge throughout Item 1A. Risk Factors. Climate change and its associated impacts may also increase our exposure to, and magnitude of, other risks identified in Item 1A. Risk Factors. Our business, financial condition, results of operations, cash flows, reputation, access to and cost of capital or insurance, business plans and strategy may all be materially adversely impacted as a result of climate change and its associated impacts.
PHYSICAL RISKS
Climate-related physical risks arise as a result of changing and more extreme weather, which can damage our assets and affect the safety and reliability of our operations. Climate-related physical risks may be acute or chronic. Acute physical risks are those that are event-driven, including increased frequency and severity of extreme weather events, such as heavy snowfall, extreme precipitation, floods, landslides, wildfires, hurricanes, cyclones, tornados, tropical storms, storm surges, ice storms, and extreme temperatures. Chronic physical risks are longer-term shifts in climate patterns, such as long-term changes in precipitation patterns, or sustained higher temperatures, which may cause sea level rises or chronic heat waves. Chronic physical risks may also include altered river flows, land shifting, and subsidence.
Our assets and operations are exposed to the risk of damage or other negative impacts from these kinds of events, which have resulted in and could in the future result in, reduced revenue from business disruption or reduced capacity and increased costs due to repairs and adaptation measures. We have experienced operational interruptions and damage to our assets from such weather events in the past, and we expect to continue to experience climate-related physical risks in the future, potentially with increasing frequency or severity. Such events may also result in personal injury or loss of life.
TRANSITION RISKS
The global transition to a lower-carbon economy involves policy, legal, technology and market changes which may, in turn, increase our cost of operations and influence stakeholder sentiment and decisions about Enbridge. Potential impacts include adverse impact on our reputation and reduced demand for some of our services, which could, in turn, result in decreased profitability or reduced value of our assets. Transition risks include the following categories:
We are subject to various climate change and emissions-related laws and regulations in the jurisdictions where we operate, including at the federal, state/provincial, and local levels, and these continue to evolve and change with shifting government policy and public sentiment. Key carbon-related policies and regulations that impact us are described in Part I, Item 1. Business - Regulation - Environmental Regulation. Carbon pricing in the form of carbon charges, carbon levies, or other carbon pricing frameworks poses risks to our business, including potential reduced demand for our services and decreased economic viability for our projects. We are also subject to anti-greenwashing legislation and are impacted by climate-related disclosure requirements in development in certain jurisdictions where we operate. Such evolving policy, legislation and regulation could influence commodity demand, and the overall energy mix we deliver and has already led to increased compliance risk and costs, including higher costs for our customers. Stakeholder opposition to parts of our business and the energy industry, particularly fossil fuels, continues to pose risks to our business such as climate-related protests, complaints, litigation and regulatory actions, including against Enbridge. In addition, anti-ESG activism has grown, creating competing stakeholder priorities, fragmented regulatory regimes, and greater uncertainty. We have faced, and expect to continue to face, climate-related legal challenges. Defending and resolving these claims has resulted in increased costs and will likely lead to additional expenses, and could affect our reputation, strategy, and financial performance.
Achieving our emissions reduction goals depends partly on technological improvements, innovation, and modernization of our existing assets. Advances in technologies such as renewable power, carbon capture and storage, and other lower-carbon energy infrastructure can help reduce our emissions, extend the life of our assets, and diversify our business. However, relying on these technologies also carries risks, including the pace of technological development, uncertain regulatory requirements, and potentially high costs that could make the use of such technologies uneconomical. If emerging technologies do not materialize as expected, meeting our emissions reduction goals could become more difficult.
Concerns about climate change, rising demand for lower-carbon energy and new energy technologies, shifting customer behavior, and reduced energy consumption could decrease demand for our services or our securities. In recent years, certain investors, lenders and insurers have begun or are contemplating reducing the carbon intensity of their portfolios or limiting support for the fossil fuel industry. These actions could increase our costs to manage these risks and restrict access to, or increase the cost of, capital and insurance. Market uncertainty, including abrupt or significant changes in energy prices and demand, which could be driven by climate change, could negatively impact operations, for example through reduced throughput volumes on our pipeline systems.
Energy companies, including Enbridge, continue to face negative perceptions about fossil fuels and pipelines, which can lead to stakeholder opposition to our operations and infrastructure projects, as well as investor, stakeholder or regulatory concerns about stranded assets. Such factors may impact our ability to secure capital or complete new projects.
Enbridge’s climate-related activities, goals, commitments, and plans are based on various assumptions, estimates, judgments, risks, and uncertainties. Rules, standards, and methodologies for setting climate-related goals and for measuring and reporting climate-related information are still developing. As such, our climate-related goals and disclosures are based on assumptions that are subject to change. Achieving our sustainability-related goals and commitments will require collective efforts and actions from a wide range of stakeholders, much of which is beyond our control, and there can be no assurance that these efforts will deliver the intended impact. Our climate-related goals and emissions-reduction pathways will continue to evolve and may need to be revised as data improves, standards, methodologies, metrics, and measurements mature, and legislation, regulations, and stakeholder expectations change.
If we encounter challenges or perceived challenges in achieving our climate-related goals, fail to comply with climate-related regulatory or reporting requirements, or fall short of stakeholder expectations, it could negatively impact our reputation, reduce demand for our services or securities, and expose us to enforcement actions or litigation, which could impact our business, operations or financial results.
RISKS RELATED TO OUR BUSINESS AND INDUSTRY
There are utilization risks with respect to our assets, across all business segments.
Liquids Pipelines: We are partially exposed to throughput risk on the Canadian Mainline, and are exposed to throughput risk under certain tolling agreements for other assets, such as the Lakehead System. Lower transported volumes can directly reduce our revenues and earnings. Utilization of our assets may be affected by factors such as changing market fundamentals, capacity bottlenecks, regulatory restrictions, maintenance, operational incidents, and increased competition. Commodity prices, price differentials, weather, gasoline prices and consumption, tariffs, alternative and new energy sources and technologies, and global supply disruptions and dynamics, including those that may arise due to geopolitical conflicts, can also influence the supply of, demand for, and price of crude oil and other liquid hydrocarbons transported on our pipelines.
Gas Transmission: Shifts in regional and global production and consumption continue to affect gas supply and demand dynamics, which can lead to fluctuations in commodity prices and price differentials and potential underutilization of some parts our system. Other factors affecting system utilization include operational incidents, regulatory restrictions, system maintenance, and increased competition.
Gas Distribution and Storage: Customers of our gas distribution franchises are billed on both a fixed charge and volumetric basis, and our ability to collect the total revenue requirement (the cost of providing service, including a reasonable return to the utility) in certain jurisdictions, depends on achieving the forecast distribution measures set during the rate-making process. The probability of realizing such measures varies by jurisdiction but is generally contingent upon four key forecast variables: weather, economic conditions, pricing of competitive energy sources, and customer growth. Weather is a significant driver of delivery volumes, as many customers use natural gas for heating. Our ability to add new customers could be impacted by housing market conditions, such as interest rates and affordability on new home construction, and energy transition trends. Large commercial and industrial volumes are more sensitive to economic conditions and fuel-switching options. Even where total forecast distribution volumes are met, we may not achieve expected ROE due to other forecast variables, such as fluctuations in the mix between higher- and lower-margin customers. All of our gas distribution businesses remain at risk for actual versus forecast of large volume contract commercial and industrial volumes.
Renewable Power Generation: Earnings from our Renewable Power Generation assets are highly dependent on weather and atmospheric conditions, as well as continued operational availability of these energy producing assets. While the expected energy yields for our projects are predicted using long-term historical data, wind and solar resources are subject to natural variation from year-to-year and from season-to-season. Any prolonged reduction in wind or solar resources at any facilities could lead to decreased earnings and cash flows. Additionally, inefficiencies or interruptions of facilities due to operational disturbances or outages resulting from weather conditions or other factors, could also impact earnings.
Our assets vary in age and were constructed over many decades, which causes our inspection, maintenance or repair costs to increase.
Our pipelines vary in age and were constructed over many decades. Pipelines are generally long-lived assets, and pipeline construction materials and techniques, including coating, have evolved over time. Depending on the era of construction and construction techniques, some assets require more frequent inspections, which have resulted in, and are expected to continue in the future to result in, increased maintenance and repair costs. Any significant increase in these expenditures could adversely affect our business, operations or financial results.
Competition may result in a reduction in demand for our services, fewer project opportunities or assumption of risk that results in weaker or more volatile financial performance than expected.
Competition in all of our businesses, including competition for new project development opportunities, could have a negative impact on our business, financial condition or results of operations.
Our Liquids Pipelines business faces competition from existing and proposed pipelines serving Canadian, US and international markets, including those that may advance through inter-provincial and federal agreements or collaboration. Key competitive factors include transportation costs, access to supply, service quality and reliability, contract carrier alternatives, and proximity to markets. Commodities transported in our pipelines increasingly compete with emerging alternatives for end-users, such as electricity and electric batteries. We also compete with alternative storage facilities.
Our Gas Transmission business competes with similar facilities that serve the same supply and market areas. Natural gas also competes with other energy sources, including electricity, coal, propane, fuel oils, and renewables.
Our Gas Distribution and Storage business competes with other forms of energy available to customers and end-users, including electricity, coal, propane and fuel oils.
Our Renewable Power Generation business faces competition in securing long-term power purchase agreements and from other fuel sources in the markets in which we operate.
Our secured projects and maintenance programs are subject to various factors, which may affect our ability to drive long-term growth.
Our project execution continues to face challenges, including intense scrutiny of regulatory and environmental permit applications, politicized permitting processes, public opposition such as protests, efforts to repeal permits, and resistance to land access, which have increased construction complexity and, in certain cases, delayed project completion. Joint ventures further increase complexity and reduce our ability to control project execution.
Continued challenges with global supply chains have created unpredictability in material costs and availability. Labor shortages and inflationary pressures have increased the costs of engineering and construction services. Recent and proposed legislation in Canada and the US aimed at increasing supply chain integrity, including with respect to forced labor and child labor, together with measures by us, our suppliers and governments, may impact business activities, global and North American supply chains, and our procurement processes, potentially impacting the availability or cost of goods and materials that we purchase. There is a risk that our supply chain may actually use or be alleged to have used forced labor or child labor, which could impact our reputation.
Other factors that can, and have in the past, delayed project completion and increased project costs include contractor or supplier non-performance, tariffs, extreme weather events and geological factors beyond our control.
The effects of US, Canadian and other governments' policies on tariffs and trade relations are uncertain and could adversely impact our business, operations or financial results.
The announcement and imposition of tariffs by the US, together with potential, announced or implemented retaliatory tariffs by other governments on imports from the US, and other potential measures, including duties, fees, economic sanctions or other trade measures, as well as the potential impacts of these tariffs and trade measures, present significant risks to our business operations and financial results. Tariffs announced by the US (which are in addition to any pre-existing tariffs) which may impact our business operations include, among others:
•tariff on Canadian goods that are non-compliant under the United States-Mexico-Canada Agreement (USMCA) (excludes crude oil, natural gas, and natural gas liquids);
•global tariffs on steel and aluminum; and
•other periodic retaliatory tariffs on Canada.
Several of the US tariff announcements have been followed by announcements of limited exemptions and temporary pauses on implementation dates. In response to the US tariff announcements, certain governments have threatened or announced retaliatory measures against the US and/or are in the process of negotiating with the US on tariff agreements. These announcements led to significant uncertainty and market volatility throughout 2025. If maintained, such trade measures, the nature, extent and timing of which are uncertain, and the potential for escalation of trade disputes, including retaliatory measures, could lead to, among other things, worsening of macroeconomic conditions, inflationary pressures, increased construction costs, costs to maintain our assets and other costs and expenses, as well as to potential reductions in demand for US and/or Canadian energy. The measures also introduce uncertainty in North American energy and capital markets and have the potential to disrupt supply chains and access to capital markets and jeopardize our competitiveness. The US Government has also stated its interest in renegotiating and altering the USMCA, which could further impact the energy market and our business.
Any of the foregoing could significantly adversely impact our business, operations or financial results.
Our business is exposed to changes in market prices, including but not limited to interest rates and foreign exchange rates, which could materially impact our financial results. Our risk management policies cannot eliminate all risks and may result in material financial losses. In addition, any non-compliance with our risk management policies could adversely affect our business, operations or financial results.
Our use of debt financing exposes us to interest rate fluctuations on both future fixed rate debt issuances and floating rate debt. While our financial results are denominated in Canadian dollars, many of our businesses have foreign currency revenues or expenses, particularly the US dollar.
We use financial derivatives to manage risks associated with changes in foreign exchange rates, interest rates, commodity prices, and power prices, to reduce the volatility of our cash flows. Based on our risk management policies, substantially all of our financial derivatives are associated with an underlying asset, liability and/or forecasted transaction and are not intended for speculative purposes.
These policies cannot, however, eliminate all risk, including unauthorized trading. Although this activity is monitored independently by our risk management function, we can provide no assurance that we will detect and prevent all unauthorized trading and other violations, particularly if deception, collusion or other intentional misconduct is involved, and any such violations could adversely affect our business, operations or financial results.
To the extent that we hedge our exposure to market prices, we will forego the benefits we would otherwise experience if these were to change in our favor. In addition, hedging activities can result in losses that might be material to our financial condition, results of operations and cash flows. Such losses have occurred in the past and could occur in the future. See Part II. Item 7A. Quantitative and Qualitative Disclosures about Market Risk and Item 8. Financial Statements and Supplementary Data for a discussion of our derivative instruments and related hedging activities.
Stakeholder expectations and government policies on sustainability, climate change, social and human capital management topics, and environmental protection continue to evolve and an inability to meet these requirements and expectations could erode stakeholder trust and investor confidence, damage our reputation, influence stakeholder actions and decisions and negatively impact our business, operations or financial results.
Companies across all sectors and industries are facing changing expectations and continued scrutiny from a wide range of stakeholders on sustainability, climate change, social and human capital management topics, and environmental practices. Our customers, investors, employees, regulators, and other stakeholders have diverse and evolving expectations on these topics. These changing expectations may heighten existing risks, or create new risks, which could lead to increased costs, project delays or cancellations, loss of growth opportunities, permit denials or restrictions, public protests, activism and legal challenges. We may not be able to satisfy all stakeholder expectations and demands, which could result in adverse publicity, reputational harm, legal claims, regulatory compliance challenges, strained stakeholder relationships, and operational risks, and could adversely impact our access to and cost of capital and demand for, or value of, our services or securities, any of which could have a material adverse effect on our business.
Unexpected shifts in energy demands, including those driven by climate change concerns, could reduce revenue through, for example, reduced throughput volumes on our pipeline systems.
Maintaining and meeting any sustainability-related goals we have set or may set in the future, including any related to emissions reduction, involve significant costs and uncertainty, including as a result of changes in regulatory, technological, financial and operational conditions. We may not be able to, or may be perceived as being unable to, achieve such goals, either in a timely manner or at all, may need to adjust or rescind such goals as a result of changing circumstances, or expected benefits of achieving such goals may not materialize. If we experience challenges, or perceived challenges, in achieving our sustainability-related goals, regulatory or reporting requirements (which continue to change and diverge across different jurisdictions), or stakeholder expectations, it could harm our reputation, affect investor confidence, or expose us to enforcement actions or litigation, which may impact our business, operations or financial results.
Our forecasted assumptions may not materialize as expected, including on our expansion projects, acquisitions and divestitures.
We evaluate expansion projects, acquisitions, and divestitures on an ongoing basis. Planning and investment analysis is highly dependent on accurate forecasting and the use of appropriate assumptions. If these assumptions do not materialize, financial performance may be lower or more volatile than expected. Economic volatility and unpredictability, both locally and globally, and changes in cost estimates, project scope, or risk assessment could result in reduced profitability. In addition, abrupt and unexpected shifts in energy costs and demands, have in the past, and may again in the future, negatively impact revenue, for example, from reduced throughput volumes on our pipeline systems.
We may encounter difficulties in successfully integrating the US Gas Utilities into our business, which may negatively affect the expected benefits from the Acquisitions.
In 2024, we completed the Acquisitions of the US Gas Utilities. The success of the Acquisitions will depend on, among other things, our ability to integrate the US Gas Utilities into our business effectively to achieve anticipated benefits and growth opportunities. There is a significant degree of difficulty and management distraction inherent in the process of integrating an acquisition, including challenges with integrating certain operations and functions, technologies, organizations, and policies and procedures; managing cultural differences; and retaining key personnel. The integration may be complex and time-consuming and involve delays or additional and unforeseen expenses. The integration process and other disruptions resulting from the Acquisitions may also disrupt our ongoing business.
Any failure to realize the anticipated benefits of the Acquisitions, additional unanticipated costs or delays, or other factors could negatively impact our earnings or cash flows, decrease or delay any beneficial effects of the Acquisitions, and negatively impact our business, financial condition and results of operations.
Our insurance coverage may not fully cover our losses in the event of an accident, natural disaster or other event, and we may encounter increased cost arising from the maintenance of, or lack of availability of, insurance.
Our operations involve many hazards inherent in our industry as described in this Item 1A. Risk Factors. While we maintain an insurance program for Enbridge, our subsidiaries and certain affiliates, to mitigate a certain portion of our risks, not all risks are insurable or are insured by us. Limitations may arise due to lack of availability, high premiums or other factors. We self-insure a significant portion of certain risks through our wholly-owned captive insurance subsidiary, and our insurance coverage is subject to terms and conditions, exclusions and large deductibles, or self-insured retentions, which may reduce or eliminate coverage in certain circumstances.
Our insurance policies are generally renewed annually, and premiums, terms, policy limits and/or deductibles, can vary substantially, based on factors like market conditions. We can give no assurance that we will be able to maintain adequate insurance in the future at rates or on other terms that we consider commercially reasonable. In such a case, we may decide to self-insure additional risks.
A significant self-insured loss, uninsured loss, a loss significantly exceeding insurance policy limits, delays in claim payments, or inability to renew insurance policies on similar or favorable terms, could materially and adversely affect our business, financial condition and results of operations.
We rely on access to short-term and long-term capital markets to finance capital requirements and support liquidity needs. If we or our rated subsidiaries are unable to maintain an investment-grade credit rating, it could impair cost effective access to those markets. Our ability to maintain cost-effective access to these markets may be influenced by several factors, including market volatility, interest rate fluctuations, geopolitical instability, and systematic banking risk.
A significant portion of our consolidated asset base is financed with debt, and the maturity and repayment profile of that debt often does not correlate to cash flows from assets. Accordingly, we rely on access to both short-term and long-term capital markets as a source of liquidity for capital requirements not satisfied by cash flows from operations and to refinance investments originally financed with debt. Our senior unsecured long-term debt is currently rated investment-grade by various rating agencies. If the rating agencies were to rate us or our rated subsidiaries below investment-grade, our borrowing costs could increase, potentially significantly. Consequently, we could be required to pay a higher interest rate in future financings and our potential pool of investors and funding sources could decrease.
We maintain revolving credit facilities at various entities to backstop commercial paper programs, for borrowings and for providing letters of credit. These facilities typically include financial covenants, and failure to maintain these covenants at a particular entity may result in accelerated repayment obligations or preclude that entity from accessing the credit facility, which could impact liquidity. If our short-term debt rating were to be downgraded, access to the commercial paper market could be significantly limited. Although this would not affect our ability to draw under our credit facilities, borrowing costs could be significantly higher.
If we are not able to access capital at competitive rates, or at all, our ability to finance operations, pursue growth opportunities, or refinance existing debt could be affected. Any downgrade or other event negatively affecting the credit ratings of our subsidiaries could make their costs of borrowing higher or access to funding sources more limited, which in turn could require us to provide liquidity in the form of capital contributions or loans to such subsidiaries, thus reducing the liquidity and borrowing availability of the consolidated group.
Our Liquids Pipelines growth rate and results may be adversely affected by commodity prices.
Wide commodity price basis between Western Canada and global tidewater markets has negatively impacted producer netbacks and margins in the past, largely due to pipeline takeaway capacity constraints in Western Canada and North Dakota. A protracted long-term outlook for low crude oil prices could result in delays or cancellation of future projects.
The tight conventional oil plays of Western Canada, the Permian Basin, and the Bakken region of North Dakota, have short cycle break-even time horizons (typically less than 24 months) and high decline rates that can be managed through active hedging programs and are positioned to react quickly to market signals. Accordingly, during periods of comparatively low prices, drilling programs, unsupported by hedging programs, may decrease, reducing supply growth from tight oil basins, which could impact volumes on our pipeline systems.
Crude oil marketing generates margin by capitalizing on quality, time and location differentials when opportunities arise. Changing market conditions that impact the prices at which we buy and sell commodities have in the past limited margin opportunities and impeded our ability to cover capacity commitments and could do so again in the future. Other market conditions, such as backwardation, have likewise limited margin opportunities.
Our Gas Transmission results may be adversely affected by commodity price volatility.
We hold a 13.2% effective economic interest in DCP, which is in the businesses of gathering, treating, processing and selling natural gas and NGL. In addition, we own Tomorrow RNG, which operates landfill gas-to-RNG production facilities, and Aitken Creek, which operates an underground natural gas storage facility. The financial results of these businesses are directly and indirectly impacted by changes in commodity prices. To a lesser degree, the financial results of our Gas Transmission business are subject to fluctuation in power prices, which impact electric power costs associated with operating some of our compressor stations.
We are exposed to the credit risk of our customers, counterparties, and vendors.
We are exposed to the credit risk of multiple parties in the ordinary course of our business. Generally, our customers are rated investment-grade, are otherwise considered creditworthy, or provide us with security to satisfy credit concerns. However, we cannot predict to what extent our business would be impacted by deteriorating economic conditions, including possible declines in the creditworthiness of our customers, vendors, or counterparties. Payment or performance defaults from these entities, if significant, could adversely affect our earnings and cash flows.
Our business requires the retention and recruitment of a skilled and inclusive workforce, and difficulties in recruiting and retaining our workforce could result in a failure to implement our business plans.
Our operations and management require the retention and recruitment of a skilled and inclusive workforce, including engineers, technical personnel, other professionals, executive officers, and senior management. We compete with other companies in the energy industry, and for some jobs, the broader labor market, for this skilled workforce. If we are unable to retain current employees and/or recruit new employees of comparable knowledge and experience, our business could be negatively impacted. In addition, we could experience increased costs to retain and recruit these professionals.
RISKS RELATED TO GOVERNMENT REGULATION AND LEGAL RISKS
Many of our operations are regulated and failure to secure timely regulatory approval for our proposed projects, or loss of required approvals for our existing operations, could have a negative impact on our business, operations or financial results.
The nature and scope of government policy, regulation and legislation governing permitting and environmental review for energy infrastructure in Canada and the US continues to evolve. At the same time, energy companies continue to face opposition from anti-fossil fuel/anti-pipeline activists, environmental groups, politicians and other stakeholders concerned about the safety and environmental impacts of energy infrastructure.
In the US, the current administration has declared an energy emergency, and this directive shaped the rulemaking and guidance efforts across federal agencies in 2025 resulting in significant policy changes from the prior administration:
•Formed the National Energy Dominance Council designed to bolster energy production and minimize regulatory roadblocks to building energy infrastructure projects and energy development;
•Proposed to modify the EPA rules to reduce and report methane emissions from the oil and gas sector and to streamline the process for states and tribes to assume authority over the Clean Water Act's section 404 permitting program for discharges of dredge and fill material;
•Repealed the Council for Environmental Quality (CEQ) regulations implementing the National Environmental Policy Act (NEPA);
•Enacted the One Big Beautiful Bill Act that includes measures to streamline reviews under NEPA and the US Supreme Court narrowed the scope of NEPA review in a pivotal decision referred to as Seven County Infrastructure;
•CEQ issued guidance and a template to streamline NEPA reviews, and many federal agencies have implemented new agency-specific procedures seeking to streamline NEPA environmental reviews;
•FERC rescinded its draft GHG and draft Updated Certificate policy statements concerning the development of natural gas infrastructure projects and consideration of climate change and environmental justice when reviewing natural gas projects. FERC further eliminated an order that slowed project construction timelines and temporarily raised the cost limits for projects that qualify under the Blanket Certificate Program while considering permanent changes; and
•PHMSA issued rules updating requirements for sustainable and safe pipeline operation and refocused its efforts to safety regulation.
Some actions by the current US administration are being challenged in the courts, and further legal challenges to the US administration and/or agency actions may occur. The current US administration may take further action to promulgate new regulations and/or modify or reverse regulations that were promulgated by the prior US administration. These actions may significantly change environmental reviews for energy projects.
In Canada, the federal and provincial governments are undertaking various regulatory streamlining initiatives, including the passage of the Building Canada Act and the establishment of the Major Projects Office, with a mandate to advance major projects in Canada and streamline regulatory project approvals, including potentially with respect to a crude oil pipeline from Alberta to the west coast of Canada. Such legislative and regulatory actions may significantly change regulatory review processes and the competitive landscape for new pipeline projects in Canada and may increase the risk of legal challenges to project approvals from parties opposed to these legislative and regulatory changes specifically and to fossil fuels generally.
Actions by regulators, legislators, or stakeholders could adversely impact permitting for energy projects. We may not be able to obtain or maintain all required regulatory approvals for our operating assets or development projects. If there is a significant delay in obtaining any required regulatory approvals, if we fail to obtain or comply with them, or if laws or regulations change or are administered in a more stringent manner, the operations of existing facilities or the development of new facilities could be prevented, delayed or become subject to additional costs.
Our operations are subject to numerous environmental laws, regulations, and rules, including those relating to emissions reduction, climate-related disclosure, and anti-greenwashing. Compliance may require significant capital expenditures, increased operating costs, affect or limit our business plans, expose us to environmental liabilities or litigation, and affect our reputation and stakeholder relationships.
We are subject to numerous environmental laws and regulations affecting many aspects of our operations, including, but not limited to, air emissions, climate change, water, soil, land management, waste, hazardous substances, wildlife and protected species, biodiversity, noise, emergency response, and pollution. We are also subject to new and evolving environmental laws, regulations and rules, including climate-related disclosure and anti-greenwashing obligations, such as recent amendments to Canadian competition legislation. Environmental laws, government policies, and stakeholder expectations are dynamic and vary across the jurisdictions where we operate. These requirements are not only evolving rapidly but can also conflict with one another, creating regulatory uncertainty and complexity. For example, under the current US administration, the deregulatory agenda has significantly altered the regulatory landscape for the energy sector. Executive actions prioritized expedited permitting processes under the Clean Water Act and reduced environmental compliance requirements, creating a more favorable environment for conventional energy. In parallel, the administration actively rolled back renewable energy incentives, including tax credits for wind, solar, and electric vehicles, and imposed a moratorium on offshore wind development, which creates a less favorable environment for renewable energy. This continual change increases compliance risk, as we must navigate differing standards, overlapping obligations, and emerging disclosure and substantiation requirements, all while maintaining alignment with stakeholder expectations. Our exposure to these risks could result in adverse impacts to our reputation and relationships with stakeholders or increased costs, liabilities or litigation.
Compliance with environmental laws, regulations, and rules, including those related to climate change, GHG emissions, climate-related disclosure, and anti-greenwashing, has, and is expected to continue in the future to, require significant capital investment and higher operating costs, which we may not be able to recover. These expenses include, for example, emissions monitoring and reporting, equipment replacements or modernization, and third-party verification or assurance of environmental data.
If we are unable to obtain or maintain all required environmental regulatory approvals and permits for our operating assets and projects, or if there is a delay in obtaining any required environmental regulatory approvals or permits, the operation of existing facilities or the development of new facilities could be prevented, delayed, or become subject to additional costs. Failure to comply with environmental laws, regulations, and rules may result in the imposition of civil or criminal fines, penalties and injunctive measures, which could harm our reputation and impact our operating assets.
Our operations are subject to a range of regulatory and contractual requirements, including compliance with operational regulations, easements, permits, and other land tenure agreements. Failure to comply with these obligations could negatively impact our reputation, business, operations or financial results.
Operational risks relate to compliance with applicable operational rules and regulations mandated by governments, applicable regulatory authorities, or other requirements that may be found in easements, permits, or other agreements that provide a legal basis for our operations. Breaches of these obligations may lead to fines, penalties, damage awards, operational restrictions or shutdowns, and an overall increase in operating and compliance costs.
We do not own all of the land on which our pipelines, facilities and other assets are located, and we rely on rights granted by third parties or government entities to construct and operate our pipelines and other assets. In addition, some of our pipelines, facilities, and other assets cross Indigenous lands pursuant to rights-of-way or other land tenure interests. Our loss of these rights, including through our inability to renew them as they expire, could adversely affect our reputation, operations and financial results. We have experienced litigation relating to easements, including in relation to Line 5. Refer to Part II. Item 7. Management's Discussion and Analysis of Financial Condition and Results of Operations - Legal and Other Updates.
Regulatory scrutiny of our assets and operations has the potential to increase operating costs or limit future projects. Regulatory enforcement actions issued by regulators for non-compliance can increase operating costs and negatively impact our reputation. Potential regulatory changes and legal challenges could impact our future earnings from operations and construction costs for new projects. Future regulatory actions and decisions or legislative changes may differ from current expectations, creating uncertainty for the regulatory environments in which we operate. While we actively monitor and engage with regulators on potential regulatory changes and develop response plans to such changes, these efforts may be ineffective or insufficient. Although we prioritize safe, reliable operations and compliance with current regulations, regulators or government authorities may still take unilateral actions that could disrupt operations or create adverse financial impacts.
Our operations are subject to economic regulation and failure to secure regulatory approval for our proposed or existing commercial arrangements could have a negative impact on our business, operations or financial results.
Our Liquids Pipelines, Gas Transmission, and Gas Distribution and Storage assets face economic regulation risk. Economic regulation risk arises when governments or regulatory agencies change or reject proposed or existing commercial arrangements, tolls, tariffs, rates or policies, including permits and regulatory approvals for new or existing projects or agreements. These decisions can directly impact our ability to operate and earn revenue. Our Liquids Pipelines, Gas Transmission and Gas Distribution and Storage assets are subject to oversight by various regulators, including the CER, the FERC, the OEB, the Ohio Commission, the Utah Commission, the Wyoming Commission, the Idaho Commission, and the North Carolina Commission. These regulators establish rates, tariffs, and tolls for our assets. Regulatory or court decisions to modify or reject rates, tariffs, tolls or commercial arrangements, including with respect to permits, tariff structures, or interpretations of existing regulations, have previously impacted our revenues and earnings and may do so again in the future.
Our Renewable Power Generation assets in Canada and the US are subject to directives, regulations, and policies of federal, provincial and state governments. These measures are variable and can change due to factors such as tax rate adjustments or changes in government, which may negatively impact our commercial arrangements. Our Renewable Power Generation assets in Europe (France, Germany and the UK) are also subject to the directives, regulations and policies established and enforced by the EU and the UK government. These measures are variable and can include price controls, tariffs, caps and demand reduction goals, all of which could adversely impact our revenues and earnings.
We are subject to changes in our tax rates, the adoption of new US, Canadian or international tax legislation or exposure to additional tax liabilities.
We are subject to taxes in the US, Canada and numerous foreign jurisdictions. Economic and political conditions may cause tax rates in various jurisdictions to change significantly. Our effective tax rates may be affected by changes in the mix of earnings in countries with differing statutory tax rates, adjustments to the valuation of deferred tax assets and liabilities, or changes in tax laws or their interpretation.
We are also subject to the examination of our tax returns and other tax matters by the US Internal Revenue Service, the Canada Revenue Agency, and other tax authorities and governmental bodies. We regularly evaluate the likelihood of adverse outcomes resulting from these examinations to determine the adequacy of our provision for taxes. There can be no assurance as to the outcome of these examinations. If our effective tax rates were to increase, particularly in the US or Canada, or if the ultimate determination of our taxes owed is for an amount in excess of amounts previously accrued, our financial condition and operating results could be materially adversely affected.
We are involved in numerous legal proceedings, the outcomes of which are uncertain, and resolutions adverse to us could adversely affect our financial results and reputation.
We are subject to numerous legal proceedings related to our business and operations, which could include climate-related regulatory action and litigation against companies in the energy industry. There is no assurance that we will not be impacted by such regulatory action, litigation, or other legal proceedings. By its nature, litigation is subject to many uncertainties, and we cannot predict the outcome of individual matters with assurance. It is reasonably possible that the final resolution of some of the matters in which we are involved or new matters could require additional expenditures, in excess of established reserves, over an extended period of time and in a range of amounts that could adversely affect our financial results or adversely affect our reputation. Refer to Part II. Item 7. Management's Discussion and Analysis of Financial Condition and Results of Operations - Legal and Other Updates for a discussion of certain legal proceedings with recent developments.
None.
ITEM 1C. CYBERSECURITY
Cybersecurity risk management, strategy and governance
Oversight of cybersecurity is integrated into the responsibilities of the Board and its committees. The Board is responsible for identifying and understanding Enbridge’s principal risks so that appropriate systems are implemented to monitor, manage and mitigate those risks. The committees of the Board have oversight over risks within their respective mandates.
The Audit, Finance and Risk Committee (AFRC) has primary oversight of cybersecurity matters, including the integrity of financial data and public disclosures, the security of the cyber landscape across data and digital, and operational and financial risk and controls. Management provides quarterly cybersecurity reports to the AFRC and the Board and also reports to the Safety and Reliability Committee, as deemed necessary, on cybersecurity issues related to safety, reliability and operations.
Each year, management prepares and provides the Board and its committees with a corporate risk assessment (CRA), which analyzes and prioritizes enterprise-wide risks, highlighting top risks and trends (including cybersecurity). The annual CRA is an integrated enterprise-wide process which engages each part of our business to assess and rank risks based on impact and probability. We strive to ensure that mitigation measures are appropriately designed, prioritized and resourced. The CRA report is reviewed by the Board committees with responsibility for the risk categories relevant to their mandate and is provided to the Board, which coordinates Enbridge's overall risk management approach. Complementary to the CRA, management prepares and provides to the Safety and Reliability Committee an annual top operational risk report that highlights the highest consequence operational risks across Enbridge and includes further detail on the risks and their treatment. This information helps inform the Board about the potential impact of top operational risks and of treatments in place to manage those risks.
Cybersecurity has been identified as a top risk, driven by the growing sophistication and frequency of attacks targeting our industry over the years, compounded by geopolitical instability and the rapid advancement of technologies leveraged by threat actors. Although we devote significant resources and security measures to prevent unwanted intrusions and to protect our systems and data, we (and our third-party vendors) have experienced, and expect to continue to experience, cyber attacks of varying degrees in the conduct of our business, including, for example, denial of service attacks. Cybersecurity risk is described in Item 1A. Risk Factors.
Enbridge’s management is responsible for the implementation of risk management strategies and monitoring performance. The technology and information services function is centralized under the Senior Vice President & Chief Information Officer (CIO). We also engage independent third parties to assess our cybersecurity program, track their recommendations, and use those to further improve the program. Reporting to the CIO is the Chief Information Security Officer who is in charge of our cybersecurity program and oversees the 24x7x365 Security Operations Center (SOC).
We conduct continuous assessments of our cybersecurity standards, perform regular tests of our ability to respond and recover, and monitor for potential threats. To further mitigate threats, we collaborate with governments and regulatory agencies and take part in external events to learn and share. Our workforce participates in regular security awareness training, including simulated phishing exercises to enhance our capabilities to identify and report suspicious phishing emails to our SOC. We continue to expand the cybersecurity training offerings to include tailored training and phishing simulations to higher-risk groups within the organization. Additionally, tailored cybersecurity training courses have been implemented for team members in operational technology and software development roles, and we have increased the frequency of phishing simulation tests.
We have a cybersecurity third-party risk management program, which is an evolving, cross-functional program to help assess and mitigate risks from third-party vendors and other service providers. We complete risk assessments for all business-identified critical and high-spend vendors and address security issues. We are proactively monitoring critical vendors using real time monitoring tools to identify vendor vulnerabilities that could lead to a breach. This is a complementary tool to the several layers of defense and protection technologies we use, the cybersecurity experts we employ, and the automated alerting and response mechanisms, in order to reduce risk to Enbridge.
Although cybersecurity risks have not materially affected us, including our business strategy, results of operations or financial condition, to date, we have experienced an increasing number of cybersecurity threats in recent years. For more information about the cybersecurity risks we face, see the risk factor entitled "Cyber attacks and other cybersecurity incidents pose significant threats to our technology systems and could materially adversely affect our business, operations, reputation or financial results." in Item 1A. Risk Factors.
ITEM 2. PROPERTIES
Descriptions of our properties and maps depicting the locations of our liquids, natural gas, and renewable power systems are included in Part I. Item 1. Business.
In general, our systems are located on land owned by others and are operated under easements and rights-of-way, licenses, leases or permits that have been granted by private landowners, Indigenous communities, public authorities, railways or public utilities. Our liquids pipeline systems have pumping stations, tanks, terminals and certain other facilities that are located on land that is owned by us and/or used by us under easements, licenses, leases or permits. Our natural gas transmission pipeline systems have natural gas compressor stations, the vast majority of which are located on land that is owned by us. Our gas distribution pipeline systems have other assets including natural gas compressor stations, regulator stations, and meter and valve stations, some of which are located on land that is owned by the utilities. The remainder of these stations and other assets, such as storage wells, and underground gas storage fields, are operated by the utilities under the rights granted by easements, leases or permits. Additionally, our renewable energy plants are located on land that is used by us under leases or owned by us. The remainder of these compressor stations and other assets, such as meter and valve stations, and underground gas storage fields, are used by us under easements, leases or permits.
Titles to Enbridge owned properties or affiliate entities may be subject to encumbrances in some cases. We believe that none of these burdens should materially detract from the value of these properties or materially interfere with their use in the operation of our business.
ITEM 3. LEGAL PROCEEDINGS
We are involved in various legal and regulatory actions and proceedings which arise in the ordinary course of business. While the final outcome of such actions and proceedings cannot be predicted with certainty, management believes that the resolution of such actions and proceedings will not have a material impact on our consolidated financial position or results of operations. Refer to Part II. Item 7. Management's Discussion and Analysis of Financial Condition and Results of Operations - Legal and Other Updates for discussion of certain legal proceedings with recent developments.
SEC regulations require the disclosure of any proceeding under environmental laws to which a governmental authority is a party unless the registrant reasonably believes it will not result in monetary sanctions over a certain threshold. Given the size of our operations, we have elected to use a threshold of US$1 million for the purposes of determining proceedings requiring disclosure.
On December 22, 2025, Enbridge and the Minnesota Department of Natural Resources (DNR) reached an agreement to address an aquifer breach related to construction of the Line 3 Replacement Project at the Moose Lake Site in Aitkin County, Minnesota. The agreement closes the DNR’s enforcement related to the Moose Lake Site. Under the agreement, Enbridge agreed to fund $100,000 for ongoing DNR monitoring of the Moose Lake Site and pay a penalty of $300,000. Enbridge also agreed to fund $1.2 million in Supplemental Environmental Projects to benefit area natural resources and establish financial assurance in the amount of $1.2 million for mitigation of any potential future impacts related to the area resources. From the fall of 2022 through 2023, Enbridge performed corrective actions designed to stabilize the site under DNR oversight. Enbridge and the DNR will continue to monitor the Moose Lake Site and no additional action is anticipated.
ITEM 4. MINE SAFETY DISCLOSURES
Not applicable.
PART II
ITEM 5. MARKET FOR REGISTRANT'S COMMON EQUITY, RELATED STOCKHOLDER MATTERS AND ISSUER PURCHASES OF EQUITY SECURITIES
Common Stock
Enbridge common stock is traded on the TSX and NYSE under the symbol ENB. As at February 6, 2026, there were 69,906 registered shareholders of record of Enbridge common stock. A substantially greater number of holders of Enbridge common stock are beneficial holders, whose shares are held by banks, brokers and other financial institutions.
Securities Authorized for Issuance Under Equity Compensation Plans
The information required by this Item will be contained in our Form 10-K/A, which will be filed no later than 120 days after December 31, 2025.
Recent Sales of Unregistered Equity Securities
None.
Issuer Purchases of Equity Securities
None.
Total Shareholder Return
The following graph reflects the comparative changes in the value from January 1, 2021 through December 31, 2025 of $100 invested in (1) Enbridge Inc.’s common shares traded on the TSX, (2) the S&P/TSX Composite index, (3) the S&P 500 index, (4) our US peer group (comprising, by stock symbols, CNP, D, DTE, DUK, EPD, ET, KMI, NEE, NI, OKE, PAA, PCG, SO, SRE and WMB) and (5) our Canadian peer group (comprising, by stock symbols, CU, FTS, PPL and TRP). The amounts included in the table were calculated assuming the reinvestment of dividends.
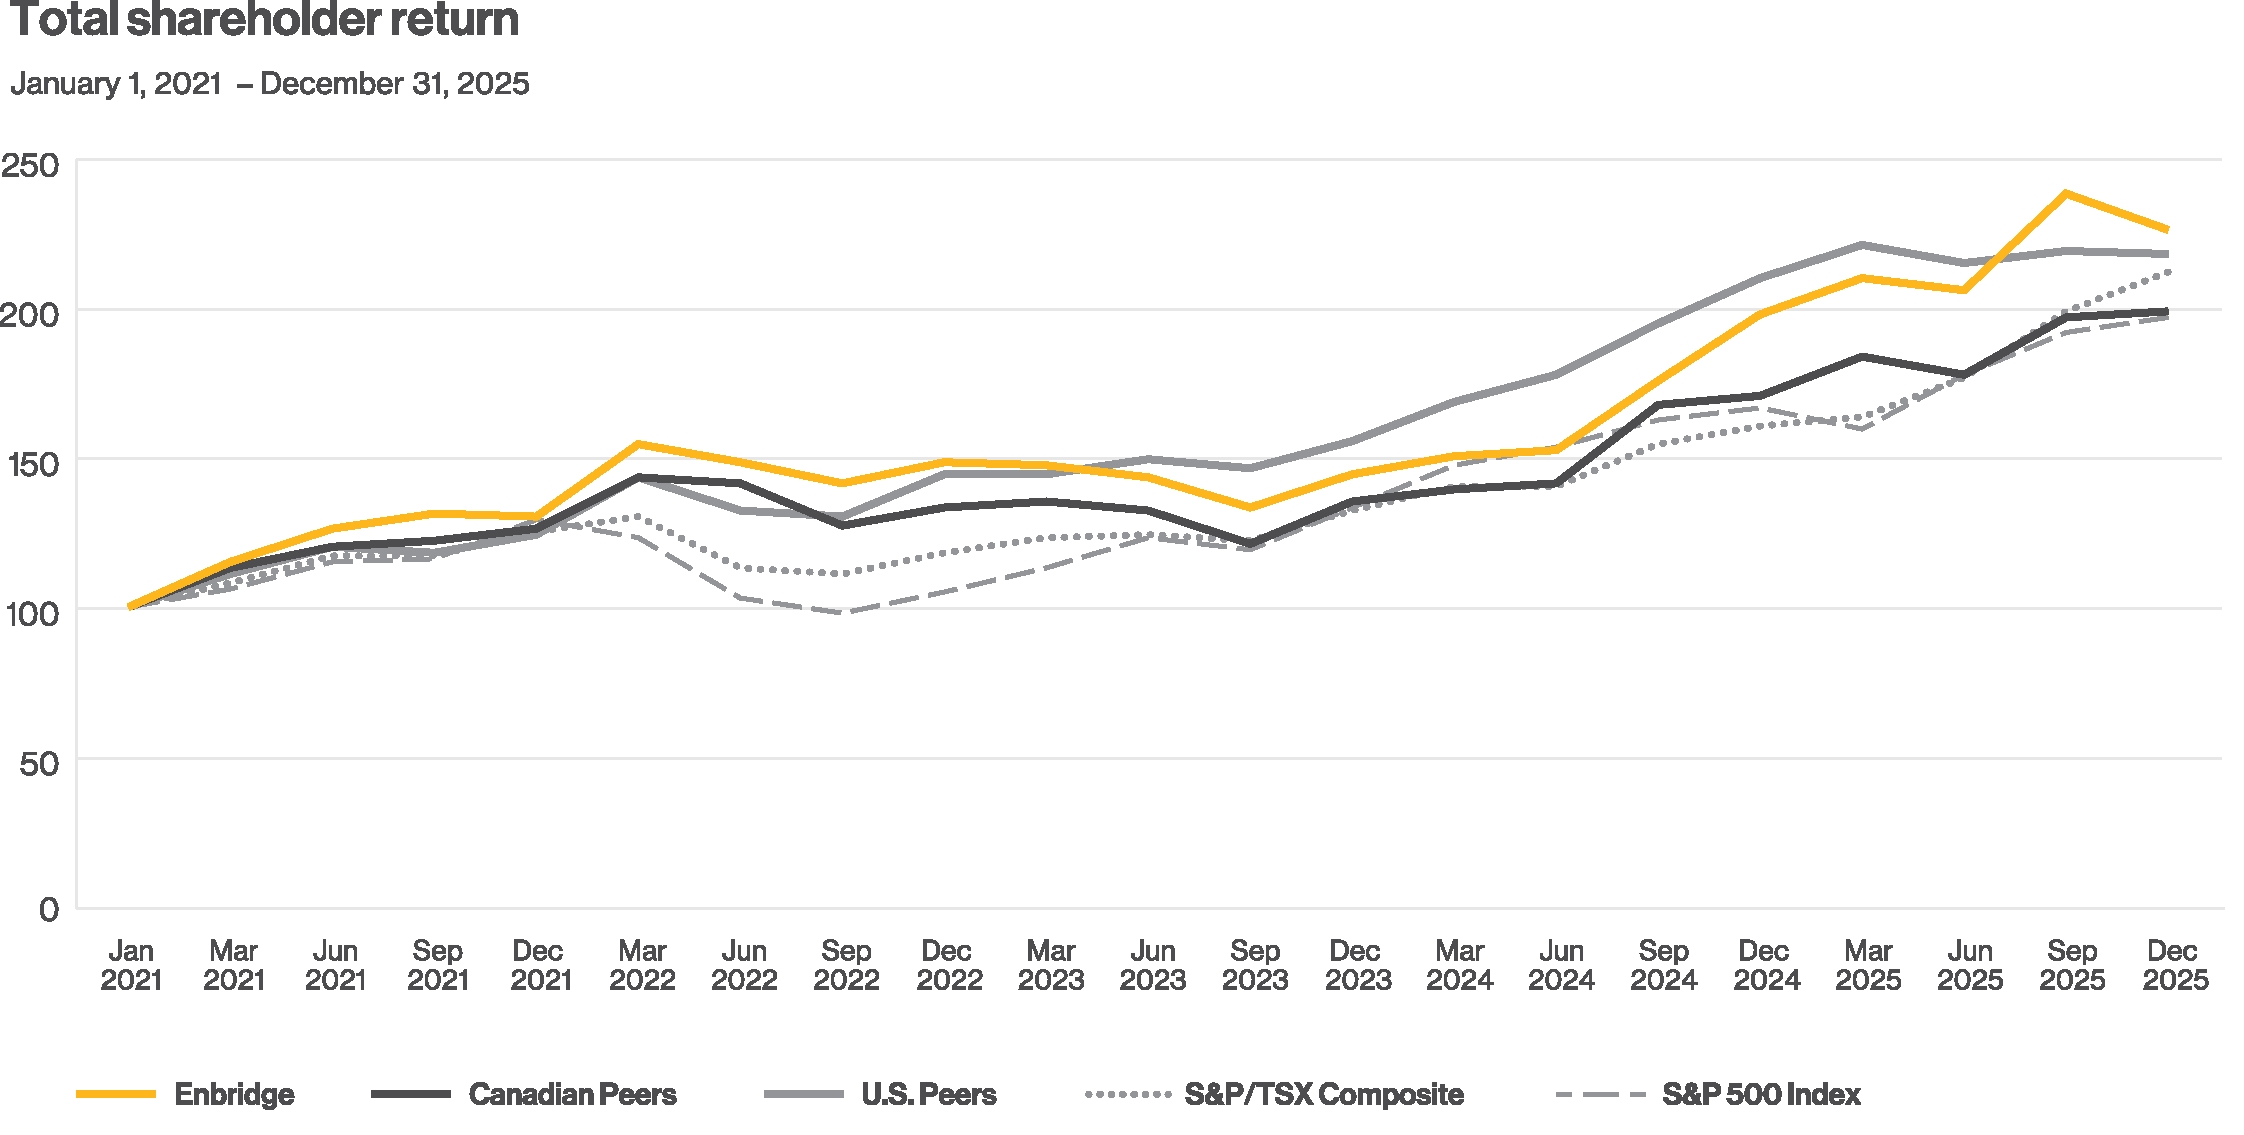
|
|
|
|
|
|
|
|
|
|
|
|
|
|
|
|
|
|
|
|
January 1, |
|
December 31, |
|
|
|
2021 |
|
|
2021 |
|
|
2022 |
|
|
2023 |
|
|
2024 |
|
|
2025 |
|
Enbridge Inc. |
|
100.00 |
|
|
130.25 |
|
|
148.35 |
|
|
143.67 |
|
|
196.91 |
|
|
224.54 |
|
S&P/TSX Composite |
|
100.00 |
|
|
125.09 |
|
|
117.78 |
|
|
131.62 |
|
|
160.12 |
|
|
210.85 |
|
S&P 500 Index |
|
100.00 |
|
|
128.71 |
|
|
105.40 |
|
|
133.10 |
|
|
166.40 |
|
|
196.16 |
|
US Peers1 |
|
100.00 |
|
|
123.75 |
|
|
143.84 |
|
|
155.31 |
|
|
208.77 |
|
|
216.84 |
|
Canadian Peers |
|
100.00 |
|
|
125.60 |
|
|
132.96 |
|
|
134.91 |
|
|
169.66 |
|
|
198.07 |
|
1 For the purpose of the graph, it was assumed that CAD:US dollar conversion ratio remained at 1:1 for the years presented.
ITEM 6. [Reserved]
None.
ITEM 7. MANAGEMENT'S DISCUSSION AND ANALYSIS OF FINANCIAL CONDITION AND RESULTS OF OPERATIONS
INTRODUCTION
The following discussion and analysis of our financial condition and results of operations is based on and should be read in conjunction with "Forward-Looking Information" and "Non-GAAP and Other Financial Measures", Part I. Item 1A. Risk Factors and our consolidated financial statements and the accompanying notes included in Part II. Item 8. Financial Statements and Supplementary Data of this Annual Report on Form 10-K.
This section of our Annual Report on Form 10-K discusses 2025 and 2024 items and year-over-year comparisons between 2025 and 2024. For discussion of 2023 items and year-over-year comparisons between 2024 and 2023, refer to Part II. Item 7. Management's Discussion and Analysis of Financial Condition and Results of Operations of our Annual Report on Form 10-K for the year ended December 31, 2024.
RECENT DEVELOPMENTS
LIQUIDS PIPELINES INVESTMENT
Mainline System Capital Investment
In 2025, we announced plans to invest up to US$1.3 billion in our Mainline System through 2028. These investments are expected to earn a return through the Mainline Tolling Settlement and will be focused on extending the service life of the underlying assets, as well as further enhancing reliability and efficiency given continuing demands on the system.
NONCONTROLLING INTEREST INVESTMENT
BC Pipeline System
On July 2, 2025, Stonlasec8 Indigenous Investments Limited Partnership (the First Nations Partnership), an entity representing 38 First Nations in British Columbia (BC), invested approximately $736 million in our Westcoast Energy Inc. BC natural gas pipeline system.
As at December 31, 2025, we own 87.53% of the BC Pipeline system, which is included in our Gas Transmission segment, and continue to manage and operate the pipeline system. The First Nations Partnership owns the remaining 12.47% interest.
GAS TRANSMISSION RATE PROCEEDINGS
Algonquin
Algonquin Gas Transmission, LLC (Algonquin) filed a rate case on May 30, 2024 and a settlement in principle was reached with customers in December 2024. A Stipulation and Agreement was approved by the Federal Energy Regulatory Commission (FERC) on April 25, 2025 with rates effective December 1, 2024.
Maritimes & Northeast
Maritimes & Northeast (M&N) United States (US) filed a rate case on May 30, 2024 and a settlement in principle was reached with customers in December 2024. A Stipulation and Agreement was approved by the FERC on April 25, 2025 with rates effective January 1, 2025.
The toll settlement agreement for M&N Canada expired in December 2025. M&N Canada reached a toll settlement with shippers for the effective period from January 1, 2026 to December 31, 2027. On December 15, 2025, M&N Canada filed the 2026–2027 toll settlement agreement with the Canada Energy Regulator (CER) for review and approval. A CER decision is expected in the first quarter of 2026.
East Tennessee
East Tennessee Natural Gas, LLC (East Tennessee) filed a rate case on April 29, 2025. On May 29, 2025, the FERC issued an order accepting and suspending tariff records, subject to refund, conditions, and establishing hearing procedures. In compliance with the order, East Tennessee made a filing to implement the rates to be effective November 1, 2025, subject to refund. Settlement discussions with shippers commenced in the third quarter of 2025.
Vector
Vector Pipeline L.P. (Vector) filed a rate case on May 30, 2025. On June 30, 2025, the FERC issued an order accepting and suspending tariff records filed in this rate case, and establishing hearing procedures. In compliance with the order, Vector placed the proposed rates into effect on July 1, 2025. Additionally, on July 1, 2025, the chief administrative law judge issued an order consolidating Vector’s outstanding review of rates initiated by the FERC in 2024 with Vector’s May 30, 2025 rate case filing. In February 2026, Vector reached a settlement in principle with all active participants that resolves all issues in the consolidated rate case, which will be filed for FERC approval in the first half of 2026. If approved, settlement rates will be effective April 1, 2026.
GAS DISTRIBUTION AND STORAGE RATE APPLICATIONS
Enbridge Gas Ontario
In October 2022, Enbridge Gas Inc. (Enbridge Gas Ontario) filed its application with the Ontario Energy Board (OEB) to establish a 2024–2028 Incentive Regulation (IR) rate setting framework:
•Phase 1 of the application established 2024 base rates on a cost-of-service basis.
•Phase 2 established a price cap incentive rate-setting (Price Cap IR) mechanism for 2025–2028.
•Phase 3 addresses cost allocation and the harmonization of rates, rate classes and services. Completion of Phase 3 is expected in 2026.
Phase 1
In December 2023, the OEB issued its decision on Phase 1. Enbridge Gas Ontario continues to appeal through Ontario courts the OEB's Phase 1 findings on depreciation, equity thickness and undepreciated capital, with hearing dates scheduled in 2026.
Phase 2
Through a November 2024 decision on the Phase 2 partial settlement proposal, and a May 2025 decision on outstanding issues, the OEB approved a Price Cap IR mechanism for 2025–2028 rates. The mechanism includes an earnings sharing mechanism which requires earnings in excess of 100 basis points over the allowed return on equity (ROE) to be shared equally with customers, and 90% of any earnings in excess of 300 basis points over the allowed ROE. Rates effective January 1, 2025 and January 1, 2026, were set using the approved Price Cap IR mechanism.
Generic Cost of Capital Proceeding
In March 2025, the OEB released its decision in the generic cost of capital proceeding. The OEB determined that Enbridge Gas Ontario's equity thickness would remain at 38% as approved in the Phase 1 decision. The OEB also revised the formula for calculating ROE by reducing flotation costs by 25 basis points. The new formula will be applicable to Enbridge Gas Ontario at its next rebasing expected in 2029. Until then, rates will continue to reflect the 2024 ROE of 9.21%.
Enbridge Gas Ohio
In October 2023, Enbridge Gas Ohio filed its first base rates application with the Ohio Commission since 2007, proposing a base rate annual revenue increase to be effective January 2025. The base rate increase was proposed to recover the significant investment in distribution infrastructure for the benefit of Ohio customers, including an ROE of 10.40%.
In June 2025, the Ohio Commission ordered a decrease to annual revenue of US$26.3 million, utilizing an ROE of 9.79%, and an increase to the equity thickness to 51.9%. The order also resulted in disallowances of $330 million (US$240 million), including regulatory pension assets of $280 million (US$204 million) and other disallowances of $50 million (US$36 million) which were recognized for the year ended December 31, 2025.
The order authorized the continuation of the Pipeline Infrastructure Replacement (PIR) and Capital Expenditure Programs (CEP) through 2028, with 3% increases of capital expenditures under the PIR per year. Assets placed in service accrue a carrying cost at the cost of long-term debt approved in the most recent rate case until incorporated into rates via annual filings.
In July 2025, Enbridge Gas Ohio filed a rehearing application for certain aspects of the order. The Ohio Commission corrected errors in its order addressing the rehearing application, resulting in a reduction of the original annual revenue decrease to US$14.3 million. Updated rates were effective on November 1, 2025. On December 12, 2025, Enbridge Gas Ohio filed a notice of appeal with the Ohio Supreme Court, focusing on the Ohio Commission's treatment of the pension fund and capitalized incentive-compensation costs.
In December 2025, Enbridge Gas Ohio filed a base rate case application proposing an annual revenue increase of US$163 million, subject to update and adjustments, to be effective in early 2027. The base rate increase was proposed to recover Enbridge Gas Ohio's investment in distribution infrastructure and other costs to serve, including operating expenses and debt servicing costs.
Enbridge Gas North Carolina
In April 2025, Enbridge Gas North Carolina filed its first rates application since 2021 with the North Carolina Utilities Commission, proposing the recovery of costs to deliver natural gas to customers and investments in infrastructure to support service reliability and customer growth.
In September 2025, a settlement agreement was filed reflecting an annual revenue increase of US$33 million. The settlement was approved by the North Carolina Utilities Commission on December 9, 2025, with updated rates effective November 1, 2025.
The settlement includes a Major Projects Rider for the Moriah Energy Center LNG facility and the T-15 Reliability Project, as a standalone cost recovery mechanism between general base rate cases.
Enbridge Gas Utah
In May 2025, Enbridge Gas Utah filed its first rates application since 2022 with the Utah Public Service Commission, proposing the recovery of costs to deliver natural gas to customers and investments in infrastructure to support service reliability and customer growth.
In September 2025, Enbridge Gas Utah filed a settlement and final order approving an annual revenue increase of US$61 million was issued on December 24, 2025 with updated rates effective January 1, 2026.
FINANCING UPDATE
We completed long-term debt issuances totaling $4.6 billion and US$4.7 billion during the year ended December 31, 2025.
On February 25, 2025, Enbridge Pipelines Inc. redeemed below par all of the outstanding $100 million 4.10% medium-term notes that carried an original maturity date in July 2112.
On July 28, 2025, Enbridge Energy Partners, L.P. (EEP) redeemed at par all of the outstanding US$500 million 5.88% senior notes that carried an original maturity date in October 2025.
During our annual renewal process, we renewed and extended approximately $22.1 billion of our credit facilities with maturities ranging from 2027–2030.
Our 2025 financing activities have provided significant liquidity that we expect will enable us to fund our current portfolio of capital projects and acquisitions without requiring access to the capital markets for the next 12 months, should market access be restricted or pricing be unattractive. Refer to Liquidity and Capital Resources.
As at December 31, 2025, after adjusting for the impact of floating-to-fixed interest rate swap hedges, approximately 9% of our total debt is exposed to floating rates. Refer to Part II. Item 8. Financial Statements and Supplementary Data - Note 23 - Risk Management and Financial Instruments for more information on our interest rate hedging program.
RESULTS OF OPERATIONS
|
|
|
|
|
|
|
|
|
|
Year ended December 31, |
2025 |
|
2024 |
|
2023 |
|
(millions of Canadian dollars, except per share amounts) |
|
|
|
|
|
|
Segment earnings/(loss) before interest, income taxes and depreciation and amortization1 |
|
|
|
|
|
|
Liquids Pipelines |
|
9,396 |
|
|
9,531 |
|
|
9,383 |
|
Gas Transmission |
|
5,491 |
|
|
5,656 |
|
|
4,264 |
|
Gas Distribution and Storage |
|
3,809 |
|
|
2,869 |
|
|
1,592 |
|
Renewable Power Generation |
|
620 |
|
|
733 |
|
|
149 |
|
Eliminations and Other |
|
1,161 |
|
|
(1,904 |
) |
|
916 |
|
Earnings before interest, income taxes and depreciation and amortization1 |
|
20,477 |
|
|
16,885 |
|
|
16,304 |
|
Depreciation and amortization |
|
(5,661 |
) |
|
(5,167 |
) |
|
(4,613 |
) |
Interest expense |
|
(5,023 |
) |
|
(4,419 |
) |
|
(3,812 |
) |
Income tax expense |
|
(2,004 |
) |
|
(1,668 |
) |
|
(1,821 |
) |
(Earnings)/loss attributable to noncontrolling interests and redeemable noncontrolling interest |
|
(298 |
) |
|
(190 |
) |
|
133 |
|
Preference share dividends |
|
(419 |
) |
|
(388 |
) |
|
(352 |
) |
Earnings attributable to common shareholders |
|
7,072 |
|
|
5,053 |
|
|
5,839 |
|
Earnings per common share attributable to common shareholders |
|
3.23 |
|
|
2.34 |
|
|
2.84 |
|
Diluted earnings per common share attributable to common shareholders |
|
3.22 |
|
|
2.34 |
|
|
2.84 |
|
1Non-GAAP financial measure. Refer to Non-GAAP and Other Financial Measures.
EARNINGS ATTRIBUTABLE TO COMMON SHAREHOLDERS
Year ended December 31, 2025, compared with year ended December 31, 2024
Earnings attributable to common shareholders was positively impacted by $1.5 billion due to certain infrequent or other non-operating factors, primarily explained by the following:
•a non-cash, net unrealized derivative fair value gain of $1.3 billion ($999 million after-tax) in 2025, compared with a net unrealized loss of $2.1 billion ($1.6 billion after-tax) in 2024, reflecting changes in the mark-to-market value of derivative financial instruments used to manage foreign exchange, interest rate and commodity price risks; and
•equity earnings of $87 million ($65 million after-tax) from our investment in DCP Midstream, LP (DCP), as a result of DCP's gain on disposition from certain pipeline assets; partially offset by
•the absence in 2025 of a gain on sale of $1.1 billion ($765 million after-tax) on the disposition of our interests in the Alliance Pipeline and Aux Sable Liquid Products LP, Aux Sable Midstream LLC, and Aux Sable Canada LP (Aux Sable);
•an impairment of $330 million ($261 million after-tax) of certain rate-regulated assets related to pension and other disallowances as a result of the Ohio Commission's June 2025 order related to Enbridge Gas Ohio's rate case; and
•an impairment loss of $240 million ($176 million after-tax) of certain non-core Liquids Pipelines assets.
The non-cash, unrealized derivative fair value gains and losses discussed above generally arise as a result of our comprehensive economic hedging program to mitigate foreign exchange, interest rate and commodity price risks. This program creates volatility in reported short-term earnings through the recognition of unrealized non-cash gains and losses on derivative instruments used to hedge these risks. Over the long-term, we believe our hedging program supports the reliable cash flows and dividend growth upon which our investor value proposition is based.
After taking into consideration the factors above, the remaining $541 million increase in earnings attributable to common shareholders is primarily explained by the following significant business factors:
•full year of contributions from the US Gas Utilities in our Gas Distribution and Storage segment;
•positive earnings impact in Enbridge Gas Ontario due to colder weather in 2025 compared to a negative impact in 2024, higher storage optimization and pricing, and higher distribution margin and customer growth in our Gas Distribution and Storage segment;
•higher contributions from our Gas Transmission segment primarily due to the recognition of increased revenue attributable to Algonquin and Texas Eastern rate case settlements, favorable contracting on our US Gas Transmission assets, and contributions from the Texas Eastern Venice Extension project;
•higher contributions from Mainline System (net of sharing) due to higher demand, higher tolls, and lower power costs; and
•lower income tax expense, excluding tax on infrequent or non-operating factors discussed above, mainly driven by lower effective US tax rate primarily from the impact of higher investment tax credits.
The factors above were partially offset by:
•higher interest expense primarily due to higher average debt principal outstanding;
•higher depreciation and amortization expense mainly driven by full year ownership of the US Gas Utilities;
•lower contributions from the Gulf Coast and Mid-Continent System in our Liquids Pipelines segment primarily due to lower spot volumes on the Flanagan South Pipeline;
•lower contributions from our Gas Transmission segment due to the sale of our interests in Alliance Pipeline and Aux Sable in April 2024 and lower earnings from our Tomorrow RNG renewable natural gas facilities due to lower Renewable Identification Number (RIN) pricing and production volumes;
•the decrease in 2025 of equity earnings from Fox Squirrel Solar investment tax credits in our Renewable Power Generation segment; and
•the absence in 2025 of interest income from cash pre-funding related to Enbridge's acquisitions of the East Ohio Gas Company (EOG), Questar Gas Company (Questar) and its related Wexpro companies (Wexpro), and Public Service Company of North Carolina, Incorporated (PSNC) (together, the Acquisitions) in Eliminations and Other.
REVENUES
We generate revenues from three primary sources: transportation and other services, gas distribution sales and commodity sales.
Transportation and other services revenues of $20.2 billion, $19.7 billion and $19.2 billion, for the years ended December 31, 2025, 2024 and 2023, respectively, were earned from our crude oil and natural gas pipeline transportation businesses and also include power generation revenues from our portfolio of renewable and power generation assets. For our transportation assets operating under market-based arrangements, revenues are driven by volumes transported and the corresponding tolls for transportation services. For assets operating under take-or-pay contracts, revenues reflect the terms of the underlying contract for services or capacity. For rate-regulated assets, revenues are charged in accordance with tolls established by the regulator and, in most cost-of-service based arrangements, are reflective of our cost to provide the service plus a regulator-approved rate of return.
Gas distribution sales revenues of $9.8 billion, $6.8 billion and $5.4 billion for the years ended December 31, 2025, 2024 and 2023, respectively, were recognized in a manner consistent with the underlying rate-setting mechanism mandated by the regulator. Revenues generated by the gas distribution businesses are primarily driven by volumes delivered, which vary with weather and customer composition and utilization, as well as regulator-approved rates. The cost of natural gas is passed through rates to customers and does not ultimately impact earnings due to its flow-through nature.
Commodity sales revenues of $35.2 billion, $27.0 billion and $19.0 billion for the years ended December 31, 2025, 2024 and 2023, respectively, were generated primarily through our crude oil marketing, natural gas and power marketing businesses. This includes the purchase and sale of crude oil, natural gas, power and NGL to generate a margin, which is typically a small fraction of gross revenue. Sales revenue generated from these operations reflect activity levels which are driven by differences in commodity prices between locations, grades and points in time, rather than on absolute prices. Commodity sales revenues also include revenue generated from our Tomorrow RNG business. Any residual commodity margin risk is closely monitored and managed. Revenues from these operations depend on activity levels, which vary from year-to-year depending on market conditions and commodity prices.
Our revenues also include changes in unrealized derivative fair value gains and losses related to foreign exchange and commodity price contracts used to manage exposures from movements in foreign exchange rates and commodity prices. The mark-to-market accounting creates volatility and impacts the comparability of revenues in the short-term, but we believe over the long-term, the economic hedging program supports reliable cash flows.
BUSINESS SEGMENTS
LIQUIDS PIPELINES
|
|
|
|
|
|
|
|
|
|
Year ended December 31, |
2025 |
|
2024 |
|
2023 |
|
(millions of Canadian dollars) |
|
|
|
|
|
|
Earnings before interest, income taxes and depreciation and amortization |
|
9,396 |
|
|
9,531 |
|
|
9,383 |
|
Year ended December 31, 2025 compared with year ended December 31, 2024
EBITDA was negatively impacted by $191 million primarily due to impairment losses of $240 million related to certain non-core assets.
After taking into consideration the above, the remaining $56 million increase is primarily explained by the following significant business factors:
•higher Mainline System contributions (net of sharing) as a result of higher demand, annual escalators and surcharge effective July 1, 2024, and lower power costs from operational efficiencies and lower mill rates;
•higher contributions from Line 9 due to higher volumes; and
•the favorable effect of translating US dollar earnings at a higher average exchange rate in 2025, compared to 2024; partially offset by
•lower contributions from the Gulf Coast and Mid-Continent System primarily due to lower spot volumes on the Flanagan South Pipeline.
GAS TRANSMISSION
|
|
|
|
|
|
|
|
|
|
Year ended December 31, |
2025 |
|
2024 |
|
2023 |
|
(millions of Canadian dollars) |
|
|
|
|
|
|
Earnings before interest, income taxes and depreciation and amortization |
|
5,491 |
|
|
5,656 |
|
|
4,264 |
|
Year ended December 31, 2025 compared with year ended December 31, 2024
EBITDA was negatively impacted by $780 million due to certain infrequent or other non-operating factors primarily explained by the following:
•the absence in 2025 of a gain on sale of $1.1 billion on the disposition of interests in the Alliance Pipeline and Aux Sable; partially offset by
•the absence in 2025 of an asset impairment loss of $137 million related to the Big Sandy Pipeline;
•equity earnings of $87 million from our investment in DCP, as a result of DCP's gain on disposition from certain pipeline assets; and
•a net positive adjustment of $32 million to the gas inventory at Aitken Creek in 2025, compared to a net negative adjustment of $33 million in 2024.
After taking into consideration the factors above, the remaining $615 million increase is primarily explained by the following significant business factors:
•the recognition of increased revenue attributable to the Algonquin and Texas Eastern rate case settlements;
•contributions from the Texas Eastern Venice Extension project since service commencement in late 2024;
•higher revenues at Aitken Creek due to favorable storage spreads;
•favorable contracting on our US Gas Transmission assets;
•higher earnings from our investment in DCP;
•contributions from the acquisition of equity interests in the Whistler Parent JV, Delaware Basin Residue, LLC (DBR), and Matterhorn Express, LLC in the second and fourth quarters of 2024, and the second quarter of 2025, respectively; and
•the favorable effect of translating US dollar earnings at a higher average exchange rate in 2025, compared to 2024; partially offset by
•the absence of contributions from Alliance Pipeline and Aux Sable due to the sale of our interests in these investments in April 2024; and
•lower earnings at Tomorrow RNG primarily due to lower RIN pricing and production volumes.
GAS DISTRIBUTION AND STORAGE
|
|
|
|
|
|
|
|
|
|
Year ended December 31, |
2025 |
|
2024 |
|
2023 |
|
(millions of Canadian dollars) |
|
|
|
|
|
|
Earnings before interest, income taxes and depreciation and amortization |
|
3,809 |
|
|
2,869 |
|
|
1,592 |
|
Year ended December 31, 2025 compared with year ended December 31, 2024
EBITDA was negatively impacted by $330 million due to an impairment of certain rate-regulated assets related to pension and other disallowances as a result of the Ohio Commission's June 2025 order related to Enbridge Gas Ohio's rate case.
After taking into consideration the above, the remaining $1.3 billion increase is primarily explained by the following significant business factors:
•full year of contributions from the US Gas Utilities;
•when compared with the normal forecast embedded in rates, the positive impact of weather on EBITDA for Enbridge Gas Ontario was approximately $30 million (net of sharing) in 2025 compared to a negative impact of approximately $129 million in 2024;
•higher distribution margin resulting from increases in rates and customer base at Enbridge Gas Ontario;
•higher storage optimization and pricing at Enbridge Gas Ontario; and
•higher distribution margin resulting from increased revenue requirement from recovery of capital investments at Enbridge Gas Ohio and higher base rates at Enbridge Gas North Carolina.
RENEWABLE POWER GENERATION
|
|
|
|
|
|
|
|
|
|
Year ended December 31, |
2025 |
|
2024 |
|
2023 |
|
(millions of Canadian dollars) |
|
|
|
|
|
|
Earnings before interest, income taxes and depreciation and amortization |
|
620 |
|
|
733 |
|
|
149 |
|
Year ended December 31, 2025 compared with year ended December 31, 2024
EBITDA was positively impacted by $35 million due to certain infrequent or non-operating factors, primarily explained by:
•the absence in 2025 of an impairment loss of $55 million related to certain assets; partially offset by
•a realized loss of $139 million, partially offset by a non-cash, net unrealized gain of $112 million in 2025, compared with a net unrealized loss of $13 million in 2024, reflecting changes in the mark-to-market value of derivative financial instruments used to manage foreign exchange and commodity price risks.
After taking into consideration the factors above, the remaining $148 million decrease is primarily explained by the decrease in 2025 of equity earnings related to Fox Squirrel Solar investment tax credits.
ELIMINATIONS AND OTHER
|
|
|
|
|
|
|
|
|
|
Year ended December 31, |
2025 |
|
2024 |
|
2023 |
|
(millions of Canadian dollars) |
|
|
|
|
|
|
Earnings/(loss) before interest, income taxes and depreciation and amortization |
|
1,161 |
|
|
(1,904 |
) |
|
916 |
|
Eliminations and Other includes operating and administrative costs that are not allocated to business segments, the impact of foreign exchange hedge settlements and the activities of our wholly-owned captive insurance subsidiary. Eliminations and Other also includes our natural gas and power marketing businesses and the impact of new business development activities and corporate investments.
Year ended December 31, 2025 compared with year ended December 31, 2024
EBITDA was positively impacted by $3.5 billion due to certain infrequent or non-operating factors, primarily explained by:
•a non-cash, net unrealized gain of $1.2 billion in 2025, compared with a net unrealized loss of $2.2 billion in 2024, reflecting changes in the mark-to-market value of derivative financial instruments used to manage foreign exchange and commodity price risks; and
•the absence in 2025 of $105 million severance costs as a result of a workforce reduction in February 2024.
After taking into consideration the non-operating factors above, we saw a $461 million decrease in EBITDA that is primarily explained by:
•higher realized foreign exchange losses on hedge settlements in 2025; and
•the absence in 2025 of interest income from cash pre-funding related to the Acquisitions.
GROWTH PROJECTS - COMMERCIALLY SECURED PROJECTS
The following table summarizes the status of our material commercially secured projects, organized by business segment:
|
|
|
|
|
|
|
|
|
|
|
Enbridge's
Ownership
Interest |
Estimated
Capital
Cost1 |
Expenditures
to Date2 |
Status2 |
Expected
In-Service
Date |
|
(Canadian dollars, unless stated otherwise) |
|
|
|
|
|
LIQUIDS PIPELINES |
|
|
|
|
|
|
|
Mainline Optimization |
|
|
|
Pre- |
|
|
1. |
Phase 1 |
100% |
US$1.4 billion |
US$39 million |
construction |
2027 |
|
|
|
|
|
No significant |
|
|
|
|
Southern Illinois |
|
|
expenditures to |
Pre- |
|
|
2. |
Connector |
100%3 |
US$0.5 billion |
date |
construction |
2028 |
|
|
|
|
|
No significant |
|
|
|
|
|
|
|
expenditures to |
Pre- |
|
|
3. |
Pelican CO2 Hub |
50% |
US$0.3 billion |
date |
construction |
2029 |
|
GAS TRANSMISSION |
|
|
|
|
|
|
|
Texas Eastern |
|
|
|
|
|
|
4. |
Modernization |
100% |
US$0.4 billion |
US$273 million |
Various stages |
2025 - 2026 |
|
|
T-North Expansion |
|
|
|
Under |
|
|
5. |
(Aspen Point) |
100%4 |
$1.2 billion |
$788 million |
construction |
2026 |
|
6. |
Tennessee Ridgeline Expansion |
100% |
US$1.4 billion |
US$506 million |
Under construction |
2026 |
|
7. |
Woodfibre LNG5 |
30% |
US$2.9 billion |
US$1.5 billion |
Under construction |
2027 |
|
8. |
T-South Expansion (Sunrise) |
100%4 |
$4.0 billion |
$540 million |
Pre-construction |
2028 |
|
|
T-North Expansion |
|
|
|
Pre- |
|
|
9. |
(Birch Grove) |
100%4 |
$0.4 billion |
$23 million |
construction |
2028 |
|
10. |
Canyon System Pipelines |
100% |
US$1.0 billion |
US$154 million |
Pre-construction |
|
2029 |
|
|
Algonquin Gas |
|
|
No significant |
|
|
|
|
Transmission |
|
|
expenditures to |
Pre- |
|
|
11. |
Enhancement |
100% |
US$0.3 billion |
date |
construction |
|
2029 |
|
|
|
|
|
No significant |
|
|
|
|
USGC Storage Growth |
|
|
expenditures to |
Pre- |
|
|
12. |
Program |
100% |
US$0.5 billion |
date |
construction |
2028 - 2033 |
|
GAS DISTRIBUTION AND STORAGE |
|
|
|
|
|
13. |
Moriah Energy Center6 |
100% |
US$0.6 billion |
US$368 million |
Under construction |
2027 |
|
14. |
T-15 Reliability Project6,7 |
100% |
US$0.7 billion |
US$98 million |
Pre-construction |
2027 - 2028 |
|
RENEWABLE POWER GENERATION |
|
|
|
|
|
15. |
Sequoia Solar |
100% |
US$1.1 billion |
US$796 million |
Various stages |
2025 - 2026 |
|
16. |
Clear Fork Solar |
100% |
US$0.9 billion |
US$198 million |
Under construction |
|
2027 |
|
17. |
Easter |
100% |
US$0.4 billion |
US$104 million |
Pre-construction |
2026 - 2027 |
|
|
|
|
|
No significant |
|
|
|
|
|
|
|
expenditures to |
Pre- |
|
|
18. |
Cowboy Phase 1 |
100% |
US$1.2 billion |
date |
construction |
|
2027 |
|
|
Courseulles (Calvados) |
|
$1.0 billion |
$444 million |
Under |
|
|
19. |
Offshore Wind8 |
21.7% |
(€0.6 billion) |
(€303 million) |
construction |
2027 |
|
1These amounts are estimates and are subject to upward or downward adjustment based on various factors. Where appropriate, the amounts reflect our share of joint venture projects.
2Expenditures to date and status of the project are determined as at December 31, 2025.
3Includes amounts for the construction of the Southern Illinois Connector Pipeline, which is expected to be 50% jointly-owned with Energy Transfer, costs to upgrade the Energy Transfer Crude Oil Pipeline, in which we have a 27.6% ownership interest, as well as amounts fully attributable to Enbridge.
4Our redeemable noncontrolling interest holder, the First Nations Partnership, will have the opportunity to participate in designated capital programs once they have been completed or substantially completed. As a result, our ownership interest in the program(s) may change in future periods.
5Our expected investment is approximately US$2.3 billion, with the remainder financed through non-recourse project level debt.
6Previously approved projects that were acquired by Enbridge through the acquisition of PSNC.
7Includes approved capital costs for the second phase of the project which involves installation of additional compression to add capacity and is expected to go into service in 2028.
8Our investment is approximately $0.3 billion, with the remainder financed through non-recourse project level debt.
Risks related to the development and completion of growth projects are described in Part I. Item 1A. Risk Factors.
LIQUIDS PIPELINES
•Mainline Optimization Phase 1 - The Mainline Optimization Phase 1 project is intended to support growing customer demand and long-term production growth in Western Canada, increasing deliveries of Canadian heavy oil to key refining markets in the US Midwest and US Gulf Coast (USGC). The project is expected to add 150 and 100 thousand barrels per day of capacity to our Mainline System and Flanagan South Pipeline (FSP), respectively, through increased horsepower, upstream optimizations and terminal enhancements. The FSP expansion is underpinned by long-term take-or-pay contracts providing full-path service from Edmonton, Alberta to Houston, Texas. In addition, the majority of existing customers also elected to extend their existing FSP full-path contracts beyond 2040. The project is expected to enter service in 2027.
•Southern Illinois Connector - The construction of a new 24-inch pipeline from Wood River to Patoka, Illinois, connecting the Platte Pipeline to our jointly-owned Energy Transfer Crude Oil Pipeline. In addition, the project includes new pump stations to provide incremental capacity to the Platte system. Incremental volumes are secured under long-term take-or-pay agreements with investment grade customers. The project has an expected in-service date in 2028.
•Pelican CO2 Hub - A 50/50 joint venture with a subsidiary of Occidental Petroleum Corporation (Oxy) to design, construct and operate a carbon dioxide transportation and sequestration hub in the Louisiana Mississippi River corridor. Oxy will manage the sequestration portions of the project, while Enbridge will manage the pipeline. Development is supported by a long-term take-or-pay offtake agreement with an investment grade counterparty and the facility is expected to enter service in 2029.
GAS TRANSMISSION
•Texas Eastern Modernization - The modernization of compression facilities in Pennsylvania and New Jersey to increase safety and reliability, as well as to reduce associated greenhouse gas emissions at multiple sites on our Texas Eastern system. The program has entered into service in stages over a period of years beginning in 2024, with all phases expected to be completed in 2026.
•T-North Expansion (Aspen Point) - An expansion of our BC Pipeline system in northern BC that includes pipeline looping, additional compressor units and ancillary station modifications to support 535 million cubic feet per day (mmcf/d) of additional capacity. This expansion is expected to serve growing regional demand for natural gas and potential West Coast LNG exports and is underpinned by a cost-of-service commercial model with a target in-service date in 2026.
•Tennessee Ridgeline Expansion - An expansion of the East Tennessee Natural Gas system that will provide additional natural gas for the Tennessee Valley Authority (TVA) to support the replacement of an existing coal-fired power plant as TVA continues to transition its power generation mix towards lower-carbon fuels. The proposed scope includes the installation of approximately 125 miles of 30-inch pipeline looping, one electric-powered compressor station and an 8-megawatt (MW) behind-the-meter solar array. We expect the project to enter service in 2026.
•Woodfibre LNG Project - Liquefaction and floating storage facilities in Squamish, BC, and an expansion of our BC Pipeline system, the construction of which is executed by our partner. Enbridge holds a noncontrolling equity interest in the project which is expected to be placed into service in 2027.
Enbridge and its partners have agreed to updated commercial terms for the Woodfibre LNG Project. The preferred return will be set closer to completion of construction, de-risking Enbridge's return on capital, and our expected share of capital costs was updated in 2025.
•T-South Expansion (Sunrise) - An expansion of our BC Pipeline system's T-South section that includes pipeline looping, additional compressor units and ancillary station modifications to support 300 mmcf/d of additional capacity. This expansion is driven primarily by an anticipated shortfall in capacity to deliver gas to the BC Lower Mainland and US Pacific Northwest markets following the commencement of deliveries to the Woodfibre LNG Project. The project is underpinned by a cost-of-service commercial model and is expected to be placed into service in 2028. In 2026, the CER recommended the project for approval to the Government of Canada's Governor in Council.
•T-North Expansion (Birch Grove) - An expansion of our BC Pipeline system in northern BC that includes pipeline looping and ancillary station modifications to support 178 mmcf/d of additional capacity. The project is underpinned by a cost-of-service commercial model with a target in-service date in 2028. This expansion is driven by the need for natural gas producers in northeastern BC to access markets for their growing production, mainly from the prolific Montney formation. We expect to file our regulatory application for this project with the CER in the second quarter of 2026.
•Canyon System Pipelines - The construction of two new offshore pipelines and additional crude oil and natural gas pipeline extensions to support bp's Kaskida and Tiber offshore developments in the USGC. This will include a 24/26-inch oil pipeline connecting to Shell Pipeline Company LP's Green Canyon 19 Platform and a 12-inch gas pipeline connecting to our existing Magnolia Gas Gathering Pipeline. The project is expected to enter service in 2029.
•Algonquin Gas Transmission Enhancement - An enhancement of our Algonquin Pipeline to serve incremental demand across the northeastern US. The project is anticipated to enhance supply reliability and improve affordability by reducing winter price volatility for customers. We expect the project to enter service in 2029.
•USGC Storage Growth Program - An expansion of our Egan Hub and Moss Bluff natural gas storage facilities in the USGC, to provide 16 billion cubic feet (Bcf) and 7 Bcf of new site capacity, respectively. Egan Hub will be expanded over two phases, with each phase expected to enter service in 2030 and 2033, respectively. The expansion of our Moss Bluff facility is expected to enter service in 2028. These projects are expected to improve site injection and withdrawal rates, optimizing existing capacity, and to offer storage capacity to USGC LNG facilities during periods of high demand.
GAS DISTRIBUTION AND STORAGE
•Moriah Energy Center - The construction of an LNG facility in Person County, North Carolina with 2 bcf of storage capacity. The facility is expected to enhance system reliability and to address supply constraints due to customer growth, and will be designed with trucking capabilities to support other LNG facilities. The project has an expected in-service date in 2027.
•T-15 Reliability Project - Includes the construction of 45 miles of transmission pipe, a compressor station, and associated metering and regulation facilities in Rockingham, Caswell and Person counties in North Carolina. The project has a two-phased completion in 2027 and 2028.
RENEWABLE POWER GENERATION
•Sequoia Solar - An 815 MW solar farm located approximately 150 miles west of Dallas, Texas. The first phase of the project was completed in the fourth quarter of 2025, with the second phase expected to enter service in late 2026. Project revenues are underpinned by long-term fixed price power purchase agreements (PPA).
•Clear Fork Solar - A 600 MW solar farm located near San Antonio, Texas, fully contracted under a long-term offtake agreement. The project has an expected in-service date in 2027.
•Easter - A 152 MW onshore wind project near Amarillo, Texas, fully contracted under a long-term offtake agreement. The two-phased project is expected to achieve completion in 2026 and 2027.
•Cowboy Phase 1 - A 365 MW solar farm and an on-site battery energy storage system (BESS), both located near Cheyenne, Wyoming. Renewable power generated by this project is fully contracted under a long-term offtake agreement and BESS capacity is contracted through a long-term fixed-price battery tolling agreement. BESS is currently approved for 135 MW, expandable up to 200 MW with further utility review and approval. Both components of the project are expected to fully enter service in 2027.
•Courseulles (Calvados) Offshore Wind - An offshore wind project located off the northwest coast of France that is expected to generate approximately 448 MW of power. The project has an expected in-service date in 2027 and revenues are underpinned by a 20-year fixed price PPA.
OTHER ANNOUNCED PROJECTS UNDER DEVELOPMENT
LIQUIDS PIPELINES
Mainline Optimization Phase 2
On November 7, 2025, we announced the Mainline Optimization Phase 2 (MLO2) project. MLO2 is expected to provide an additional 250 thousand barrels per day of egress from the Western Canadian Sedimentary Basin, leveraging capacity on our existing assets including the Dakota Access Pipeline, in which we have a 27.6% interest, Line 26 and the Chicap Pipeline system. The project is expected to enter service in 2028 and is subject to finalizing commercial agreements, securing the necessary environmental and regulatory approvals, and meeting investment criteria.
LIQUIDITY AND CAPITAL RESOURCES
The maintenance of financial strength and flexibility is fundamental to our growth strategy, particularly in light of the significant number and size of capital projects currently secured or under development. Access to timely funding from capital markets could be limited by factors outside our control, including but not limited to, financial market volatility resulting from economic and political events both inside and outside North America. To mitigate such risks, we actively manage financial plans and strategies to help ensure we maintain sufficient liquidity to meet routine operating and future capital requirements.
In the near term, we generally expect to utilize cash from operations together with commercial paper issuances and/or credit facility draws and the proceeds of capital market offerings to fund liabilities as they become due, finance capital expenditures and acquisitions and fund debt retirements. We target to maintain sufficient liquidity through securement of committed credit facilities with a diversified group of banks and financial institutions to enable us to fund all anticipated requirements for approximately one year without accessing the capital markets.
Material contractual obligations arising in the normal course of business primarily consist of long-term contracts, annual debt maturities and related interest obligations, rights-of-way and leases. See Part II. Item 8. Financial Statements and Supplementary Data - Note 17 - Debt, Note 26 - Leases and Note 30 - Commitments and Contingencies for amounts outstanding at December 31, 2025.
Long-term contracts are contracts that we have signed for the purchase of services, pipe and other materials totaling $14.0 billion which are expected to be paid over the next five years. Long-term contracts primarily consist of the following purchase obligations: firm capacity payments for natural gas and crude oil transportation and storage contracts, natural gas purchase commitments and power commitments.
Our financing plan is regularly updated to reflect evolving capital requirements and financial market conditions and identifies a variety of potential sources of debt and equity funding alternatives.
CAPITAL MARKET ACCESS
We enable access to capital markets, subject to market conditions, through maintenance of shelf prospectuses that allow for issuances of long-term debt, equity and other forms of long-term capital when market conditions are attractive. In accordance with our funding plan, we completed the following long-term debt issuances totaling $4.6 billion and US$4.7 billion in 2025.
|
|
|
|
|
Entity |
Issuance date |
Type of issuance |
Amount |
(millions of Canadian dollars, unless otherwise stated) |
|
|
|
Enbridge Inc. |
February 2025 |
Floating rate notes |
$400 |
Enbridge Inc. |
February 2025 |
Medium-term notes |
$2,400 |
Enbridge Inc. |
June 2025 |
Senior notes |
US$2,250 |
Enbridge Inc. |
September 2025 |
Fixed-to-fixed subordinated notes |
$1,000 |
Enbridge Inc. |
November 2025 |
Senior notes |
US$1,500 |
Enbridge Gas Inc. |
September 2025 |
Medium-term notes |
$800 |
The East Ohio Gas Company |
June 2025 |
Senior notes |
US$500 |
The East Ohio Gas Company |
December 2025 |
Senior notes |
US$400 |
Credit Facilities and Liquidity
To ensure ongoing liquidity and to mitigate the risk of capital market disruption, we maintain access to funds through committed bank credit facilities and actively manage our bank funding sources to optimize pricing and other terms. The following table provides details of our committed credit facilities as at December 31, 2025:
|
|
|
|
|
|
|
|
|
|
|
|
Maturity1 |
Total
Facility |
|
Draws2 |
|
Available |
|
(millions of Canadian dollars) |
|
|
|
|
|
|
|
Enbridge Inc. |
2027-2049 |
|
8,033 |
|
|
6,488 |
|
|
1,545 |
|
Enbridge (U.S.) Inc. |
2027-2030 |
|
10,307 |
|
|
4,636 |
|
|
5,671 |
|
Enbridge Pipelines Inc. |
2027 |
|
2,000 |
|
|
1,024 |
|
|
976 |
|
Enbridge Gas Inc. |
2027 |
|
2,500 |
|
|
1,030 |
|
|
1,470 |
|
Total committed credit facilities |
|
|
22,840 |
|
|
13,178 |
|
|
9,662 |
|
1Maturity date is inclusive of the one-year term out option for certain credit facilities.
2Includes facility draws and commercial paper issuances that are back-stopped by credit facilities.
In July 2025, we renewed approximately $8.8 billion of our 364-day extendible credit facilities, extending the maturity dates to July 2027, which includes a one-year term out provision from July 2026. We also renewed approximately $7.8 billion of our five-year credit facilities, extending the maturity dates to July 2030. Further, we extended the maturity dates of our three-year credit facilities to July 2028.
In July 2025, Enbridge Gas Ontario and Enbridge Pipelines Inc. extended the maturity dates of their $2.5 billion and $2.0 billion 364-day extendible credit facilities, respectively, to July 2027, which includes a one-year term out provision from July 2026.
In addition to the committed credit facilities noted above, we maintain $1.6 billion of uncommitted demand letter of credit facilities, of which $932 million was unutilized as at December 31, 2025. As at December 31, 2024, we had $1.4 billion of uncommitted demand letter of credit facilities, of which $931 million was unutilized.
As at December 31, 2025, our net available liquidity totaled $10.8 billion (December 31, 2024 - $14.4 billion), consisting of available credit facilities of $9.7 billion (December 31, 2024 - $12.6 billion) and unrestricted cash and cash equivalents of $1.1 billion (December 31, 2024 - $1.8 billion) as reported in the Consolidated Statements of Financial Position.
Our credit facility agreements and term debt indentures include standard events of default and covenant provisions whereby accelerated repayment and/or termination of the agreements may result if we were to default on payment or violate certain covenants. As at December 31, 2025, we were in compliance with all such debt covenant provisions.
Cash flow growth, ready access to liquidity from diversified sources and a stable business model have enabled us to manage our credit profile. We actively monitor and manage key financial metrics with the objective of sustaining investment grade credit ratings from the major credit rating agencies and ongoing access to bank funding and term debt capital on attractive terms. Key measures of financial strength that are closely managed include the ability to service debt obligations from operating cash flow and the ratio of debt to EBITDA.
There are no material restrictions on our cash. Total restricted cash of $83 million, as reported in the Consolidated Statements of Financial Position, primarily includes reinsurance security, cash collateral, future pipeline abandonment costs collected and held in trust, amounts received in respect of specific shipper commitments and capital projects. Cash and cash equivalents held by certain subsidiaries may not be readily accessible for alternative uses by us.
Excluding current maturities of long-term debt, as at December 31, 2025 and December 31, 2024, we had negative working capital positions of $2.8 billion and $2.9 billion, respectively. In both 2025 and 2024, the major contributing factors to the negative working capital position were the current liabilities associated with our growth capital program. To address this negative working capital position, we maintain significant liquidity in the form of committed credit facilities and other sources as previously discussed, which enable the funding of liabilities as they become due.
SOURCES AND USES OF CASH
|
|
|
|
|
|
|
|
|
|
Year ended December 31, |
2025 |
|
2024 |
|
|
2023 |
|
(millions of Canadian dollars) |
|
|
|
|
|
|
Operating activities |
|
12,270 |
|
|
12,600 |
|
|
14,201 |
|
Investing activities |
|
(10,503 |
) |
|
(20,363 |
) |
|
(6,043 |
) |
Financing activities |
|
(2,400 |
) |
|
3,544 |
|
|
(2,864 |
) |
Effect of translation of foreign denominated cash and cash equivalents and restricted cash |
|
(47 |
) |
|
234 |
|
|
(216 |
) |
Net change in cash and cash equivalents and restricted cash |
|
(680 |
) |
|
(3,985 |
) |
|
5,078 |
|
Significant sources and uses of cash for the years ended December 31, 2025 and 2024 are summarized below:
Operating Activities
Typically, the primary factors impacting cash provided by operating activities year-over-year include changes in our operating assets and liabilities in the normal course due to various factors, including the impact of fluctuations in commodity prices and activity levels on working capital within our business segments, the timing of tax payments, as well as timing of cash receipts and payments generally. Refer to Part II. Item 8. Financial Statements and Supplementary Data - Note 28 - Changes in Operating Assets and Liabilities. Cash provided by operating activities is also impacted by changes in earnings and certain infrequent or other non-operating factors, as discussed in Results of Operations, as well as Distributions from equity investments.
Investing Activities
Cash used in investing activities primarily relates to capital expenditures to execute our capital program, which is further described in Growth Projects - Commercially Secured Projects. The timing of project approval, construction and in-service dates impacts the timing of cash requirements. Cash used in investing activities is also impacted by acquisitions, dispositions, and changes in contributions to, and distributions from, our equity investments.
A summary of cash additions to property, plant and equipment for the years ended December 31, 2025, 2024 and 2023 is set out below:
|
|
|
|
|
|
|
|
|
|
Year ended December 31, |
2025 |
|
2024 |
|
2023 |
|
(millions of Canadian dollars) |
|
|
|
|
|
|
Liquids Pipelines |
|
1,358 |
|
|
1,157 |
|
|
1,158 |
|
Gas Transmission |
|
3,176 |
|
|
2,453 |
|
|
1,890 |
|
Gas Distribution and Storage |
|
3,318 |
|
|
2,381 |
|
|
1,451 |
|
Renewable Power Generation |
|
947 |
|
|
661 |
|
|
100 |
|
Eliminations and Other |
|
174 |
|
|
59 |
|
|
55 |
|
Total capital expenditures |
|
8,973 |
|
|
6,711 |
|
|
4,654 |
|
2025
The decrease in cash used in investing activities primarily resulted from the following factors:
•the absence in 2025 of the acquisitions of EOG, Questar, PSNC, and Tomorrow RNG;
•the absence in 2025 of the acquisitions of equity interests in the Whistler Parent JV and DBR and contributions to our Fox Squirrel Solar investment; partially offset by
•the absence in 2025 of proceeds received from the disposition of our interests in the Alliance Pipeline, Aux Sable, and NRGreen Power Limited Partnership (NRGreen); and
•a full year of capital expenditures from EOG, Questar, and PSNC, and higher capital expenditures from growth projects in our Gas Transmission and Renewable Power Generation segments.
2024
The increase in cash used in investing activities primarily resulted from the following factors:
•the acquisitions of EOG, Questar, PSNC, and Tomorrow RNG in 2024;
•increased capital expenditures from the acquisitions of EOG, Questar and PSNC and from growth projects in our Gas Transmission segment; and
•the acquisition of an equity interest in the Whistler Parent JV and DBR and contributions to our Fox Squirrel Solar investment in 2024; partially offset by
•proceeds received from the dispositions of our interests in the Alliance Pipeline, Aux Sable, and NRGreen in 2024.
Financing Activities
Cash used in financing activities primarily relates to issuances and repayments of external debt, as well as transactions with our common and preference shareholders relating to dividends, share issuances, and share redemptions. Cash used in financing activities is also impacted by changes in distributions to, and contributions from, noncontrolling interests and redeemable noncontrolling interest.
2025
The increase in cash used in financing activities primarily resulted from the following factors:
•lower commercial paper and credit facility draws in 2025 compared to 2024; and
•the absence in 2025 of the at-the-market program, which resulted in the issuance of 51,298,629 common shares for aggregate net proceeds of $2.5 billion in 2024; partially offset by
•higher long-term debt issuances in 2025 compared to 2024, and
•proceeds of $712 million, net of transaction costs, received from the First Nations Partnership for their noncontrolling interest investment in our BC pipeline system.
2024
The increase in cash provided by financing activities primarily resulted from the following factors:
•net commercial paper and credit facility draws in 2024 compared to net repayments in 2023;
•the at-the-market program, which resulted in the issuance of 51,298,629 common shares for aggregate net proceeds of $2.5 billion in 2024; and
•lower net repayments of short-term borrowings in 2024 compared to 2023; partially offset by
•higher long-term debt repayments and lower long-term debt issuances in 2024 compared to 2023;
•the absence in 2024 of the public offering of common shares, which closed on September 8, 2023 for gross proceeds of $4.6 billion; and
•increased common share dividend payments primarily due to the increase in our common share dividend rate and an increase in the number of common shares outstanding.
OFF-BALANCE SHEET ARRANGEMENTS
We enter into guarantee arrangements in the normal course of business to facilitate commercial transactions with third parties and can include financial guarantees, stand-by letters of credit, debt guarantees, surety bonds and indemnifications. Please see Part II. Item 8. Financial Statements and Supplementary Data - Note 31 - Guarantees for further discussion of guarantee arrangements.
We do not have material off-balance sheet financing entities or structures, except for guarantee arrangements and financings entered into for our equity investments. For additional information on these commitments, please refer to Part II. Item 8. Financial Statements and Supplementary Data - Note 30 - Commitments and Contingencies and Note 12 - Variable Interest Entities.
We do not have material off-balance sheet arrangements that have or are reasonably likely to have a current or future effect on our financial condition, revenues or expenses, results of operations, liquidity, capital expenditures or capital resources.
OUTSTANDING PREFERENCE SHARES
Characteristics of our outstanding preference shares are as follows:
|
|
|
|
|
|
|
Dividend Rate |
Dividend1 |
Per Share Base Redemption Value2,3 |
Redemption and Conversion Option Date2,3 |
Right to Convert Into3,4 |
(Canadian dollars unless otherwise stated) |
|
|
|
|
|
Preference Shares, Series A |
5.50% |
$1.37500 |
$25 |
— |
— |
Preference Shares, Series B |
5.20% |
$1.30050 |
$25 |
June 1, 2027 |
Series C |
Preference Shares, Series D |
5.41% |
$1.35300 |
$25 |
March 1, 2028 |
Series E |
Preference Shares, Series F |
5.54% |
$1.38450 |
$25 |
June 1, 2028 |
Series G |
Preference Shares, Series G5 |
4.84% |
$1.21000 |
$25 |
June 1, 2028 |
Series F |
Preference Shares, Series H |
6.11% |
$1.52800 |
$25 |
September 1, 2028 |
Series I |
Preference Shares, Series I6 |
4.45% |
$1.11250 |
$25 |
September 1, 2028 |
Series H |
Preference Shares, Series L |
5.86% |
US$1.46448 |
US$25 |
September 1, 2027 |
Series M |
Preference Shares, Series N |
6.70% |
$1.67400 |
$25 |
December 1, 2028 |
Series O |
Preference Shares, Series P |
5.92% |
$1.47950 |
$25 |
March 1, 2029 |
Series Q |
Preference Shares, Series R |
6.31% |
$1.57850 |
$25 |
June 1, 2029 |
Series S |
Preference Shares, Series 1 |
6.70% |
US$1.67593 |
US$25 |
June 1, 2028 |
Series 2 |
Preference Shares, Series 3 |
5.29% |
$1.32200 |
$25 |
September 1, 2029 |
Series 4 |
Preference Shares, Series 47 |
4.71% |
$1.17750 |
$25 |
September 1, 2029 |
Series 3 |
Preference Shares, Series 5 |
6.68% |
US$1.67075 |
US$25 |
March 1, 2029 |
Series 6 |
Preference Shares, Series 7 |
5.99% |
$1.49700 |
$25 |
March 1, 2029 |
Series 8 |
Preference Shares, Series 9 |
5.67% |
$1.41800 |
$25 |
December 1, 2029 |
Series 10 |
Preference Shares, Series 118 |
5.48% |
$1.36925 |
$25 |
March 1, 2030 |
Series 12 |
Preference Shares, Series 139 |
5.40% |
$1.34875 |
$25 |
June 1, 2030 |
Series 14 |
Preference Shares, Series 1510 |
5.63% |
$1.40650 |
$25 |
September 1, 2030 |
Series 16 |
Preference Shares, Series 19 |
6.21% |
$1.55300 |
$25 |
March 1, 2028 |
Series 20 |
1The holder is entitled to receive a fixed cumulative quarterly preferential dividend, as declared by the Board of Directors. With the exception of Preference Shares, Series A, such fixed dividend rate resets every five years beginning on the initial Redemption and Conversion Option Date. Preference Shares, Series G, Series I and Series 4 contain a feature where the dividend rate resets on a quarterly basis. The Preference Shares, Series 19 contain a feature where the fixed dividend rate, when reset every five years, will not be less than 4.90%. No other series of preference shares has this feature.
2Preference Shares, Series A may be redeemed any time at our option. For all other series of preference shares, we may at our option, redeem all or a portion of the outstanding preference shares for the Per Share Base Redemption Value plus all accrued and unpaid dividends on the Redemption Option Date and on every fifth anniversary thereafter.
3The holder will have the right, subject to certain conditions, to convert their shares into Cumulative Redeemable Preference Shares of a specified series on a one-for-one basis on the Conversion Option Date and every fifth anniversary thereafter at an ascribed issue price equal to the Per Share Base Redemption Value.
4With the exception of Preference Shares, Series A, after the Redemption and Conversion Option Date, holders may elect to receive quarterly floating rate cumulative dividends per share at a rate equal to: $25 x (number of days in quarter/number of days in year) x three-month Government of Canada treasury bill rate + 2.4% (Series C), 2.4% (Series E), 2.5% (Series G), 2.1% (Series I), 2.7% (Series O), 2.5% (Series Q), 2.5% (Series S), 2.4% (Series 4), 2.6% (Series 8), 2.7% (Series 10), 2.6% (Series 12), 2.7% (Series 14), 2.7% (Series 16), or 3.2% (Series 20); or US$25 x (number of days in quarter/number of days in year) x three-month US Government treasury bill rate + 3.2% (Series M), 3.1% (Series 2), or 2.8% (Series 6).
5The quarterly dividend per share paid on Preference Shares, Series G was decreased to $0.29836 from $0.32411 on December 1, 2025 due to reset on a quarterly basis.
6The quarterly dividend per share paid on Preference Shares, Series I was decreased to $0.27432 from $0.29980 on December 1, 2025 due to reset on a quarterly basis.
7The quarterly dividend per share paid on Preference Shares, Series 4 was decreased to $0.29034 from $0.31601 on December 1, 2025 due to reset on a quarterly basis.
8The quarterly dividend per share paid on Preference Shares, Series 11 was increased to $0.34231 from $0.24613 on March 1, 2025,due to the reset of the annual dividend on March 1, 2025.
9The quarterly dividend per share paid on Preference Shares, Series 13 was increased to $0.33719 from $0.19019 on June 1, 2025 due to the reset of the annual dividend on June 1, 2025.
10 The quarterly dividend per share paid on Preference Shares, Series 15 was increased to $0.35163 from $0.18644 on September 1, 2025 due to the reset of the annual dividend on September 1, 2025.
DIVIDENDS
We have paid common share dividends in every year since we became a publicly traded company in 1953. In December 2025, we announced a 3% increase in our quarterly dividend to $0.9700 per common share, or $3.88 annualized, effective with the dividend payable on March 1, 2026, thereby declaring a dividend increase for 31 straight years.
For the years ended December 31, 2025 and 2024, total dividends paid in cash were $8.2 billion and $7.9 billion, respectively, which are reflected in Cash Flows from Financing Activities in the Consolidated Statements of Cash Flows.
On December 2, 2025, our Board of Directors declared the following quarterly dividends. All dividends are payable on March 1, 2026 to shareholders of record on February 17, 2026.
|
|
|
Dividend per share |
Common Shares1 |
$0.9700 |
Preference Shares, Series A |
$0.34375 |
Preference Shares, Series B |
$0.32513 |
Preference Shares, Series D |
$0.33825 |
Preference Shares, Series F |
$0.34613 |
Preference Shares, Series G2 |
$0.29836 |
Preference Shares, Series H |
$0.38200 |
Preference Shares, Series I3 |
$0.27432 |
Preference Shares, Series L |
US$0.36612 |
Preference Shares, Series N |
$0.41850 |
Preference Shares, Series P |
$0.36988 |
Preference Shares, Series R |
$0.39463 |
Preference Shares, Series 1 |
US$0.41898 |
Preference Shares, Series 3 |
$0.33050 |
Preference Shares, Series 44 |
$0.29034 |
Preference Shares, Series 5 |
US$0.41769 |
Preference Shares, Series 7 |
$0.37425 |
Preference Shares, Series 9 |
$0.35450 |
Preference Shares, Series 11 |
$0.34231 |
Preference Shares, Series 13 |
$0.33719 |
Preference Shares, Series 15 |
$0.35163 |
Preference Shares, Series 19 |
$0.38825 |
1The quarterly dividend per common share was increased 3% to $0.9700 from $0.9425, effective March 1, 2026.
2The quarterly dividend per share paid on Preference Shares, Series G was decreased to $0.29836 from $0.32411 on December 1, 2025 due to reset on a quarterly basis.
3The quarterly dividend per share paid on Preference Shares, Series I was decreased to $0.27432 from $0.29980 on December 1, 2025 due to reset on a quarterly basis.
4The quarterly dividend per share paid on Preference Shares, Series 4 was decreased to $0.29034 from $0.31601 on December 1, 2025 due to reset on a quarterly basis.
SUMMARIZED FINANCIAL INFORMATION
On January 22, 2019, Enbridge entered into supplemental indentures with its wholly-owned subsidiaries, Spectra Energy Partners, LP (SEP) and EEP (together, the Partnerships), pursuant to which Enbridge fully and unconditionally guaranteed, on a senior unsecured basis, the payment obligations of the Partnerships with respect to the outstanding series of notes issued under the respective indentures of the Partnerships. Concurrently, the Partnerships entered into a subsidiary guarantee agreement pursuant to which they fully and unconditionally guaranteed, on a senior unsecured basis, the outstanding series of senior notes of Enbridge. The Partnerships have also entered into supplemental indentures with Enbridge pursuant to which the Partnerships have issued full and unconditional guarantees, on a senior unsecured basis, of senior notes issued by Enbridge subsequent to January 22, 2019. As a result of the guarantees, holders of any of the outstanding guaranteed notes of the Partnerships (the Guaranteed Partnership Notes) are in the same position with respect to the net assets, income and cash flows of Enbridge as holders of Enbridge's outstanding guaranteed notes (the Guaranteed Enbridge Notes), and vice versa. Other than the Partnerships, Enbridge subsidiaries (including the subsidiaries of the Partnerships, collectively, the Subsidiary Non-Guarantors), are not parties to the subsidiary guarantee agreement and have not otherwise guaranteed any of Enbridge's outstanding series of senior notes.
Consenting SEP notes and EEP notes under Guarantees
|
|
SEP Notes1 |
EEP Notes2 |
3.38% Senior Notes due 2026 |
5.95% Notes due 2033 |
5.95% Senior Notes due 2043 |
6.30% Notes due 2034 |
4.50% Senior Notes due 2045 |
7.50% Notes due 2038 |
|
5.50% Notes due 2040 |
|
7.38% Notes due 2045 |
1As at December 31, 2025, the aggregate outstanding principal amount of SEP notes was approximately US$1.7 billion.
2As at December 31, 2025, the aggregate outstanding principal amount of EEP notes was approximately US$1.9 billion.
Enbridge Notes under Guarantees
|
|
USD Denominated1 |
CAD Denominated2 |
1.60% Senior Notes due 2026 |
3.20% Senior Notes due 2027 |
5.90% Senior Notes due 2026 |
5.70% Senior Notes due 2027 |
4.25% Senior Notes due 2026 |
3.55% Senior Notes due 2028 |
5.25% Senior Notes due 2027 |
4.90% Senior Notes due 2028 |
3.70% Senior Notes due 2027 |
6.10% Senior Notes due 2028 |
4.60% Senior Notes due 2028 |
Floating Rate Senior Notes due 2028 |
6.00% Senior Notes due 2028 |
2.99% Senior Notes due 2029 |
4.20% Senior Notes due 2028 |
4.21% Senior Notes due 2030 |
5.30% Senior Notes due 2029 |
3.90% Senior Notes due 2030 |
3.13% Senior Notes due 2029 |
7.22% Senior Notes due 2030 |
4.90% Senior Notes due 2030 |
7.20% Senior Notes due 2032 |
6.20% Senior Notes due 2030 |
6.10% Sustainability-Linked Senior Notes due 2032 |
4.50% Senior Notes due 2031 |
5.36% Sustainability-Linked Senior Notes due 2033 |
5.70% Sustainability-Linked Senior Notes due 2033 |
3.10% Sustainability-Linked Senior Notes due 2033 |
2.50% Sustainability-Linked Senior Notes due 2033 |
4.73% Senior Notes due 2034 |
5.63% Senior Notes due 2034 |
4.56% Senior Notes due 2035 |
5.55% Senior Notes due 2035 |
5.57% Senior Notes due 2035 |
5.20% Senior Notes due 2035 |
5.75% Senior Notes due 2039 |
4.50% Senior Notes due 2044 |
5.12% Senior Notes due 2040 |
5.50% Senior Notes due 2046 |
4.24% Senior Notes due 2042 |
4.00% Senior Notes due 2049 |
4.57% Senior Notes due 2044 |
3.40% Senior Notes due 2051 |
4.87% Senior Notes due 2044 |
6.70% Senior Notes due 2053 |
4.10% Senior Notes due 2051 |
5.95% Senior Notes due 2054 |
6.51% Senior Notes due 2052 |
|
5.76% Senior Notes due 2053 |
|
5.32% Senior Notes due 2054 |
|
4.56% Senior Notes due 2064 |
1As at December 31, 2025, the aggregate outstanding principal amount of the Enbridge US dollar-denominated notes was approximately US$19.8 billion.
2As at December 31, 2025, the aggregate outstanding principal amount of the Enbridge Canadian dollar-denominated notes was approximately $$14.5 billion.
Rule 3-10 of the US SEC Regulation S-X provides an exemption from the reporting requirements of the Exchange Act for fully consolidated subsidiary issuers of guaranteed securities and subsidiary guarantors and allows for summarized financial information in lieu of filing separate financial statements for each of the Partnerships.
The following Summarized Combined Statement of Earnings and Summarized Combined Statements of Financial Position combines the balances of SEP, EEP, and Enbridge.
Summarized Combined Statement of Earnings
|
|
|
|
Year ended December 31, |
2025 |
|
(millions of Canadian dollars) |
|
|
Operating loss |
|
(63 |
) |
Earnings |
|
2,826 |
|
Earnings attributable to common shareholders |
|
2,407 |
|
Summarized Combined Statements of Financial Position
|
|
|
|
|
|
|
December 31, |
2025 |
|
2024 |
|
(millions of Canadian dollars) |
|
|
|
|
Cash and cash equivalents |
|
391 |
|
|
2,000 |
|
Accounts receivable from affiliates |
|
3,873 |
|
|
3,901 |
|
Short-term loans receivable from affiliates |
|
6,239 |
|
|
3,892 |
|
Other current assets |
|
467 |
|
|
499 |
|
Long-term loans receivable from affiliates |
|
46,858 |
|
|
54,416 |
|
Other long-term assets |
|
1,994 |
|
|
2,139 |
|
Accounts payable to affiliates |
|
2,079 |
|
|
2,252 |
|
Short-term loans payable to affiliates |
|
2,082 |
|
|
1,188 |
|
Trade payables and accrued liabilities |
|
537 |
|
|
661 |
|
Other current liabilities |
|
6,990 |
|
|
8,047 |
|
Long-term loans payable to affiliates |
|
34,488 |
|
|
36,576 |
|
Other long-term liabilities |
|
67,004 |
|
|
62,642 |
|
The Guaranteed Enbridge Notes and the Guaranteed Partnership Notes are structurally subordinated to the indebtedness of the Subsidiary Non-Guarantors in respect of the assets of those Subsidiary Non-Guarantors.
Under US bankruptcy law and comparable provisions of state fraudulent transfer laws, a guarantee can be voided, or claims may be subordinated to all other debts of that guarantor if, among other things, the guarantor, at the time the indebtedness evidenced by its guarantee or, in some states, when payments become due under the guarantee:
•received less than reasonably equivalent value or fair consideration for the incurrence of the guarantee and was insolvent or rendered insolvent by reason of such incurrence;
•was engaged in a business or transaction for which the guarantor’s remaining assets constituted unreasonably small capital; or
•intended to incur, or believed that it would incur, debts beyond its ability to pay those debts as they mature.
The guarantees of the Guaranteed Enbridge Notes contain provisions to limit the maximum amount of liability that the Partnerships could incur without causing the incurrence of obligations under the guarantee to be a fraudulent conveyance or fraudulent transfer under US federal or state law.
Each of the Partnerships is entitled to a right of contribution from the other Partnership for 50% of all payments, damages and expenses incurred by that Partnership in discharging its obligations under the guarantees for the Guaranteed Enbridge Notes.
Under the terms of the guarantee agreement and applicable supplemental indentures, the guarantees of either of the Partnerships of any Guaranteed Enbridge Notes will be unconditionally released and discharged automatically upon the occurrence of any of the following events:
•any direct or indirect sale, exchange or transfer, whether by way of merger, sale or transfer of equity interests or otherwise, to any person that is not an affiliate of Enbridge, of any of Enbridge’s direct or indirect limited partnership of other equity interests in that Partnership as a result of which the Partnership ceases to be a consolidated subsidiary of Enbridge;
•the merger of that Partnership into Enbridge or the other Partnership or the liquidation and dissolution of that Partnership;
•the repayment in full or discharge or defeasance of those Guaranteed Enbridge Notes, as contemplated by the applicable indenture or guarantee agreement;
•with respect to EEP, the repayment in full or discharge or defeasance of each of the consenting EEP notes listed above;
•with respect to SEP, the repayment in full or discharge or defeasance of each of the consenting SEP notes listed above; or
•with respect to any series of Guaranteed Enbridge Notes, with the consent of holders of at least a majority of the outstanding principal amount of that series of Guaranteed Enbridge Notes.
The guarantee obligations of Enbridge will terminate with respect to any series of Guaranteed Partnership Notes if that series is discharged or defeased.
The Partnerships also guarantee the obligations of Enbridge under its existing credit facilities.
LEGAL AND OTHER UPDATES
LINE 5 EASEMENT (BAD RIVER BAND)
On July 23, 2019, the Bad River Band of the Lake Superior Tribe of Chippewa Indians (the Band) filed a
complaint in the US District Court for the Western District of Wisconsin (the Court) over our Line 5 pipeline and right-of-way across the Bad River Reservation (the Reservation). Only a small portion of the total easements across 12 miles of the Reservation are at issue. The Band alleges that the continued operation of Line 5 across the Reservation constitutes a public nuisance under federal and state law and that the pipeline is in trespass on certain tracts of land where the Band holds ownership interests. The complaint seeks an Order prohibiting us from using Line 5 to transport crude oil and related liquids across the Reservation and requiring removal of the pipeline from the Reservation. Subsequently amended versions of the complaint also seek recovery of profits-based damages based on an unjust enrichment theory. Enbridge has responded to each claim in the initial and amended complaints with answers, defenses and counterclaims.
On August 29, 2022, the Government of Canada released a statement formally invoking the dispute settlement provisions of the Agreement Between the US and Canada Concerning Transit Pipelines, 28 U.S.T. 7449 (1977) (1977 Transit Pipelines Treaty) in respect of this litigation, reiterating its concerns about the uninterrupted transmission of hydrocarbons through Line 5.
On September 7, 2022, the Court issued a decision on cross-motions for summary judgment. The Court determined that the Band's nuisance claim raised factual issues that could not be resolved on summary judgment. The Court further determined that Enbridge is in trespass on 12 parcels on the Reservation and that the Band is entitled to some measure of profits-based damages and injunctive relief, with the level of damages and scope of the injunction to be determined at trial. The trial was held from October 24 to November 1, 2022.
On May 9, 2023, the Band filed an Emergency Motion for Injunctive Relief requesting that the Court order Enbridge to purge and shutdown Line 5 on the Reservation due to significant erosion at a river bend known as Meander. After a hearing on May 18, 2023, the Court stated the Band had not demonstrated imminent harm and indicated a final ruling would follow.
On June 26, 2023, the Court issued its Final Order ruling that: (1) Enbridge shall adopt and implement its 2022 Monitoring and Shutdown Plan with the Court's modifications by July 5, 2023; (2) Enbridge owes the Band $5,151,668 for past trespass on the 12 allotted parcels; (3) Enbridge must continue to make quarterly payments using the Court's formula, for as long as Line 5 operates in trespass on those parcels (approximately $400,000 per year); (4) Enbridge must cease operation of Line 5 on any parcel within the Band's tribal territory lacking a valid right-of-way by June 16, 2026 and thereafter arrange prompt, reasonable remediation at those sites; and (5) The Court declined to allow for completion of the Wisconsin Relocation Project prior to having to cease operations. The Final Judgment was entered on June 29, 2023.
Enbridge filed its Notice of Appeal on June 30, 2023 and the Band filed its Notice of Cross Appeal on July 27, 2023. On December 12, 2023, the US Court of Appeals for the Seventh Circuit requested that the US file a brief in the appeal as amicus curiae to address the effect of 1977 Transit Pipelines Treaty, and any other issues that the US believes to be material. The US filed its brief on April 8, 2024. As invited by the Court of Appeals, on April 29, 2024, Enbridge and the Band filed responses to the US amicus brief. A decision from the Court of Appeals is expected in early 2026. On January 27, 2026, Enbridge filed a Motion to Stay or Modify the portion of the Court’s June 29, 2023 Final Judgment requiring Enbridge to cease operation of Line 5 on any parcel without a valid right-of-way by June 16, 2026.
In March 2025, after receiving authorizations from tribal, federal, and state agencies, an erosion mitigation project was successfully installed at the Meander.
MICHIGAN LINE 5 DUAL PIPELINES - STRAITS OF MACKINAC EASEMENT
Michigan Attorney General Lawsuit
In 2019, the Michigan Attorney General initiated legal action in the Michigan Ingham County Circuit Court (Michigan Circuit Court) seeking to invalidate the 1953 easement that authorizes the operation of Enbridge’s Line 5 pipeline in the Straits of Mackinac. The Attorney General’s case was later moved to US federal court in December 2021, following a November 16, 2021 ruling which held that the similar (and now dismissed) 2020 lawsuit brought by the Governor of Michigan to force the shutdown of Line 5 raised important federal issues that should be heard in federal court.
In June 2024, the US Court of Appeals for the Sixth Circuit (Sixth Circuit) ruled that the case should proceed in state court. Enbridge’s request for a rehearing was denied in August 2024. Oral argument on long-standing cross motions for summary disposition was held in January 2025 in the Michigan Circuit Court. A decision is expected in 2026.
Separately, in January 2025, Enbridge petitioned the US Supreme Court to review the Sixth Circuit’s decision. The Court granted the petition in June 2025. Briefing is complete, with oral argument and a decision expected in 2026. In the interim, Enbridge requested that the Michigan Circuit Court pause proceedings pending the US Supreme Court’s ruling. This motion was denied.
In parallel, the US Army Corps of Engineers (Army Corps) announced in April 2025 that the Line 5 Tunnel Project qualified for review under emergency and special processing procedures. On November 13, 2025, the Army Corps issued a Supplemental Draft Environmental Impact Statement with a public comment period ending in December 2025. On February 6, 2026, the Army Corps issued its Final Environmental Impact System. We expect a Record of Decision to be issued in 2026.
Enbridge Lawsuit
On November 24, 2020, Enbridge filed a complaint in the US District Court in the Western District for Michigan (US District Court) seeking declaratory and injunctive relief to prevent the Governor of Michigan and Director of the Michigan Department of Natural Resources (Michigan State Officials) from interfering with the continued operation of Line 5. The Government of Canada has reiterated its support for the pipeline, emphasizing the relevance of the 1977 Transit Pipelines Treaty and the matter’s importance to Canada.
In January 2022, Michigan State Officials moved to dismiss the case, and Enbridge filed for summary judgment. On July 5, 2024, the US District Court denied the state’s motion to dismiss, prompting an immediate appeal to the Sixth Circuit. The case was stayed pending the outcome of the appeal.
On April 23, 2025, the Sixth Circuit affirmed the US District Court’s ruling and a petition for rehearing en banc was denied on June 16, 2025. On June 24, 2025, the case was administratively transferred back to the US District Court and Michigan State Officials filed their Answer to Enbridge’s complaint.
A case management order was issued on July 14, 2025, setting out a briefing schedule for Enbridge’s summary judgment motion and the state’s motion to abstain. On September 12, 2025, the US filed a statement of interest in the case. Briefing concluded on October 10, 2025 and oral argument was held on November 12, 2025.
On December 17, 2025, the US District Court entered judgment in Enbridge’s favor and denied the Michigan State Officials motion to abstain or stay the federal action. In January 2026, the Michigan State Officials filed an appeal, and shortly thereafter in the Michigan Circuit Court, Enbridge and the Michigan Attorney General filed a stipulation to stay the Michigan Attorney General Lawsuit, pending the Sixth Circuit's decision.
DAKOTA ACCESS PIPELINE
We hold an effective 27.6% interest in the Bakken Pipeline System, which includes the Dakota Access Pipeline (DAPL). The Standing Rock Sioux Tribe and the Cheyenne River Sioux Tribe filed lawsuits in 2016 with the US Court for the District of Columbia (the District Court) challenging the Army Corps’ easement for DAPL, citing concerns over the adequacy of the Army Corps' environmental review and tribal consultation process. The Oglala Sioux and Yankton Sioux Tribes also filed lawsuits alleging similar claims in 2018. In 2017 and again in 2020, the District Court found deficiencies in the Army Corps’ environmental assessments and ordered the preparation of a full Environmental Impact Statement (EIS).
In July 2020, the District Court vacated the easement and ordered the pipeline shut down, but that order was stayed by the US Court of Appeals for the District of Columbia. In January 2021, the US Court of Appeals upheld the requirement for an EIS and confirmed the easement’s vacatur, though it ruled that DAPL could continue operating absent an injunction. The US Supreme Court declined to review the case, and the Army Corps indicated it would not seek to halt operations during the review process.
On September 8, 2023, the Army Corps released a draft EIS evaluating five alternatives, including continued operation, shutdown, rerouting, and removal of the pipeline. No preferred alternative was identified. The public comment period closed on December 13, 2023.
On December 19, 2025, the Army Corps published the final EIS for DAPL. The final EIS includes an extensive analysis of spill risks from the pipeline, including the pipeline safety record of Energy Transfer Crude Oil Pipeline. The Army Corps must wait 30-days after publication of the final EIS before a Record of Decision and new easement may be issued. Accordingly, a Record of Decision and easement are expected in 2026.
Separately, on October 15, 2024, the Standing Rock Sioux Tribe filed a new complaint in the District Court seeking a permanent injunction against DAPL’s operation, alleging that the Army Corps is unlawfully allowing continued operations without a valid easement or compliant Facility Response Plan. Dakota Access, LLC and 13 states intervened in support of continued operations. On March 28, 2025, the District Court dismissed the complaint. The Tribe filed a notice of appeal on May 27, 2025. The appeal process is expected to take six to 12 months.
OTHER LITIGATION
We and our subsidiaries are subject to various other legal and regulatory actions and proceedings which arise in the normal course of business, including interventions in regulatory proceedings and challenges to regulatory approvals and permits. While the final outcome of such actions and proceedings cannot be predicted with certainty, management believes that the resolution of such actions and proceedings will not have a material impact on our consolidated financial position or results of operations.
CRITICAL ACCOUNTING POLICIES AND ESTIMATES
Our consolidated financial statements are prepared in accordance with US GAAP, which requires management to make estimates, judgments and assumptions that affect the amounts reported in our consolidated financial statements and accompanying notes. In making judgments and estimates, management relies on external information and observable conditions, where possible, supplemented by internal analysis as required. We believe our most critical accounting policies and estimates discussed below have an impact across the various segments of our business.
GOODWILL IMPAIRMENT
Goodwill represents the excess of the purchase price over the fair value of net identifiable assets upon acquisition of a business. The carrying value of goodwill, which is not amortized, is assessed for impairment annually or more frequently if events or changes in circumstances arise that suggest the carrying value of goodwill may be impaired. We perform our annual review of the goodwill balance on April 1.
We perform our annual review for impairment at the reporting unit level, which is identified by assessing whether the components of our operating segments constitute businesses for which discrete information is available, whether segment management regularly reviews the operating results of those components, and whether the economic and regulatory characteristics are similar. Our reporting units are Liquids Pipelines, Gas Transmission, Gas Distribution and Storage, and Renewable Power Generation.
We have the option to first assess qualitative factors to determine whether it is necessary to perform the quantitative goodwill impairment assessment. When performing a qualitative assessment, we determine the drivers of fair value for each reporting unit and evaluate whether those drivers have been positively or negatively affected by relevant events and circumstances since the last fair value assessment. Our evaluation includes, but is not limited to, the assessment of macroeconomic trends (including the impact of changes in discount rates and rate base multiple), changes to regulatory environments, capital accessibility, operating income trends (including changes to projected cash flows from operations, expected future capital expenditures and forecasted rate base), and changes to industry conditions. Based on our assessment of qualitative factors, if we determine it is more likely than not that the fair value of the reporting unit is less than its carrying amount, a quantitative goodwill impairment assessment is performed.
The quantitative goodwill impairment assessment involves determining the fair value of our reporting units and comparing those values to the carrying value of each reporting unit. If the carrying value of a reporting unit, including allocated goodwill, exceeds its fair value, goodwill impairment is measured at the amount by which the reporting unit's carrying value exceeds its fair value. This amount should not exceed the carrying amount of goodwill. The fair value of our reporting units is estimated using either a discounted cash flow technique or a combination of discounted cashflow and earnings multiples techniques. The determination of fair value using the discounted cash flow technique requires the use of estimates and assumptions related to discount rates, projected operating income, expected future capital expenditures, as well as terminal value growth rates for the Liquids Pipelines, Gas Transmission, and Renewable Power Generation reporting units, and projected regulatory rate base and rate base multiple for the Gas Distribution and Storage reporting unit. The determination of fair value using the earnings multiples technique requires assumptions to be made in relation to maintainable earnings and earnings multiples.
The allocation of goodwill to held-for-sale and disposed businesses is based on the relative fair value of businesses included in the relevant reporting unit.
On April 1, 2025, we performed our annual goodwill impairment assessment which consisted of a qualitative assessment for the Liquids Pipelines and Renewable Power Generation reporting units and did not identify any impairment indicators. We also chose to perform a quantitative assessment for the Gas Transmission and Gas Distribution and Storage reporting units which did not result in the recognition of any impairment charges. No indicators of goodwill impairment were identified during the remainder of 2025.
ASSET IMPAIRMENT
We evaluate the recoverability of our property, plant and equipment when events or circumstances, such as economic obsolescence, business climate, legal or regulatory changes, or other factors, indicate that we may not recover the carrying amount of our assets. We regularly monitor our businesses, the market and business environments to identify indicators that could suggest an asset may not be recoverable. If it is determined that the carrying value of an asset exceeds its expected undiscounted cash flows, we will assess the fair value of the asset. An impairment loss is recognized when the carrying amount of the asset exceeds its fair value.
With respect to equity method investments, we assess at each balance sheet date whether there is objective evidence that the investment is impaired by completing a qualitative or quantitative analysis of factors impacting the investment. If there is objective evidence of impairment, we determine whether the decline below carrying value is other-than-temporary. If the decline is determined to be other-than-temporary, an impairment charge is recorded in earnings with an offsetting reduction to the carrying value of the investment.
Asset fair value is determined using present value techniques. The determination of fair value using present value techniques requires the use of projections and assumptions regarding future cash flows and weighted average cost of capital. Any changes to these projections and assumptions could result in revisions to the evaluation of the recoverability of the asset and the recognition of an impairment loss in the Consolidated Statements of Earnings.
REGULATORY ACCOUNTING
Certain parts of our businesses are subject to regulation by various authorities including, but not limited to the CER, the FERC, the Alberta Energy Regulator, the BC Energy Regulator, the OEB, the Québec Régie de l’énergie, the Ohio Commission, the North Carolina Commission, the Utah Commission, the Wyoming Commission, and the Idaho Commission. Regulatory bodies exercise statutory authority over matters such as construction, rates and ratemaking, and agreements with customers. To recognize the economic effects of the actions of the regulator, the timing of recognition of certain revenues and expenses in these operations may differ from that otherwise expected under US GAAP for non-rate-regulated entities.
Key determinants in the ratemaking process are:
•costs of providing service, including operating costs, capital invested, depreciation expense and taxes;
•allowed rate of return, including the equity component of the capital structure and related income taxes;
•interest costs on the debt component of the capital structure; and
•contract and volume throughput assumptions.
The allowed rate of return is determined in accordance with the applicable regulatory model and may impact our profitability. The rates for a number of our projects are based on a cost-of-service recovery model that follows the regulators' authoritative guidance. Under the cost-of-service tolling methodology, we calculate tolls based on forecast volumes and cost. A difference between forecast and actual results causes an over- or under-recovery in any given year.
Regulatory assets represent amounts that are expected to be recovered from customers in future periods through rates. Regulatory liabilities represent amounts that are expected to be refunded to customers in future periods through rates, amounts collected from customers in advance of costs being incurred, or to be paid to cover future abandonment costs and for future removal and site restoration costs as approved by the regulator. If there are changes in our assessment of the probability of recovery for a regulatory asset, we reduce its carrying amount to the balance that we expect to recover from customers in future periods through rates. If a regulator later excludes from allowable costs all or a part of costs that were capitalized as a regulatory asset, we reduce the carrying amount of the asset by the excluded amounts.
The recognition of regulatory assets and liabilities is based on the actions, or expected future actions, of the regulator. To the extent that the regulator's actions differ from our expectations, the timing and amount of recovery or settlement of regulatory balances could differ significantly from those recorded. In the absence of rate regulation, we would generally not recognize regulatory assets or liabilities and the earnings impact would be recorded in the period the expenses are incurred or revenues are earned. A regulatory asset or liability is recognized in respect of deferred income taxes when it is expected the amounts will be recovered or settled through future regulator-approved rates.
As at December 31, 2025 and 2024, our regulatory assets totaled $7.6 billion and our regulatory liabilities totaled $6.7 billion in both years.
DEPRECIATION
Depreciation of property, plant and equipment, our largest asset with a net book value at December 31, 2025 and 2024, of $131.6 billion and $131.1 billion, respectively, is charged in accordance with two primary methods. For distinct assets, depreciation is generally provided on a straight-line basis over the estimated useful life of the asset commencing when it is placed in service. For largely homogeneous groups of assets with comparable useful lives, the pool method of accounting is followed whereby similar assets are grouped and depreciated as a pool. When group assets are retired or otherwise disposed of, gains and losses are generally not reflected in earnings but are booked as an adjustment to accumulated depreciation.
When it is determined that the estimated service life of an asset no longer reflects the expected remaining period of benefit, prospective changes are made to the estimated service life. Estimates of useful lives are based on third-party engineering studies, experience and/or industry practice. There are a number of assumptions inherent in estimating the service lives of our assets including the level of development, exploration, drilling, reserves and production of crude oil and natural gas in the supply areas served by our pipelines, as well as the demand for crude oil and natural gas and the integrity of our systems. Changes in these assumptions could result in adjustments to the estimated service lives, which could result in material changes to depreciation expense in future periods in any of our business segments. For certain rate-regulated operations, depreciation rates are approved by the regulator and the regulator may require periodic studies or technical updates on useful lives which may change depreciation rates.
The successful efforts method of accounting is used for cost-of-service reserves developed and produced by Wexpro for gas utility affiliate, Questar. Cost-of-service reserves are properties for which the operations and return on investment are subject to the Wexpro Agreements. Under the successful efforts method, Wexpro capitalizes the costs of acquiring leaseholds, drilling development wells, drilling successful exploratory wells, and purchasing related support equipment and facilities. Geological and geophysical studies are expensed as incurred. Capitalized costs of development wells and leaseholds are amortized on a field-by-field basis using the unit-of-production method and the estimated proved developed or total proved natural gas and crude oil reserves.
PENSION AND OTHER POSTRETIREMENT BENEFITS
We use certain assumptions relating to the calculation of defined benefit pension and other postretirement liabilities and net periodic benefit costs. These assumptions comprise management's best estimates of expected return on plan assets, future salary levels, other cost escalations, retirement ages of employees, and other actuarial factors including discount rates and mortality. We determine discount rates by reference to rates of high-quality long-term corporate bonds with maturities that approximate the timing of future payments anticipated to be made under each of the respective plans. The expected return on plan assets is determined using market-related values and assumptions on the asset mix consistent with the investment policy relating to the assets and their projected returns. The assumptions are reviewed annually by our independent actuaries. Actual results that differ from results based on assumptions are amortized over future periods and, therefore, could materially affect the expense recognized and the recorded obligation in future periods.
The following sensitivity analysis identifies the impact on the consolidated financial statements for the year ended December 31, 2025 of a 0.5% change in key pension and other postretirement benefits (OPEB) obligation assumptions:
|
|
|
|
|
|
|
|
|
|
|
|
|
|
|
Canada |
|
|
United States |
|
|
Obligation |
|
Expense |
|
|
Obligation |
|
Expense |
|
(millions of Canadian dollars) |
|
|
|
|
|
|
|
|
|
Pension |
|
|
|
|
|
|
|
|
|
Decrease in discount rate |
|
281 |
|
|
7 |
|
|
|
90 |
|
|
2 |
|
Decrease in expected return on assets |
|
— |
|
|
25 |
|
|
|
— |
|
|
10 |
|
Decrease in rate of salary increase |
|
(54 |
) |
|
(8 |
) |
|
|
(18 |
) |
|
(3 |
) |
OPEB |
|
|
|
|
|
|
|
|
|
Decrease in discount rate |
|
11 |
|
|
1 |
|
|
|
7 |
|
|
— |
|
Decrease in expected return on assets |
N/A |
|
N/A |
|
|
|
— |
|
|
1 |
|
CONTINGENT LIABILITIES
Provisions for claims filed against us are determined on a case-by-case basis. Case estimates are reviewed on a regular basis and are updated as new information is received. The process of evaluating claims involves the use of estimates and a high degree of management judgment. Claims outstanding, the final determination of which could have a material impact on our financial results and certain subsidiaries and investments, are detailed in Legal and Other Updates and Part II. Item 8. Financial Statements and Supplementary Data - Note 30 - Commitments and Contingencies. In addition, any unasserted claims that later may become evident could have a material impact on our financial results and certain subsidiaries and investments.
ASSET RETIREMENT OBLIGATIONS
Asset retirement obligations (ARO) associated with the retirement of long-lived assets are measured at fair value and recognized as Other current liabilities or Other long-term liabilities in the period in which they can be reasonably determined. Fair value approximates the cost a third party would charge to perform the tasks necessary to retire such assets and is recognized at the present value of expected future cash flows. The discount rates used to estimate the present value of expected future cash flows for the years ended December 31, 2025 ranged from 3.0% to 9.0% (2024 - 1.5% to 9.0%). Asset retirement cost is added to the carrying value of the associated asset and depreciated over the asset's useful life. The corresponding liability is accreted over time through charges to earnings and is reduced by actual costs of decommissioning and reclamation. Our estimates of retirement costs could change as a result of changes in cost estimates and regulatory requirements. Currently, for the majority of our assets, there is insufficient data or information to reasonably determine the timing of settlement for estimating the fair value of the ARO. In these cases, the fair value of ARO is considered indeterminate for accounting purposes, as there is no data or information that can be derived from past practice, industry practice or the estimated economic life of the asset.
In 2009, the CER issued a decision related to the Land Matters Consultation Initiative (LMCI), which required holders of an authorization to operate a pipeline under the CER Act to file a proposed process and mechanism to set aside funds to pay for future abandonment costs in respect of the sites in Canada used for the operation of a pipeline. The CER's decision stated that, while pipeline companies are ultimately responsible for the full costs of abandoning pipelines, abandonment costs are a legitimate cost of providing service and are recoverable from the users of the pipeline upon approval by the CER. Following the CER's final approval of the collection mechanism and the set-aside mechanism for LMCI, we began collecting and setting aside funds to cover future abandonment costs effective January 1, 2015. The funds collected are held in trusts in accordance with the CER decision. The funds collected from shippers are reported within Transportation and other services revenues and Restricted long-term investments and cash. Concurrently, we reflect the future abandonment cost as an increase to Operating and administrative expense and Other long-term liabilities.
CHANGES IN ACCOUNTING POLICIES
Refer to Part II. Item 8. Financial Statements and Supplementary Data - Note 3 - Changes in Accounting Policies.
ITEM 7A. QUANTITATIVE AND QUALITATIVE DISCLOSURES ABOUT MARKET RISK
Our earnings, cash flows and other comprehensive income/(loss) (OCI) are subject to movements in foreign exchange rates, interest rates, commodity prices and our share price (collectively, market risks).
The following summarizes the types of market risks to which we are exposed and the risk management instruments used to mitigate them. We use a combination of qualifying and non-qualifying derivative instruments to manage the risks noted below.
Foreign Exchange Risk
We generate certain revenues, incur expenses and hold a number of investments and subsidiaries that are denominated in currencies other than Canadian dollars. As a result, our earnings, cash flows and OCI are exposed to fluctuations resulting from foreign exchange rate variability.
We employ financial derivative instruments to hedge foreign currency denominated earnings exposure. A combination of qualifying and non-qualifying derivative instruments is used to hedge anticipated foreign currency denominated revenues and expenses and to manage variability in cash flows. We hedge certain net investments in US dollar-denominated investments and subsidiaries using US dollar-denominated debt.
Interest Rate Risk
Our earnings, cash flows and OCI are exposed to short-term interest rate variability due to the regular repricing of our variable rate debt, primarily commercial paper. We have a policy of limiting the maximum floating rate debt to 30% of total debt outstanding. We monitor and adjust our debt portfolio mix of fixed and variable rate debt instruments, along with the use of derivative instruments, to support compliance with our policy. We have implemented a program to partially mitigate the impact of short-term interest rate volatility on interest expense via the execution of floating-to-fixed interest rate swaps and costless collars. These swaps have an average fixed rate of 2.8%.
We are exposed to changes in the fair value of fixed rate debt that arise as a result of changes in market interest rates. Pay floating-receive fixed interest rate swaps are used, when applicable, to hedge against future changes to the fair value of fixed rate debt which mitigates the impact of fluctuations in fair value. Executed fixed-to-floating interest rate swaps have an average swap rate of 2.8%.
Our earnings and cash flows are also exposed to variability in longer term interest rates ahead of anticipated fixed rate term debt issuances. A combination of qualifying and non-qualifying forward starting interest rate swaps are used to hedge against the effect of future interest rate movements. We have established a program including some of our subsidiaries to partially mitigate our exposure to long-term interest rate variability on forecasted term debt issuances via execution of floating-to-fixed interest rate swaps with an average swap rate of 3.4%.
Commodity Price Risk
Our earnings, cash flows and OCI are exposed to changes in commodity prices as a result of our ownership interests in certain assets and investments, as well as through the activities of our energy marketing subsidiaries. These commodities include natural gas, crude oil, power and NGL. We employ financial and physical derivative instruments to fix a portion of the variable price exposures that arise from physical transactions involving these commodities. For our US Gas Utilities, changes in derivatives' fair values are deferred as regulatory assets or liabilities until settlement. We use primarily non-qualifying derivative instruments to manage commodity price risk.
Equity Price Risk
Equity price risk is the risk of earnings fluctuations due to changes in our share price. We have exposure to our own common share price through the issuance of various forms of stock-based compensation, which affect earnings through the revaluation of outstanding units every period.
Market Risk Management
Formal risk management policies, processes and systems have been designed to minimize the likelihood that adverse cash flow impacts arising from movements in market prices will exceed a defined risk tolerance. We identify and measure all material market risks including commodity price risk, interest rate risk, foreign exchange risk and equity price risk using a standardized measurement methodology. Our market risk metric consolidates the exposure after accounting for the impact of offsetting risks and limits the consolidated cash flow volatility arising from market related risks to an acceptable approved risk tolerance threshold. Our market risk metric is Cash Flow at Risk (CFaR).
CFaR is a statistically derived measurement used to measure the maximum cash flow loss that could potentially result from adverse market price movements over a one month holding period for price sensitive non-derivative exposures and for derivative instruments we hold or issue as recorded in the Consolidated Statements of Financial Position as at December 31, 2025. CFaR assumes that no further mitigating actions are taken to hedge or otherwise minimize exposures and the selection of a one month holding period reflects the mix of price risk sensitive assets at Enbridge. As a practical matter, a large portion of Enbridge’s exposure could be hedged or unwound in a much shorter period if required to mitigate the risks.
The consolidated CFaR policy limit for Enbridge is 3.5% of its forward 12 month normalized cash flow. At December 31, 2025 and 2024 CFaR was $166 million and $113 million or 1.3% and 0.9%, respectively, of estimated 12 month forward normalized cash flow.
LIQUIDITY RISK
Liquidity risk is the risk that we will not be able to meet our financial obligations, including commitments and guarantees, as they become due. In order to mitigate this risk, we forecast cash requirements over a 12-month rolling time period to determine whether sufficient funds will be available. Our primary sources of liquidity and capital resources are funds generated from operations, the issuance of commercial paper and draws under committed credit facilities and long-term debt, which includes debentures and medium-term notes. Our shelf prospectuses with securities regulators enable ready access to either the Canadian or US public capital markets, subject to market conditions. In addition, we maintain sufficient liquidity through committed credit facilities with a diversified group of banks and institutions which, if necessary, enables us to fund all anticipated requirements for approximately one year without accessing the capital markets. We were in compliance with all the terms and conditions of our committed credit facility agreements and term debt indentures as at December 31, 2025. As a result, all credit facilities are available to us and the banks are obligated to fund us under the terms of the facilities. We also identify other potential sources of debt and equity funding alternatives, including reinstatement of our dividend reinvestment and share purchase plan or at-the-market equity issuances.
CREDIT RISK
Entering into derivative instruments may result in exposure to credit risk from the possibility that a counterparty will default on its contractual obligations. In order to mitigate this risk, we enter into risk management transactions primarily with institutions that possess strong investment grade credit ratings. Credit risk relating to derivative counterparties is mitigated through the maintenance and monitoring of credit exposure limits, contractual requirements and netting arrangements. We also review counterparty financial strength using external credit rating services and other analytical tools to manage credit risk.
We have a policy of entering into individual International Swaps and Derivatives Association, Inc. agreements, or other similar derivative agreements, with the majority of our financial derivative counterparties. These agreements provide for the net settlement of derivative instruments outstanding with specific counterparties in the event of bankruptcy or other significant credit events and reduce our credit risk exposure on financial derivative asset positions in those circumstances.
FAIR VALUE MEASUREMENTS
Our financial assets and liabilities measured at fair value on a recurring basis include derivatives and other financial instruments. We also disclose the fair value of other financial instruments not measured at fair value. The fair value of financial instruments reflects our best estimates of market value based on generally accepted valuation techniques or models and is supported by observable market prices and rates. When such values are not available, we use discounted cash flow analysis from applicable yield curves based on observable market inputs to estimate fair value.
ITEM 8. FINANCIAL STATEMENTS AND SUPPLEMENTARY DATA
Report of Independent Registered Public Accounting Firm
To the Board of Directors and Shareholders of Enbridge Inc.
Opinions on the Financial Statements and Internal Control over Financial Reporting
We have audited the accompanying consolidated statements of financial position of Enbridge Inc. and its subsidiaries (the Company) as of December 31, 2025 and 2024, and the related consolidated statements of earnings, of comprehensive income, of changes in equity and of cash flows for each of the three years in the period ended December 31, 2025, including the related notes (collectively referred to as the consolidated financial statements). We also have audited the Company’s internal control over financial reporting as of December 31, 2025, based on criteria established in Internal Control ‒ Integrated Framework (2013) issued by the Committee of Sponsoring Organizations of the Treadway Commission (COSO).
In our opinion, the consolidated financial statements referred to above present fairly, in all material respects, the financial position of the Company as of December 31, 2025 and 2024, and the results of its operations and its cash flows for each of the three years in the period ended December 31, 2025 in conformity with accounting principles generally accepted in the United States of America. Also in our opinion, the Company maintained, in all material respects, effective internal control over financial reporting as of December 31, 2025, based on criteria established in Internal Control ‒ Integrated Framework (2013) issued by the COSO.
Basis for Opinions
The Company’s management is responsible for these consolidated financial statements, for maintaining effective internal control over financial reporting, and for its assessment of the effectiveness of internal control over financial reporting, included in Management’s Annual Report on Internal Control over Financial Reporting appearing under Item 9A. Our responsibility is to express opinions on the Company’s consolidated financial statements and on the Company’s internal control over financial reporting based on our audits. We are a public accounting firm registered with the Public Company Accounting Oversight Board (United States) (PCAOB) and are required to be independent with respect to the Company in accordance with the U.S. federal securities laws and the applicable rules and regulations of the Securities and Exchange Commission and the PCAOB.
We conducted our audits in accordance with the standards of the PCAOB. Those standards require that we plan and perform the audits to obtain reasonable assurance about whether the consolidated financial statements are free of material misstatement, whether due to error or fraud, and whether effective internal control over financial reporting was maintained in all material respects.
Our audits of the consolidated financial statements included performing procedures to assess the risks of material misstatement of the consolidated financial statements, whether due to error or fraud, and performing procedures that respond to those risks. Such procedures included examining, on a test basis, evidence regarding the amounts and disclosures in the consolidated financial statements. Our audits also included evaluating the accounting principles used and significant estimates made by management, as well as evaluating the overall presentation of the consolidated financial statements. Our audit of internal control over financial reporting included
obtaining an understanding of internal control over financial reporting, assessing the risk that a material weakness exists, and testing and evaluating the design and operating effectiveness of internal control based on the assessed risk. Our audits also included performing such other procedures as we considered necessary in the circumstances. We believe that our audits provide a reasonable basis for our opinions.
Definition and Limitations of Internal Control over Financial Reporting
A company’s internal control over financial reporting is a process designed to provide reasonable assurance regarding the reliability of financial reporting and the preparation of financial statements for external purposes in accordance with generally accepted accounting principles. A company’s internal control over financial reporting includes those policies and procedures that (i) pertain to the maintenance of records that, in reasonable detail, accurately and fairly reflect the transactions and dispositions of the assets of the company; (ii) provide reasonable assurance that transactions are recorded as necessary to permit preparation of financial statements in accordance with generally accepted accounting principles, and that receipts and expenditures of the company are being made only in accordance with authorizations of management and directors of the company; and (iii) provide reasonable assurance regarding prevention or timely detection of unauthorized acquisition, use, or disposition of the company’s assets that could have a material effect on the financial statements.
Because of its inherent limitations, internal control over financial reporting may not prevent or detect misstatements. Also, projections of any evaluation of effectiveness to future periods are subject to the risk that controls may become inadequate because of changes in conditions, or that the degree of compliance with the policies or procedures may deteriorate.
Critical Audit Matters
The critical audit matter communicated below is a matter arising from the current period audit of the consolidated financial statements that was communicated or required to be communicated to the audit committee and that (i) relates to accounts or disclosures that are material to the consolidated financial statements and (ii) involved our especially challenging, subjective, or complex judgments. The communication of critical audit matters does not alter in any way our opinion on the consolidated financial statements, taken as a whole, and we are not, by communicating the critical audit matter below, providing a separate opinion on the critical audit matter or on the accounts or disclosures to which it relates.
Quantitative goodwill impairment assessment for the Gas Transmission (GT) and Gas Distribution and Storage (GDS) reporting units
As described in Notes 2 and 15 to the consolidated financial statements, the Company’s goodwill balance was $35,284 million as of December 31, 2025, which includes goodwill balances of $17,531 million and $8,721 million related to the GT and GDS reporting units, respectively. As disclosed by management, an annual goodwill impairment assessment is performed at the reporting unit level as of April 1 of each year, or more frequently if events or circumstances indicate that the carrying value of goodwill may be impaired. Management has the option to first assess qualitative factors to determine whether it is necessary to perform the quantitative goodwill impairment assessment. Management performed a quantitative goodwill impairment assessment for the GT and GDS reporting units. The quantitative goodwill impairment assessment involves determining the fair value of the Company’s reporting units and comparing those values to the carrying value of each reporting unit. If the carrying value of a reporting unit, including allocated goodwill, exceeds its fair value, goodwill impairment is measured at the amount by which the reporting unit’s carrying value exceeds its fair value. The fair value of the
reporting units is estimated using either a discounted cash flow technique or a combination of discounted cash flow and earnings multiples techniques. The determination of fair value using the discounted cash flow technique requires the use of estimates and assumptions related to discount rates, projected operating income, expected future capital expenditures, as well as terminal value growth rate for the GT reporting unit, and projected regulatory rate base and rate base multiple for the GDS reporting unit. The determination of fair value using the earnings multiples technique requires assumptions to be made in relation to maintainable earnings and earnings multiples. Following management’s assessment, no impairment charges were recognized.
The principal considerations for our determination that performing procedures relating to the quantitative goodwill impairment assessment for the GT and GDS reporting units is a critical audit matter are the significant judgments required by management when developing such assumptions as discount rate, projected operating income and earnings multiples used to estimate the fair value of the GT reporting unit and projected regulatory rate base and rate base multiple used to estimate the fair value of the GDS reporting unit as of April 1, 2025. This led to a high degree of auditor judgment, effort and subjectivity in performing procedures to evaluate the reasonableness of these assumptions used in the quantitative goodwill impairment assessment. In addition, the audit effort involved the use of professionals with specialized skill and knowledge.
Addressing the matter involved performing procedures and evaluating audit evidence in connection with forming our overall opinion on the consolidated financial statements. These procedures included testing the effectiveness of controls relating to management’s quantitative goodwill impairment assessment, including controls over the determination of the fair value estimates of the GT and GDS reporting units. These procedures also included, among others, testing management’s process for developing the fair value estimates of the GT and GDS reporting units. Testing management’s process for developing the fair value estimates included evaluating the appropriateness of the discounted cash flow and the earnings multiples models; testing the completeness and accuracy of underlying data used in the models; and evaluating the reasonableness of projected operating income and the projected regulatory rate base by considering the current and past performance of the Company’s reporting units, external industry data and evidence obtained in other areas of the audit, as applicable. Professionals with specialized skill and knowledge assisted in evaluating the appropriateness of management’s discounted cash flow and earnings multiples models and the reasonableness of the discount rate, earnings multiples and rate base multiple used in the models, as applicable.
/s/PricewaterhouseCoopers LLP
Chartered Professional Accountants
Calgary, Canada
February 13, 2026
We have served as the Company’s auditor since 1949.
ENBRIDGE INC.
CONSOLIDATED STATEMENTS OF EARNINGS
|
|
|
|
|
|
|
|
|
|
Year ended December 31, |
2025 |
|
2024 |
|
2023 |
|
(millions of Canadian dollars, except per share amounts) |
|
|
|
|
|
|
Operating revenues |
|
|
|
|
|
|
Commodity sales |
|
35,181 |
|
|
27,018 |
|
|
18,981 |
|
Gas distribution sales |
|
9,769 |
|
|
6,802 |
|
|
5,442 |
|
Transportation and other services |
|
20,244 |
|
|
19,653 |
|
|
19,226 |
|
Total operating revenues (Note 4) |
|
65,194 |
|
|
53,473 |
|
|
43,649 |
|
Operating expenses |
|
|
|
|
|
|
Commodity costs |
|
34,358 |
|
|
26,556 |
|
|
18,526 |
|
Gas distribution costs |
|
3,678 |
|
|
2,484 |
|
|
2,840 |
|
Operating and administrative |
|
9,969 |
|
|
9,427 |
|
|
8,600 |
|
Depreciation and amortization |
|
5,661 |
|
|
5,167 |
|
|
4,613 |
|
Impairment of long-lived assets |
|
570 |
|
|
190 |
|
|
419 |
|
Total operating expenses |
|
54,236 |
|
|
43,824 |
|
|
34,998 |
|
Operating income |
|
10,958 |
|
|
9,649 |
|
|
8,651 |
|
Income from equity investments (Note 13) |
|
2,224 |
|
|
2,304 |
|
|
1,816 |
|
Gain on disposition of equity investments (Note 13) |
|
— |
|
|
1,091 |
|
|
— |
|
Other income/(expense) (Note 27) |
|
1,634 |
|
|
(1,326 |
) |
|
1,224 |
|
Interest expense (Note 17) |
|
(5,023 |
) |
|
(4,419 |
) |
|
(3,812 |
) |
Earnings before income taxes |
|
9,793 |
|
|
7,299 |
|
|
7,879 |
|
Income tax expense (Note 24) |
|
(2,004 |
) |
|
(1,668 |
) |
|
(1,821 |
) |
Earnings |
|
7,789 |
|
|
5,631 |
|
|
6,058 |
|
(Earnings)/loss attributable to noncontrolling interests and redeemable noncontrolling interest |
|
(298 |
) |
|
(190 |
) |
|
133 |
|
Earnings attributable to controlling interests |
|
7,491 |
|
|
5,441 |
|
|
6,191 |
|
Preference share dividends |
|
(419 |
) |
|
(388 |
) |
|
(352 |
) |
Earnings attributable to common shareholders |
|
7,072 |
|
|
5,053 |
|
|
5,839 |
|
Earnings per common share attributable to common shareholders (Note 6) |
|
3.23 |
|
|
2.34 |
|
|
2.84 |
|
Diluted earnings per common share attributable to common shareholders (Note 6) |
|
3.22 |
|
|
2.34 |
|
|
2.84 |
|
The accompanying notes are an integral part of these consolidated financial statements.
ENBRIDGE INC.
CONSOLIDATED STATEMENTS OF COMPREHENSIVE INCOME
|
|
|
|
|
|
|
|
|
|
Year ended December 31, |
2025 |
|
2024 |
|
2023 |
|
(millions of Canadian dollars) |
|
|
|
|
|
|
Earnings |
|
7,789 |
|
|
5,631 |
|
|
6,058 |
|
Other comprehensive income/(loss), net of tax |
|
|
|
|
|
|
Change in unrealized gain on cash flow hedges |
|
28 |
|
|
73 |
|
|
220 |
|
Gain/(loss) on net investment hedges (Note 23) |
|
419 |
|
|
(1,305 |
) |
|
409 |
|
Other comprehensive income/(loss) from equity investees and other investments |
|
24 |
|
|
(10 |
) |
|
6 |
|
Excluded components of fair value hedges |
|
14 |
|
|
9 |
|
|
12 |
|
Reclassification to earnings of loss on cash flow hedges |
|
27 |
|
|
23 |
|
|
14 |
|
Reclassification to earnings of pension and other postretirement benefits (OPEB) amounts |
|
(30 |
) |
|
(16 |
) |
|
(18 |
) |
Reclassification of actuarial gain on pension and OPEB from regulatory assets |
|
38 |
|
|
— |
|
|
— |
|
Actuarial gain/(loss) on pension and OPEB |
|
126 |
|
|
248 |
|
|
(130 |
) |
Foreign currency translation adjustments |
|
(3,134 |
) |
|
5,895 |
|
|
(1,728 |
) |
Other comprehensive income/(loss), net of tax |
|
(2,488 |
) |
|
4,917 |
|
|
(1,215 |
) |
Comprehensive income |
|
5,301 |
|
|
10,548 |
|
|
4,843 |
|
Comprehensive (income)/loss attributable to noncontrolling interests and redeemable noncontrolling interest |
|
(244 |
) |
|
(295 |
) |
|
131 |
|
Comprehensive income attributable to controlling interests |
|
5,057 |
|
|
10,253 |
|
|
4,974 |
|
Preference share dividends |
|
(419 |
) |
|
(388 |
) |
|
(352 |
) |
Comprehensive income attributable to common shareholders |
|
4,638 |
|
|
9,865 |
|
|
4,622 |
|
The accompanying notes are an integral part of these consolidated financial statements.
ENBRIDGE INC.
CONSOLIDATED STATEMENTS OF CHANGES IN EQUITY
|
|
|
|
|
|
|
|
|
|
Year ended December 31, |
2025 |
|
2024 |
|
2023 |
|
(millions of Canadian dollars, except per share amounts) |
|
|
|
|
|
|
Preference shares (Note 20) |
|
|
|
|
|
|
Balance at beginning and end of year |
|
6,818 |
|
|
6,818 |
|
|
6,818 |
|
Common shares (Note 20) |
|
|
|
|
|
|
Balance at beginning of year |
|
71,738 |
|
|
69,180 |
|
|
64,760 |
|
Shares issued, net of issue costs and tax |
|
— |
|
|
2,489 |
|
|
4,485 |
|
Shares issued on exercise of stock options |
|
89 |
|
|
39 |
|
|
3 |
|
Shares issued on vesting of restricted stock units (RSU) |
|
49 |
|
|
30 |
|
|
12 |
|
Share repurchases at stated value |
|
— |
|
|
— |
|
|
(80 |
) |
Balance at end of year |
|
71,876 |
|
|
71,738 |
|
|
69,180 |
|
Additional paid-in capital |
|
|
|
|
|
|
Balance at beginning of year |
|
275 |
|
|
268 |
|
|
275 |
|
Stock-based compensation |
|
113 |
|
|
98 |
|
|
71 |
|
Stock options exercised |
|
(61 |
) |
|
(39 |
) |
|
(3 |
) |
Vested RSUs |
|
(85 |
) |
|
(52 |
) |
|
(20 |
) |
Purchase of noncontrolling interests |
|
— |
|
|
— |
|
|
(28 |
) |
Other |
|
— |
|
|
— |
|
|
(27 |
) |
Balance at end of year |
|
242 |
|
|
275 |
|
|
268 |
|
Deficit |
|
|
|
|
|
|
Balance at beginning of year |
|
(20,046 |
) |
|
(17,115 |
) |
|
(15,486 |
) |
Earnings attributable to controlling interests |
|
7,491 |
|
|
5,441 |
|
|
6,191 |
|
Preference share dividends |
|
(419 |
) |
|
(388 |
) |
|
(352 |
) |
Common share dividends declared |
|
(8,282 |
) |
|
(7,984 |
) |
|
(7,423 |
) |
Share repurchases in excess of stated value |
|
— |
|
|
— |
|
|
(45 |
) |
Redemption value adjustment attributable to redeemable noncontrolling
interest (Note 19) |
|
(28 |
) |
|
— |
|
|
— |
|
Balance at end of year |
|
(21,284 |
) |
|
(20,046 |
) |
|
(17,115 |
) |
Accumulated other comprehensive income (Note 22) |
|
|
|
|
|
|
Balance at beginning of year |
|
7,115 |
|
|
2,303 |
|
|
3,520 |
|
Other comprehensive income/(loss) attributable to common shareholders, net of tax |
|
(2,434 |
) |
|
4,812 |
|
|
(1,217 |
) |
Balance at end of year |
|
4,681 |
|
|
7,115 |
|
|
2,303 |
|
Total Enbridge Inc. shareholders' equity |
|
62,333 |
|
|
65,900 |
|
|
61,454 |
|
Noncontrolling interests (Note 19) |
|
|
|
|
|
|
Balance at beginning of year |
|
2,993 |
|
|
3,029 |
|
|
3,511 |
|
Earnings/(loss) attributable to noncontrolling interests |
|
270 |
|
|
190 |
|
|
(133 |
) |
Other comprehensive income/(loss) attributable to noncontrolling interests, net of tax |
|
|
|
|
|
|
Change in unrealized gain on cash flow hedges |
|
— |
|
|
9 |
|
|
35 |
|
Foreign currency translation adjustments |
|
(54 |
) |
|
96 |
|
|
(33 |
) |
|
|
(54 |
) |
|
105 |
|
|
2 |
|
Comprehensive income/(loss) attributable to noncontrolling interests |
|
216 |
|
|
295 |
|
|
(131 |
) |
Distributions |
|
(360 |
) |
|
(333 |
) |
|
(363 |
) |
Contributions |
|
10 |
|
|
4 |
|
|
11 |
|
Purchase of noncontrolling interests |
|
— |
|
|
(2 |
) |
|
2 |
|
Other |
|
(4 |
) |
|
— |
|
|
(1 |
) |
Balance at end of year |
|
2,855 |
|
|
2,993 |
|
|
3,029 |
|
Total equity |
|
65,188 |
|
|
68,893 |
|
|
64,483 |
|
Dividends paid per common share |
|
3.77 |
|
|
3.66 |
|
|
3.55 |
|
The accompanying notes are an integral part of these consolidated financial statements.
ENBRIDGE INC.
CONSOLIDATED STATEMENTS OF CASH FLOWS
|
|
|
|
|
|
|
|
|
|
Year ended December 31, |
2025 |
|
2024 |
|
|
2023 |
|
(millions of Canadian dollars) |
|
|
|
|
|
|
Operating activities |
|
|
|
|
|
|
Earnings |
|
7,789 |
|
|
5,631 |
|
|
6,058 |
|
Adjustments to reconcile earnings to net cash provided by operating activities: |
|
|
|
|
|
|
Depreciation and amortization |
|
5,661 |
|
|
5,167 |
|
|
4,613 |
|
Deferred income tax expense (Note 24) |
|
1,025 |
|
|
719 |
|
|
1,420 |
|
Unrealized derivative fair value (gain)/loss, net |
|
(1,334 |
) |
|
2,082 |
|
|
(1,180 |
) |
Income from equity investments (Note 13) |
|
(2,224 |
) |
|
(2,304 |
) |
|
(1,816 |
) |
Distributions from equity investments |
|
2,066 |
|
|
2,121 |
|
|
1,998 |
|
Impairment of long-lived assets |
|
570 |
|
|
190 |
|
|
419 |
|
Gain on disposition of equity investments (Note 13) |
|
— |
|
|
(1,091 |
) |
|
— |
|
Other |
|
122 |
|
|
218 |
|
|
378 |
|
Changes in operating assets and liabilities (Note 28) |
|
(1,405 |
) |
|
(133 |
) |
|
2,311 |
|
Net cash provided by operating activities |
|
12,270 |
|
|
12,600 |
|
|
14,201 |
|
Investing activities |
|
|
|
|
|
|
Capital expenditures |
|
(8,973 |
) |
|
(6,711 |
) |
|
(4,654 |
) |
Long-term, restricted and other investments |
|
(2,322 |
) |
|
(3,416 |
) |
|
(1,276 |
) |
Distributions from equity investments in excess of cumulative earnings |
|
681 |
|
|
785 |
|
|
1,151 |
|
Additions to intangible assets |
|
(192 |
) |
|
(219 |
) |
|
(222 |
) |
Acquisitions |
|
— |
|
|
(13,472 |
) |
|
(954 |
) |
Proceeds from disposition of equity investments |
|
349 |
|
|
2,724 |
|
|
— |
|
Net change in affiliate loans |
|
— |
|
|
2 |
|
|
(27 |
) |
Other |
|
(46 |
) |
|
(56 |
) |
|
(61 |
) |
Net cash used in investing activities |
|
(10,503 |
) |
|
(20,363 |
) |
|
(6,043 |
) |
Financing activities |
|
|
|
|
|
|
Net change in short-term borrowings |
|
501 |
|
|
129 |
|
|
(1,596 |
) |
Net change in commercial paper and credit facility draws |
|
1,296 |
|
|
6,549 |
|
|
(8,157 |
) |
Debenture and term note issues, net of issue costs |
|
10,956 |
|
|
9,546 |
|
|
15,377 |
|
Debenture and term note repayments |
|
(6,849 |
) |
|
(6,633 |
) |
|
(4,819 |
) |
Contributions from noncontrolling interests |
|
10 |
|
|
4 |
|
|
11 |
|
Distributions to noncontrolling interests |
|
(360 |
) |
|
(333 |
) |
|
(363 |
) |
Proceeds from investment by redeemable noncontrolling interest in subsidiary, net of transaction costs |
|
712 |
|
|
— |
|
|
— |
|
Contributions from redeemable noncontrolling interest |
|
6 |
|
|
— |
|
|
— |
|
Distributions to redeemable noncontrolling interest |
|
(17 |
) |
|
— |
|
|
— |
|
Common shares issued, net of issue costs |
|
28 |
|
|
2,485 |
|
|
4,450 |
|
Common shares repurchased |
|
— |
|
|
— |
|
|
(125 |
) |
Preference share dividends |
|
(419 |
) |
|
(387 |
) |
|
(352 |
) |
Common share dividends |
|
(8,220 |
) |
|
(7,875 |
) |
|
(7,276 |
) |
Net change in affiliate loans |
|
41 |
|
|
99 |
|
|
71 |
|
Other |
|
(85 |
) |
|
(40 |
) |
|
(85 |
) |
Net cash (used in)/provided by financing activities |
|
(2,400 |
) |
|
3,544 |
|
|
(2,864 |
) |
Effect of translation of foreign denominated cash and cash equivalents and restricted cash |
|
(47 |
) |
|
234 |
|
|
(216 |
) |
Net change in cash and cash equivalents and restricted cash |
|
(680 |
) |
|
(3,985 |
) |
|
5,078 |
|
Cash and cash equivalents and restricted cash at beginning of period1 |
|
2,000 |
|
|
5,985 |
|
|
907 |
|
Cash and cash equivalents and restricted cash at end of period1 |
|
1,320 |
|
|
2,000 |
|
|
5,985 |
|
Supplementary cash flow information |
|
|
|
|
|
|
Cash paid for interest, net of amount capitalized |
|
4,924 |
|
|
4,134 |
|
|
3,380 |
|
Property, plant and equipment and intangible assets non-cash accruals |
|
1,390 |
|
|
1,251 |
|
|
813 |
|
The accompanying notes are an integral part of these consolidated financial statements.
1 As at December 31, 2025, long-term restricted cash of $143 million (2024 - $105 million and 2023 - nil, respectively) was included in Restricted long-term investments and cash in the Consolidated Statements of Financial Position.
ENBRIDGE INC.
CONSOLIDATED STATEMENTS OF FINANCIAL POSITION
|
|
|
|
|
|
|
December 31, |
2025 |
|
2024 |
|
(millions of Canadian dollars; number of shares in millions) |
|
|
|
|
Assets |
|
|
|
|
Current assets |
|
|
|
|
Cash and cash equivalents |
|
1,094 |
|
|
1,803 |
|
Restricted cash |
|
83 |
|
|
92 |
|
Trade receivables and unbilled revenues |
|
7,081 |
|
|
6,920 |
|
Other current assets (Note 9) |
|
3,230 |
|
|
2,770 |
|
Accounts receivable from affiliates |
|
86 |
|
|
90 |
|
Inventory (Note 10) |
|
1,621 |
|
|
1,488 |
|
|
|
13,195 |
|
|
13,163 |
|
Property, plant and equipment, net (Note 11) |
|
131,598 |
|
|
131,104 |
|
Long-term investments (Note 13) |
|
21,264 |
|
|
20,691 |
|
Restricted long-term investments and cash |
|
1,293 |
|
|
998 |
|
Deferred amounts and other assets |
|
11,149 |
|
|
11,034 |
|
Intangible assets, net (Note 14) |
|
3,991 |
|
|
4,587 |
|
Goodwill (Note 15) |
|
35,284 |
|
|
36,600 |
|
Deferred income taxes (Note 24) |
|
701 |
|
|
796 |
|
Total assets |
|
218,475 |
|
|
218,973 |
|
|
|
|
|
|
Liabilities and equity |
|
|
|
|
Current liabilities |
|
|
|
|
Short-term borrowings (Note 17) |
|
1,030 |
|
|
529 |
|
Trade payables and accrued liabilities |
|
7,555 |
|
|
7,060 |
|
Other current liabilities (Note 16) |
|
6,174 |
|
|
7,241 |
|
Accounts payable to affiliates |
|
38 |
|
|
22 |
|
Interest payable |
|
1,176 |
|
|
1,231 |
|
Current portion of long-term debt (Note 17) |
|
5,031 |
|
|
7,729 |
|
|
|
21,004 |
|
|
23,812 |
|
Long-term debt (Note 17) |
|
98,963 |
|
|
93,414 |
|
Other long-term liabilities |
|
12,302 |
|
|
13,258 |
|
Deferred income taxes (Note 24) |
|
20,282 |
|
|
19,596 |
|
|
|
152,551 |
|
|
150,080 |
|
Commitments and contingencies (Note 30) |
|
|
|
|
Redeemable noncontrolling interest (Note 19) |
|
736 |
|
|
— |
|
Equity |
|
|
|
|
Share capital (Note 20) |
|
|
|
|
Preference shares |
|
6,818 |
|
|
6,818 |
|
Common shares (2,182 and 2,178 outstanding at December 31, 2025 and 2024, respectively) |
|
71,876 |
|
|
71,738 |
|
Additional paid-in capital |
|
242 |
|
|
275 |
|
Deficit |
|
(21,284 |
) |
|
(20,046 |
) |
Accumulated other comprehensive income (Note 22) |
|
4,681 |
|
|
7,115 |
|
Total Enbridge Inc. shareholders’ equity |
|
62,333 |
|
|
65,900 |
|
Noncontrolling interests (Note 19) |
|
2,855 |
|
|
2,993 |
|
|
|
65,188 |
|
|
68,893 |
|
Total liabilities and equity |
|
218,475 |
|
|
218,973 |
|
Variable Interest Entities (VIEs) (Note 12)
The accompanying notes are an integral part of these consolidated financial statements.
NOTES TO THE CONSOLIDATED FINANCIAL STATEMENTS
INDEX
|
|
|
|
|
PAGE |
1. |
Business Overview |
105 |
2. |
Significant Accounting Policies |
106 |
3. |
Changes in Accounting Policies |
117 |
4. |
Revenue |
118 |
5. |
Segmented Information |
121 |
6. |
Earnings per Common Share |
123 |
7. |
Regulatory Matters |
124 |
8. |
Acquisitions and Disposition |
128 |
9. |
Other Current Assets |
135 |
10. |
Inventory |
135 |
11. |
Property, Plant and Equipment |
136 |
12. |
Variable Interest Entities |
136 |
13. |
Long-Term Investments |
139 |
14. |
Intangible Assets |
141 |
15. |
Goodwill |
142 |
16. |
Other Current Liabilities |
142 |
17. |
Debt |
143 |
18. |
Asset Retirement Obligations |
147 |
19. |
Noncontrolling Interests |
148 |
20. |
Share Capital |
149 |
21. |
Stock Option and Stock Unit Plans |
152 |
22. |
Components of Accumulated Other Comprehensive Income |
155 |
23. |
Risk Management and Financial Instruments |
156 |
24. |
Income Taxes |
168 |
25. |
Pension and Other Postretirement Benefits |
170 |
26. |
Leases |
179 |
27. |
Other Income/(Expense) |
181 |
28. |
Changes in Operating Assets and Liabilities |
181 |
29. |
Related Party Transactions |
182 |
30. |
Commitments and Contingencies |
182 |
31. |
Guarantees |
183 |
32. |
Quarterly Financial Data (Unaudited) |
184 |
1. BUSINESS OVERVIEW
The terms "we", "our", "us" and "Enbridge" as used in this report refer collectively to Enbridge Inc. and its subsidiaries unless the context suggests otherwise. These terms are used for convenience only and are not intended as a precise description of any separate legal entity within Enbridge.
Enbridge is a publicly traded energy transportation and distribution company. We conduct our business through four business segments: Liquids Pipelines, Gas Transmission, Gas Distribution and Storage, and Renewable Power Generation. These reporting segments are strategic business units established by senior management to facilitate the achievement of our long-term objectives, to aid in resource allocation decisions and to assess operational performance.
LIQUIDS PIPELINES
Liquids Pipelines consists of pipelines and terminals in Canada and the United States (US) that transport, store and export various grades of crude oil and other liquid hydrocarbons, including the Mainline System, Regional Oil Sands System, Gulf Coast and Mid-Continent Systems, and Other. Our Canadian and US crude oil marketing businesses are also included in this segment. These businesses provide energy marketing services to customers and undertake physical commodity marketing activity and logistical services to manage our volume commitments on various pipeline systems.
GAS TRANSMISSION
Gas Transmission consists of our investments in natural gas pipelines and gathering, processing and storage facilities in Canada and the US, including US Gas Transmission, Canadian Gas Transmission, and Other. This segment also includes investments in renewable natural gas (RNG) facilities. On July 2, 2025, Stonlasec8 Indigenous Investments Limited Partnership (the First Nations Partnership), an entity representing 38 First Nations in British Columbia (BC), invested in our Westcoast Energy Inc. (Westcoast) BC natural gas pipeline system. As a result of this investment, the First Nations Partnership holds a redeemable noncontrolling interest in these assets (Note 8).
GAS DISTRIBUTION AND STORAGE
Gas Distribution and Storage consists of our rate-regulated natural gas utility operations in Canada and the US, which service residential, commercial and industrial customers in Ontario, Québec, Ohio, North Carolina, Utah, Wyoming and Idaho. This segment also includes Wexpro Company (Wexpro), which develops and produces natural gas reserves for our gas distribution operations in Utah, Wyoming and Idaho.
RENEWABLE POWER GENERATION
Renewable Power Generation consists primarily of investments in wind and solar power generation facilities, as well as an equity interest in geothermal power facilities. In North America, our assets are primarily located in the provinces of Alberta, Ontario and Québec, and in the states of Colorado, Texas, Indiana, Ohio and West Virginia. We also hold interests in offshore wind facilities in operation, under construction and in active development in the United Kingdom, France and Germany.
ELIMINATIONS AND OTHER
In addition to the segments described above, Eliminations and Other includes operating and administrative costs that are not allocated to business segments, the impact of foreign exchange hedge settlements and the activities of our wholly-owned captive insurance subsidiary. The principal activity of our captive insurance subsidiary is providing insurance and reinsurance coverage for certain insurable property and casualty risk exposures of our operating subsidiaries and certain equity investments. Eliminations and Other also includes new business development activities, corporate investments and our natural gas and power marketing businesses.
Enbridge's chief operating decision maker (CODM) is the President and Chief Executive Officer. The CODM uses earnings before interest, income taxes and depreciation and amortization (EBITDA), disaggregated by line of business, to assess segment performance and to set targets predominantly in the annual and long-term budgeting and forecasting process. Budget-to-actual and actual-to-actual variances in EBITDA are considered when making decisions about the allocation of resources to the segments and to meet our strategic priorities. Refer to Note 5 - Segmented Information for a reconciliation of EBITDA to earnings before income taxes.
2. SIGNIFICANT ACCOUNTING POLICIES
These consolidated financial statements are prepared in accordance with accounting principles generally accepted in the United States of America (US GAAP). Amounts are stated in Canadian dollars unless otherwise noted. As a Securities and Exchange Commission (SEC) registrant, we are permitted to use US GAAP for the purposes of meeting both our Canadian and US continuous disclosure requirements.
BASIS OF PRESENTATION AND USE OF ESTIMATES
The preparation of financial statements in conformity with US GAAP requires management to make estimates and assumptions that affect the reported amounts of assets, liabilities, revenues and expenses, as well as the disclosure of contingent assets and liabilities in the consolidated financial statements. Significant estimates and assumptions used in the preparation of the consolidated financial statements include, but are not limited to: variable consideration included in revenue (Note 4); carrying values of regulatory assets and liabilities (Note 7); purchase price allocations (Note 8); unbilled revenues; expected credit losses; depreciation rates and carrying value of property, plant and equipment (Note 11); amortization rates and carrying value of intangible assets (Note 14); measurement of goodwill (Note 15); fair value of asset retirement obligations (ARO) (Note 18); valuation of stock-based compensation (Note 21); fair value of financial instruments (Note 23); provisions for income taxes (Note 24); assumptions used to measure retirement benefits and OPEB (Note 25); commitments and contingencies (Note 30); and estimates of losses related to environmental remediation obligations (Note 30). Actual results could differ from these estimates.
Certain comparative figures in our consolidated financial statements have been reclassified to conform to the current year's presentation.
PRINCIPLES OF CONSOLIDATION
The consolidated financial statements include our accounts and the accounts of our subsidiaries and VIEs for which we are the primary beneficiary. A VIE is a legal entity that does not have sufficient equity at risk to finance its activities without additional subordinated financial support or is structured such that equity investors lack the ability to make significant decisions relating to the entity's operations through voting rights or do not substantively participate in the gains and losses of the entity. Upon inception of a contractual agreement, we perform an assessment to determine whether the arrangement contains a variable interest in a legal entity and whether that legal entity is a VIE. The primary beneficiary has both the power to direct the activities of the VIE that most significantly impact the entity's economic performance and the obligation to absorb losses, or the right to receive benefits from, the VIE that could potentially be significant to the VIE. Where we conclude that we are the primary beneficiary of a VIE, we consolidate the accounts of that VIE. We assess all variable interests in the entity and use our judgment when determining if we are the primary beneficiary. Other qualitative factors that are considered include decision-making responsibilities, the VIE capital structure, risk and rewards sharing, contractual agreements with the VIE, voting rights and level of involvement of other parties. We assess the primary beneficiary determination for a VIE on an ongoing basis if there are changes in the facts and circumstances related to a VIE. If an entity is determined to not be a VIE, the voting interest entity model is applied, where an investor holding the majority voting rights consolidates the entity. The consolidated financial statements also include the accounts of any limited partnerships where we represent the general partner and, based on all facts and circumstances, control such limited partnerships, unless the limited partner has substantive participating rights or substantive kick-out rights. For certain investments where we retain an undivided interest in assets and liabilities, we record our proportionate share of assets, liabilities, revenues and expenses.
All intercompany accounts and transactions are eliminated upon consolidation. Ownership interests in subsidiaries represented by other parties that do not control the entity are presented in the consolidated financial statements as activities and balances attributable to noncontrolling interests (NCI). Investments and entities over which we exercise significant influence are accounted for using the equity method.
REGULATION
Certain of our businesses are subject to regulation by various authorities including, but not limited to, the Canada Energy Regulator (CER), the Federal Energy Regulatory Commission (FERC), the Alberta Energy Regulator, the British Columbia (BC) Energy Regulator, the Ontario Energy Board (OEB), the Québec Régie de l’énergie, the Public Utilities Commission of Ohio (Ohio Commission), the North Carolina Utilities Commission (North Carolina Commission), the Utah Public Service Commission (Utah Commission), the Wyoming Public Service Commission (Wyoming Commission), and the Idaho Public Utilities Commission (Idaho Commission). Regulatory bodies exercise statutory authority over matters such as construction, rates and ratemaking, and agreements with customers. To recognize the economic effects of the actions of the regulator, the timing of recognition of certain revenues and expenses in these operations may differ from that otherwise expected under US GAAP for non-rate-regulated entities.
Regulatory assets represent amounts that are expected to be recovered from customers in future periods through rates. Regulatory liabilities represent amounts that are expected to be refunded to customers in future periods through rates, amounts collected from customers in advance of costs being incurred, or to be paid to cover future abandonment costs and for future removal and site restoration costs as approved by the regulator. If there are changes in our assessment of the probability of recovery for a regulatory asset, we reduce its carrying amount to the balance that we expect to recover from customers in future periods through rates. If a regulator later excludes from allowable costs all or a part of costs that were capitalized as a regulatory asset, we reduce the carrying amount of the asset by the excluded amounts.
The recognition of regulatory assets and liabilities is based on the actions, or expected future actions, of the regulator. To the extent that the regulator's actions differ from our expectations, the timing and amount of recovery or settlement of regulatory balances could differ significantly from those recorded. In the absence of rate regulation, we would generally not recognize regulatory assets or liabilities and the earnings impact would be recorded in the period the expenses are incurred or revenues are earned. A regulatory asset or liability is recognized in respect of deferred income taxes when it is expected the amounts will be recovered or settled through future regulator-approved rates. We believe that the recovery of our regulatory assets as at December 31, 2025 is probable over the periods described in Note 7 - Regulatory Matters.
During the fourth quarter of 2023, Southern Lights Pipeline completed an open season to negotiate new transportation service agreements. We did not renew the agreements under a cost-of-service toll methodology, therefore Southern Lights Pipeline was no longer subject to rate-regulated accounting. As a result, the related regulatory liabilities, regulatory tax assets and associated regulatory deferred tax liabilities were derecognized in 2023.
We collect and set aside funds to cover future pipeline abandonment costs for all CER-regulated pipelines in accordance with the Land Matters Consultation Initiative (LMCI), to fund future pipeline decommissioning costs in the state of Minnesota and to satisfy retirement obligations as Wexpro properties are abandoned. The funds collected are held in trusts in accordance with applicable regulations. The funds collected from customers are reported within Operating revenues in the Consolidated Statements of Earnings and Restricted long-term investments and cash in the Consolidated Statements of Financial Position. Concurrently, for LMCI, we reflect the future abandonment cost as an increase to Operating and administrative expense in the Consolidated Statements of Earnings and Other long-term liabilities in the Consolidated Statements of Financial Position.
An allowance for funds used during construction (AFUDC) is included in the cost of property, plant and equipment and is depreciated over future periods as part of the total cost of the related asset. AFUDC includes both an interest component and, if approved by the regulator, a cost of equity component, which are both capitalized based on rates set out in a regulatory agreement. The corresponding impact on earnings is included in Interest expense for the interest component and Other income/(expense) for the equity component. In the absence of rate regulation, we would capitalize interest using a capitalization rate based on our cost of borrowing, whereas the capitalized equity component, the corresponding earnings during the construction phase and the subsequent depreciation relating to the equity component would not be recognized. The equity component of AFUDC is included as a non-cash reconciling item to earnings within Cash Flows from Operating Activities in the Consolidated Statements of Cash Flows.
Under the pool method prescribed by certain regulators, it is not possible to identify the carrying value of the equity component of AFUDC or its effect on depreciation. Similarly, gains and losses on the retirement of certain specific fixed assets in any given year cannot be identified or quantified.
With the approval of regulators, certain operations capitalize a portion of specified operating costs. These operations are authorized to charge depreciation and earn a return on the net book value of such capitalized costs in future years. In the absence of rate regulation, a portion of such operating costs would be charged to earnings in the year incurred.
For certain regulated operations to which US GAAP guidance for phase-in plans applies, negotiated depreciation rates recovered in transportation tolls may be less than the depreciation expense calculated in accordance with US GAAP in early years of long-term contracts but recovered in future periods when tolls exceed depreciation. Depreciation expense on such assets is recorded in accordance with US GAAP and no regulatory asset is recorded.
REVENUE RECOGNITION
For businesses that are not rate-regulated, revenues are recorded when products have been delivered or services have been performed, the amount of revenue can be reliably measured and collectability is reasonably assured. Customer creditworthiness is assessed prior to agreement signing and throughout the contract duration. Certain revenues from our liquids and natural gas pipeline businesses are recognized under the terms of committed delivery contracts, rather than the cash tolls received.
Long-term take-or-pay contracts, under which shippers are obligated to pay fixed amounts ratably over the contract period regardless of volumes shipped, may contain make-up rights. Make-up rights are earned by shippers when minimum volume commitments are not utilized during the period but under certain circumstances can be used to offset overages in future periods, subject to expiry. We recognize revenues associated with make-up rights at the earlier of when the make-up volume is shipped, the make-up right expires, or when it is determined that the likelihood that the shipper will utilize the make-up right is remote. We also have long-term contracts where the revenue profile does not align with the cash receipt schedule, resulting in the recognition of deferred revenue.
Certain offshore pipeline transportation contracts require us to provide transportation services for the life of the underlying producing fields. Under these arrangements, shippers pay us a fixed monthly toll for a defined period of time which may be shorter than the estimated reserve life of the underlying producing fields, resulting in a contract period which extends past the period of cash collection. Fixed monthly toll revenues are recognized ratably over the committed volume made available to shippers throughout the contract period, regardless of when cash is received.
For rate-regulated businesses, revenues are recognized in a manner that is consistent with the underlying agreements as approved by the regulators. Natural gas utility revenues are generally recorded based on regular meter readings and estimates of customer usage from the last meter reading to the end of the reporting period. Estimates are based on historical consumption patterns and heating degree days experienced. Heating degree days is a measure of coldness that is indicative of volumetric requirements for natural gas utilized for heating purposes in our distribution franchise areas.
Certain of our US gas utilities have a revenue decoupling mechanism, referred to as a Customer Usage Tracker (CUT) or Conservation Enabling Tariff (CET), which allows for the collection of an allowed monthly revenue per customer and promotes energy conservation. Under the mechanism, non-gas revenues are decoupled from the temperature-adjusted usage per customer. The difference between actual revenue and the allowed monthly revenue per customer is recorded as a regulatory asset or liability and recovered from, or refunded to, customers through periodic rate adjustments.
Amounts deferred under the CUT or CET arise due to specific arrangements with the regulators rather than customers and represent alternative revenue programs. Revenue from alternative revenue programs is recorded within Operating revenues in the Consolidated Statements of Earnings in the month the related adjustments are deferred and is presented as Other revenues not from contracts with customers when disaggregated in Note 4 - Revenue.
Our crude oil, natural gas and power marketing businesses enter into commodity purchase and sale arrangements that are recorded on a gross basis as we are acting as the principal in the transactions.
No non-affiliated customer exceeded 10.0% of our third-party revenues for the years ended December 31, 2025, 2024 and 2023.
DERIVATIVE INSTRUMENTS AND HEDGING
Non-qualifying Derivatives
Non-qualifying derivative instruments are used primarily to mitigate foreign exchange, interest rate and commodity price earnings exposure. Non-qualifying derivatives are measured at fair value with changes in fair value recognized in earnings in Commodity sales, Transportation and other services revenues, Commodity costs, Operating and administrative expense, Other income/(expense) and Interest expense.
Derivatives in Qualifying Hedging Relationships
We use derivative financial instruments to manage our exposure to changes in commodity prices, foreign exchange rates and interest rates. Hedge accounting is optional and requires us to document the hedging relationship and test the hedging item's effectiveness in offsetting changes in fair values or cash flows of the underlying hedged item on an ongoing basis. We present the earnings effects of hedging items with the hedged transaction. Derivatives in qualifying hedging relationships are categorized as cash flow hedges, fair value hedges or net investment hedges.
Cash Flow Hedges
We may use cash flow hedges to manage our exposure to changes in commodity prices, foreign exchange rates and interest rates. The change in the fair value of a cash flow hedging instrument is recorded in Other comprehensive income/(loss) (OCI) and is reclassified to earnings when the hedged item impacts earnings.
If a derivative instrument designated as a cash flow hedge ceases to be effective or is terminated, hedge accounting is discontinued and the gain or loss at that date is deferred in OCI and recognized in earnings concurrently with the related transaction. If an anticipated hedged transaction is no longer probable, the gain or loss is recognized immediately in earnings. Subsequent gains and losses from derivative instruments for which hedge accounting has been discontinued are recognized in earnings in the period in which they occur.
Fair Value Hedges
We may use fair value hedges to hedge the fair value of debt instruments. The change in the fair value of the hedging instrument is recorded in earnings with changes in the fair value of the hedged risk of the asset or liability that is designated as part of the hedging relationship. If a fair value hedge is discontinued or ceases to be effective, the hedged risk of the asset or liability ceases to be remeasured at fair value and the cumulative fair value adjustment to the carrying value of the hedged item is recognized in earnings over the remaining life of the hedged item.
Net Investment Hedges
Gains and losses arising from the translation of our net investment in foreign operations from their functional currencies to Enbridge's Canadian dollar presentation currency are included in cumulative translation adjustments (CTA), a component of OCI. We currently have designated a portion of our US dollar-denominated debt, as well as a portfolio of foreign exchange forward contracts in prior periods, as a hedge of our net investment in US dollar-denominated investments and subsidiaries. As a result, the change in fair value of the foreign currency derivatives, as well as the translation of US dollar-denominated debt, are reflected in OCI. Amounts recognized previously in Accumulated other comprehensive income/(loss) (AOCI) are reclassified to earnings when there is a reduction of the hedged net investment resulting from the disposal of a foreign operation.
Classification of Derivatives
We recognize the fair value of derivative instruments in the Consolidated Statements of Financial Position as current and non-current assets or liabilities depending on the timing of settlements and the resulting cash flows associated with the instruments. Fair value amounts related to cash flows occurring beyond one year are classified as non-current.
Cash inflows and outflows related to derivative instruments are classified as Cash Flows from Operating and Financing Activities in the Consolidated Statements of Cash Flows.
Balance Sheet Offset
Assets and liabilities arising from derivative instruments may be offset in the Consolidated Statements of Financial Position when we have the legal right and intention to settle them on a net basis.
TRANSACTION COSTS
Transaction costs are incremental costs directly related to the acquisition of a financial asset or the issuance of a financial liability. We incur transaction costs primarily from the issuance of debt and account for these costs as a reduction to Long-term debt in the Consolidated Statements of Financial Position. These costs are amortized using the effective interest rate method over the term of the related debt instrument and are recorded in Interest expense.
EQUITY INVESTMENTS
Equity investments over which we exercise significant influence, but do not have controlling financial interests, are accounted for using the equity method. These investments are initially measured at cost and are adjusted for our proportionate share of undistributed equity earnings or loss. Our equity investments are increased for contributions made to, and decreased for distributions received from, the investee. To the extent an equity investee undertakes activities necessary to commence its planned principal operations, we capitalize interest costs associated with the investment during such period.
RESTRICTED LONG-TERM INVESTMENTS AND CASH
Long-term investments and cash that are restricted as to withdrawal or usage, for the purposes of funding pipeline abandonment in accordance with the CER's LMCI, to cover future pipeline decommissioning costs in the state of Minnesota, and to satisfy retirement obligations as Wexpro properties are abandoned, are presented as Restricted long-term investments and cash in the Consolidated Statements of Financial Position.
Cash and cash equivalents that are restricted as to withdrawal or usage for the purposes of the CER's LMCI or in accordance with specific commercial and debt arrangements are presented as Restricted cash in the Consolidated Statements of Financial Position.
OTHER INVESTMENTS
Generally, we classify equity investments in entities over which we do not exercise significant influence and that do not have readily determinable fair values as other investments measured using the fair value measurement alternative (FVMA). These investments are recorded at cost less impairment, if any, and adjusted for the impact of observable price changes occurring in orderly transactions for an identical or similar investment of the same issuer. Investments in equity securities measured using the FVMA are reviewed for impairment each reporting period and written down to their fair value if objective evidence of impairment is identified.
Equity investments with readily determinable fair values are measured at fair value through earnings. Dividends received from investments in equity securities are recognized in earnings when the right to receive payment is established. Investments in debt securities are classified as available-for-sale and measured at fair value through OCI.
NONCONTROLLING INTERESTS
NCI represent ownership interests attributable to third parties in certain consolidated subsidiaries. The portion of equity not owned by us in such entities is reflected as NCI within the equity section of the Consolidated Statements of Financial Position and, in the case of Redeemable NCI, within the mezzanine equity section of the Consolidated Statements of Financial Position between long-term liabilities and equity.
INCOME TAXES
Income taxes are accounted for using the liability method. Deferred income tax assets and liabilities are recorded based on temporary differences between the tax bases of assets and liabilities and their carrying values for accounting purposes. Deferred income tax assets and liabilities are measured using the tax rate that is expected to apply when the temporary differences reverse. For our regulated operations, a deferred income tax liability or asset is recognized with a corresponding regulatory asset or liability, respectively, to the extent that taxes can be recovered through rates. Any interest and/or penalty incurred related to tax is reflected in Income tax expense.
FOREIGN CURRENCY TRANSACTIONS AND TRANSLATION
Foreign currency transactions are those transactions whose terms are denominated in a currency other than the currency of the primary economic environment in which Enbridge or a reporting subsidiary operates, referred to as the functional currency. Transactions denominated in foreign currencies are translated to the functional currency using the exchange rate prevailing at the date of the transaction. Monetary assets and liabilities denominated in foreign currencies are translated to the functional currency using the exchange rate in effect as at the balance sheet date. Exchange gains and losses resulting from the translation of monetary assets and liabilities are included in earnings in the period in which they arise.
Gains and losses arising from the translation of foreign operations' functional currencies to our Canadian dollar presentation currency are included in the CTA component of AOCI and are recognized in earnings upon sale of the foreign operation. Asset and liability accounts are translated at the exchange rates in effect as at the balance sheet date, while revenues and expenses are translated using monthly average exchange rates.
CASH AND CASH EQUIVALENTS
Cash and cash equivalents include short-term investments with a term to maturity of three months or less when purchased.
LOANS AND RECEIVABLES
Long-term notes receivable from affiliates are measured at amortized cost using the effective interest rate method, net of any impairment losses recognized. Trade receivables and unbilled revenues are measured at cost. Interest income is recognized in earnings as it is earned with the passage of time.
CURRENT EXPECTED CREDIT LOSSES
For accounts receivable, a loss allowance matrix is utilized to measure lifetime expected credit losses. The matrix contemplates historical credit losses by age of receivables, adjusted for any forward-looking information and management expectations. Other loan receivables and applicable off-balance sheet commitments utilize a discounted cash flow methodology which calculates the current expected credit losses based on historical default probability rates associated with the credit rating of the counterparty and the related term of the loan or commitment, adjusted for forward-looking information and management expectations. Trade receivables and unbilled revenues are presented net of allowance for expected credit losses of $115 million and $119 million as at December 31, 2025 and 2024, respectively.
NATURAL GAS IMBALANCES
The Consolidated Statements of Financial Position include balances resulting from differences in gas volumes received from, and delivered for, customers. As settlement of certain imbalances is in-kind, changes in the balances do not have an effect on our Consolidated Statements of Earnings or Consolidated Statements of Cash Flows. Most natural gas volumes owed to or by us are valued at natural gas market index prices as at the balance sheet dates.
INVENTORY
Inventory is comprised of natural gas held in storage by businesses in our Gas Distribution and Storage and Gas Transmission segments, crude oil and natural gas held by our crude oil and natural gas marketing businesses, and materials and supplies. Natural gas held in storage by our Gas Distribution and Storage businesses is recorded at the prices approved by the regulators in the determination of distribution rates. The actual price of gas purchased may differ from the regulator approved price. The difference between the approved price and the actual cost of gas purchased is deferred as a liability for future refund, or as an asset for collection, as approved by the regulators.
Commodity inventory held by our crude oil and natural gas marketing businesses is recorded at the lower of cost, as determined on a weighted average basis, or market value. Upon disposition, commodity inventory is recorded to Commodity costs in the Consolidated Statements of Earnings at the weighted average cost of inventory, including any adjustments recorded to reduce inventory to market value. Materials and supplies inventory is recorded at the lower of average cost or net realizable value.
PROPERTY, PLANT AND EQUIPMENT
Property, plant and equipment is recorded at historical cost. Expenditures for construction, expansion, major renewals and betterments are capitalized. Maintenance and repair costs are expensed as incurred. Expenditures for project development are capitalized if they are expected to have future benefit. We capitalize interest incurred during construction for non-rate-regulated assets. For rate-regulated assets, AFUDC is included in the cost of property, plant and equipment and is depreciated over future periods as part of the total cost of the related asset.
Two primary methods of depreciation are utilized. For distinct assets, depreciation is generally provided on a straight-line basis over the estimated useful life of the asset commencing when it is placed in service. For largely homogeneous groups of assets with comparable useful lives, the pool method of accounting is followed whereby similar assets are grouped and depreciated as a pool. When group assets are retired or otherwise disposed of, gains and losses are generally not reflected in earnings but are booked as an adjustment to accumulated depreciation.
The successful efforts method of accounting is used for cost-of-service reserves developed and produced by Wexpro for gas utility affiliates, Enbridge Gas Utah, Enbridge Gas Wyoming, and Enbridge Gas Idaho. Cost-of-service reserves are properties for which the operations and return on investment are subject to the Wexpro Agreements. Under the successful efforts method, Wexpro capitalizes the costs of acquiring leaseholds, drilling development wells, drilling successful exploratory wells, and purchasing related support equipment and facilities. Geological and geophysical studies are expensed as incurred. Capitalized costs of development wells and leaseholds are amortized on a field-by-field basis using the unit-of-production method and the estimated proved developed or total proved natural gas and crude oil reserves.
LEASES
We recognize an arrangement as a lease when a lessee has the right to obtain substantially all of the economic benefits from the use of an asset, as well as the right to direct the use of the asset. At inception, we review the facts and circumstances of the arrangement to classify lease assets as operating or finance leases under Topic 842, Leases. The initial measurement of both types of leases results in recognition of right-of-use (ROU) assets and the related lease liabilities in the Consolidated Statements of Financial Position for lease arrangements with a term of 12 months or longer.
For finance leases, a lessee amortizes the ROU asset and accretes the lease liability using the effective interest method. Operating leases result in the recognition of a single lease expense amount that is recorded on a straight-line basis. All ROU assets are assessed for impairment using the same approach applied for other long-lived assets.
We do not separate non-lease components from the associated lease components of our lessee contracts and account for both components as a single lease component. We combine lease and non-lease components within a contract for operating lessor leases when certain conditions are met.
Lease liabilities and ROU assets require the use of judgment and estimates which are applied in determining the term of a lease, appropriate discount rates, whether an arrangement contains a lease, whether there are any indicators of impairment for ROU assets and whether any ROU assets should be grouped with other long-lived assets for impairment testing. The lease term may include periods associated with options to extend or terminate the lease if it is reasonably certain the options will be exercised.
DEFERRED AMOUNTS AND OTHER ASSETS
Deferred amounts and other assets primarily consists of costs that regulatory authorities have permitted, or are expected to permit, to be recovered through future rates (Note 7), overfunded defined benefit pension and OPEB plan assets (Note 25), operating lease ROU assets (Note 26) and long-term gross derivative asset balances (Note 23).
INTANGIBLE ASSETS
Intangible assets consist primarily of certain software costs, customer relationships and biogas rights agreements. We capitalize costs incurred during the application development stage of internal use software projects. Customer relationships represent the underlying relationship from long-term agreements with customers that are capitalized upon acquisition. Biogas rights agreements are long-term gas supply agreements with landfill owners of our landfill gas-to-RNG production facilities that are capitalized upon acquisition. Intangible assets are generally amortized on a straight-line basis over their expected lives, commencing when the asset is available for use.
GOODWILL
Goodwill represents the excess of the purchase price over the fair value of net identifiable assets upon acquisition of a business. The carrying value of goodwill, which is not amortized, is assessed for impairment annually or more frequently if events or changes in circumstances arise that suggest the carrying value of goodwill may be impaired. We perform our annual review of the goodwill balance on April 1.
We perform our annual review for impairment at the reporting unit level, which is identified by assessing whether the components of our operating segments constitute businesses for which discrete information is available, whether segment management regularly reviews the operating results of those components, and whether the economic and regulatory characteristics are similar. Our reporting units are Liquids Pipelines, Gas Transmission, Gas Distribution and Storage, and Renewable Power Generation.
We have the option to first assess qualitative factors to determine whether it is necessary to perform the quantitative goodwill impairment assessment. When performing a qualitative assessment, we determine the drivers of fair value for each reporting unit and evaluate whether those drivers have been positively or negatively affected by relevant events and circumstances since the last fair value assessment. Our evaluation includes, but is not limited to, the assessment of macroeconomic trends (including the impact of changes in discount rates and rate base multiple), changes to regulatory environments, capital accessibility, operating income trends (including changes to projected cash flows from operations, expected future capital expenditures and forecasted rate base), and changes to industry conditions. Based on our assessment of qualitative factors, if we determine it is more likely than not that the fair value of the reporting unit is less than its carrying amount, a quantitative goodwill impairment assessment is performed.
The quantitative goodwill impairment assessment involves determining the fair value of our reporting units and comparing those values to the carrying value of each reporting unit. If the carrying value of a reporting unit, including allocated goodwill, exceeds its fair value, goodwill impairment is measured at the amount by which the reporting unit's carrying value exceeds its fair value. This amount should not exceed the carrying amount of goodwill. The fair value of our reporting units is estimated using either a discounted cash flow technique or a combination of discounted cashflow and earnings multiples techniques. The determination of fair value using the discounted cash flow technique requires the use of estimates and assumptions related to discount rates, projected operating income, expected future capital expenditures, as well as terminal value growth rates for the Liquids Pipelines, Gas Transmission, and Renewable Power Generation reporting units, and projected regulatory rate base and rate base multiple for the Gas Distribution and Storage reporting unit. The determination of fair value using the earnings multiples technique requires assumptions to be made in relation to maintainable earnings and earnings multiples.
The allocation of goodwill to held-for-sale and disposed businesses is based on the relative fair value of businesses included in the relevant reporting unit.
On April 1, 2025, we performed our annual goodwill impairment assessment which consisted of a qualitative assessment for the Liquids Pipelines and Renewable Power Generation reporting units and did not identify any impairment indicators. We also chose to perform a quantitative assessment for the Gas Transmission and Gas Distribution and Storage reporting units which did not result in the recognition of any impairment charges. No indicators of goodwill impairment were identified during the remainder of 2025.
IMPAIRMENT
We review the carrying values of our long-lived assets as events or changes in circumstances warrant. If it is determined that the carrying value of an asset exceeds its expected undiscounted cash flows, we will calculate fair value based on the discounted cash flows and write the asset down to the extent that the carrying value exceeds the fair value.
With respect to investments in debt securities and equity investments, we assess at each balance sheet date whether there is objective evidence that a financial asset is impaired by completing a qualitative or quantitative analysis of factors impacting the investment. If there is objective evidence of impairment, we value the expected discounted cash flows using observable market inputs. We determine whether the decline below carrying value is other-than-temporary for equity investments or is due to a credit loss for investments in debt securities. If the decline is determined to be other-than-temporary for equity investments or is due to a credit loss for investments in debt securities, an impairment charge is recorded in earnings with an offsetting reduction to the carrying value of the investment.
ASSET RETIREMENT OBLIGATIONS
ARO associated with the retirement of long-lived assets are measured at fair value and recognized as Other current liabilities or Other long-term liabilities in the period in which they can be reasonably determined. Fair value approximates the cost a third party would charge to perform the tasks necessary to retire such assets and is recognized at the present value of expected future cash flows. ARO is added to the carrying value of the associated asset and depreciated over the asset's useful life. The corresponding liability is accreted over time through charges to earnings and is reduced by actual costs of decommissioning and reclamation. Our estimates of retirement costs could change as a result of changes in cost estimates and regulatory requirements. Currently, for the majority of our assets, it is not possible to make a reasonable estimate of ARO due to the indeterminate timing and scope of the asset retirements.
PENSION AND OTHER POSTRETIREMENT BENEFITS
We sponsor defined benefit and defined contribution pension plans, as well as defined benefit OPEB plans.
Obligations and net periodic benefit costs for defined benefit pension and OPEB plans are estimated using the projected unit credit method, which is based on years of service, as well as our best estimates of actuarial assumptions such as discount rates, future salary levels, other cost escalations, employees' retirement ages, and mortality.
We determine discount rates using market yields of high-quality corporate bonds with maturities that approximate the estimated timing of future benefit payments.
Plan assets are measured at fair value. The expected return on plan assets is determined using the long-term target asset mixes in our investment policies and long-term market expectations.
Actuarial gains and losses arise from the difference between the actual and expected return on plan assets, and changes in actuarial assumptions such as discount rates. Periodic net actuarial gains and losses and prior service costs are accumulated and presented as follows in the Consolidated Statements of Financial Position:
•as a component of AOCI; or
•as a component of Deferred amounts and other assets and/or Other long-term liabilities for certain utilities' defined benefit pension plans and OPEB plans, to the extent that the net actuarial gains and losses and prior service costs have been permitted or are expected to be permitted by the regulators, to be recovered through future rates.
Net periodic benefit cost is recognized in earnings and includes:
•expected return on plan assets;
•amortization of prior service costs over the expected average remaining service life of the plans' active employee group; and
•amortization of net actuarial gains and losses in excess of 10% of the greater of the benefit obligation or the fair value of plan assets over the expected average remaining service life of the plans' active employee group.
Our utility operations also record regulatory adjustments for the difference between net periodic benefit costs for accounting versus ratemaking purposes. Offsetting regulatory assets or liabilities are recorded to the extent net periodic benefit costs are expected to be recovered from or refunded to customers, respectively, in future rates. In the absence of rate regulation, regulatory assets or liabilities would not be recorded and net periodic benefit costs would be charged to earnings and OCI on an accrual basis.
For defined contribution plans, our contributions are expensed when they occur.
STOCK-BASED COMPENSATION
Incentive stock options (ISO) granted are recorded using the fair value method. Under this method, compensation expense is measured at the grant date based on the fair value of the ISO granted as calculated by the Black-Scholes-Merton model and is recognized on a straight-line basis over the shorter of the vesting period or the period to early retirement eligibility, with a corresponding credit to Additional paid-in capital. Balances in Additional paid-in capital are transferred to Share capital when the options are exercised.
Performance stock units (PSU) and certain RSUs are cash-settled awards for which the related liability is remeasured each reporting period. PSUs vest at the completion of a three-year term and RSUs vest one-third annually from the grant date. During the vesting term, compensation expense is recorded based on the number of units outstanding and the current market price of Enbridge's common shares with an offset to Other current liabilities or Other long-term liabilities. The value of the PSUs is also dependent on our performance relative to targets set out under the plan. We also award share-settled RSUs to certain non-executive senior management employees which vest at the completion of a three-year term. Share-settled RSUs are also granted to non-executive employees, which vest either one-third annually from the grant date, or following a 12-month period. During the vesting term, compensation expense is recorded based on the number of units granted and the market price of Enbridge's common shares on the day immediately preceding the grant date, with an offset to Additional paid-in capital. There is no associated liability recorded for share-settled awards.
COMMITMENTS, CONTINGENCIES AND ENVIRONMENTAL LIABILITIES
We expense or capitalize, as appropriate, expenditures for ongoing compliance with environmental regulations that relate to past or current operations. We expense costs incurred for remediation of existing environmental contamination caused by past operations that do not benefit future periods by preventing or eliminating future contamination. We record liabilities for environmental matters when assessments indicate that remediation efforts are probable and the costs can be reasonably estimated. Estimates of environmental liabilities are based on currently available facts, existing technology and presently enacted laws and regulations, taking into consideration the likely effects of inflation and other factors. These amounts also consider prior experience in remediating contaminated sites, other companies' clean-up experience and data released by government organizations. Our estimates are subject to revision in future periods based on actual costs or new information and are included in Other current liabilities and Other long-term liabilities in the Consolidated Statements of Financial Position at their undiscounted amounts. There is always a potential of incurring additional costs in connection with environmental liabilities due to variations in any or all of the categories described above, including modified or revised requirements from regulatory agencies, in addition to fines and penalties, as well as expenditures associated with litigation and settlement of claims. We evaluate recoveries from insurance coverage separately from the liability and, when recovery is probable, we record and report an asset separately from the associated liability in the Consolidated Statements of Financial Position.
Liabilities for other commitments and contingencies are recognized when, after fully analyzing available information, we determine it is either probable that an asset has been impaired or that a liability has been incurred, and the amount of impairment or loss can be reasonably estimated. When a range of probable loss can be estimated, we recognize the most likely amount, or if no amount is more likely than another, the minimum of the range of probable loss is accrued. We expense legal costs associated with loss contingencies as such costs are incurred.
3. CHANGES IN ACCOUNTING POLICIES
The following policy became significant to Enbridge on July 2, 2025:
Noncontrolling Interests
NCI represent ownership interests attributable to third parties in certain consolidated subsidiaries. The portion of equity not owned by us in such entities is reflected as NCI within the equity section of the Consolidated Statements of Financial Position and, in the case of Redeemable NCI, within the mezzanine equity section of the Consolidated Statements of Financial Position between long-term liabilities and equity.
Westcoast Energy Limited Partnership’s (Westcoast LP) Class A noncontrolling unitholder has the option, exercisable at any time from and after July 2, 2035, to require the Class B and Class C unitholders of Westcoast LP to redeem all of the Class A units for cash at the then-current fair value, subject to certain limitations. On a quarterly basis, the Redeemable NCI carrying amount of the Class A units is recognized at the higher of the amount resulting from the application of Accounting Standards Codification (ASC) 810 Consolidation and the estimated current redemption value, with measurement adjustments to the carrying amount of Redeemable NCI recognized in retained earnings (redemption value adjustment). The measurement adjustments to Redeemable NCI that are recognized in retained earnings impact our earnings per common share (Note 6). The estimated current redemption value is determined using the income approach, with key assumptions being forecasted cash flows and market participant discount rate.
ADOPTION OF NEW ACCOUNTING STANDARDS
Income Tax Disclosures
Effective January 1, 2025, we adopted Accounting Standards Update (ASU) 2023-09 on a retrospective basis beginning on January 1, 2023. The standard was issued in December 2023 to improve tax disclosures by requiring specified categories in the annual rate reconciliation that meet quantitative thresholds and further disaggregation on income taxes paid by jurisdiction. Upon adoption of the ASU, we have amended the presentation of Note 24 - Income Taxes to align with the new standard.
FUTURE ACCOUNTING POLICY CHANGES
Disaggregation of Income Statement Expenses
ASU 2024-03 was issued in November 2024 to improve financial reporting by requiring entities to disclose additional information about specific expense categories in the notes to financial statements at interim and annual reporting periods. The ASU requires entities to disclose 1) the amounts of (a) purchases of inventory, (b) employee compensation, (c) depreciation, (d) intangible asset amortization, (e) depreciation, depletion and amortization recognized as part of oil and gas producing activities, (f) expense reimbursements included in a relevant expense caption, and (g) selling expenses, and 2) a qualitative description of the amounts remaining in relevant expense captions that are not separately disaggregated quantitatively. ASU 2024-03 is effective January 1, 2027, with interim period disclosure requirements effective after January 1, 2028 and can be applied either prospectively or retrospectively. The additional note disclosures will be included in our December 31, 2027 annual consolidated financial statements and in our interim financial statements beginning in 2028.
4. REVENUE
REVENUE FROM CONTRACTS WITH CUSTOMERS
Major Products and Services
|
|
|
|
|
|
|
|
|
|
|
|
|
|
|
|
|
|
|
Year ended December 31, 2025 |
Liquids
Pipelines |
|
Gas Transmission |
|
Gas Distribution and Storage |
|
Renewable Power Generation |
|
Eliminations
and Other |
|
Consolidated |
|
(millions of Canadian dollars) |
|
|
|
|
|
|
|
|
|
|
|
|
Transportation revenue |
|
11,924 |
|
|
5,608 |
|
|
250 |
|
|
— |
|
|
— |
|
|
17,782 |
|
Storage and other revenue |
|
289 |
|
|
663 |
|
|
586 |
|
|
— |
|
|
— |
|
|
1,538 |
|
Gas distribution sales |
|
— |
|
|
— |
|
|
9,610 |
|
|
— |
|
|
— |
|
|
9,610 |
|
Electricity revenue |
|
— |
|
|
— |
|
|
— |
|
|
232 |
|
|
— |
|
|
232 |
|
Commodity sales |
|
— |
|
|
137 |
|
|
30 |
|
|
— |
|
|
— |
|
|
167 |
|
Total revenue from contracts with customers |
|
12,213 |
|
|
6,408 |
|
|
10,476 |
|
|
232 |
|
|
— |
|
|
29,329 |
|
Commodity sales |
|
33,418 |
|
|
164 |
|
|
— |
|
|
— |
|
|
1,432 |
|
|
35,014 |
|
Other revenue1,2 |
|
313 |
|
|
59 |
|
|
157 |
|
|
322 |
|
|
— |
|
|
851 |
|
Intersegment revenue |
|
— |
|
|
21 |
|
|
21 |
|
|
7 |
|
|
(49 |
) |
|
— |
|
Total revenue |
|
45,944 |
|
|
6,652 |
|
|
10,654 |
|
|
561 |
|
|
1,383 |
|
|
65,194 |
|
|
|
|
|
|
|
|
|
|
|
|
|
|
|
|
|
|
|
|
Year ended December 31, 2024 |
Liquids
Pipelines |
|
Gas Transmission |
|
Gas Distribution and Storage |
|
Renewable Power Generation |
|
Eliminations
and Other |
|
Consolidated |
|
(millions of Canadian dollars) |
|
|
|
|
|
|
|
|
|
|
|
|
Transportation revenue |
|
11,958 |
|
|
5,279 |
|
|
237 |
|
|
— |
|
|
— |
|
|
17,474 |
|
Storage and other revenue |
|
255 |
|
|
573 |
|
|
493 |
|
|
— |
|
|
— |
|
|
1,321 |
|
Gas distribution sales |
|
— |
|
|
— |
|
|
6,746 |
|
|
— |
|
|
— |
|
|
6,746 |
|
Electricity revenue |
|
— |
|
|
— |
|
|
— |
|
|
189 |
|
|
— |
|
|
189 |
|
Commodity sales |
|
— |
|
|
158 |
|
|
— |
|
|
— |
|
|
— |
|
|
158 |
|
Total revenue from contracts with customers |
|
12,213 |
|
|
6,010 |
|
|
7,476 |
|
|
189 |
|
|
— |
|
|
25,888 |
|
Commodity sales |
|
25,689 |
|
|
99 |
|
|
— |
|
|
— |
|
|
1,072 |
|
|
26,860 |
|
Other revenue1,2 |
|
281 |
|
|
70 |
|
|
55 |
|
|
319 |
|
|
— |
|
|
725 |
|
Intersegment revenue |
|
— |
|
|
20 |
|
|
11 |
|
|
6 |
|
|
(37 |
) |
|
— |
|
Total revenue |
|
38,183 |
|
|
6,199 |
|
|
7,542 |
|
|
514 |
|
|
1,035 |
|
|
53,473 |
|
|
|
|
|
|
|
|
|
|
|
|
|
|
|
|
|
|
|
|
Year ended December 31, 2023 |
Liquids
Pipelines |
|
Gas Transmission |
|
Gas Distribution and Storage |
|
Renewable Power Generation |
|
Eliminations
and Other |
|
Consolidated |
|
(millions of Canadian dollars) |
|
|
|
|
|
|
|
|
|
|
|
|
Transportation revenue |
|
11,875 |
|
|
5,302 |
|
|
148 |
|
|
— |
|
|
— |
|
|
17,325 |
|
Storage and other revenue |
|
257 |
|
|
461 |
|
|
352 |
|
|
— |
|
|
— |
|
|
1,070 |
|
Gas distribution sales |
|
— |
|
|
— |
|
|
5,426 |
|
|
— |
|
|
— |
|
|
5,426 |
|
Electricity revenue |
|
— |
|
|
— |
|
|
— |
|
|
259 |
|
|
— |
|
|
259 |
|
Commodity sales |
|
— |
|
|
17 |
|
|
— |
|
|
— |
|
|
— |
|
|
17 |
|
Total revenue from contracts with customers |
|
12,132 |
|
|
5,780 |
|
|
5,926 |
|
|
259 |
|
|
— |
|
|
24,097 |
|
Commodity sales |
|
17,494 |
|
|
— |
|
|
— |
|
|
— |
|
|
1,470 |
|
|
18,964 |
|
Other revenue1,2 |
|
257 |
|
|
72 |
|
|
44 |
|
|
215 |
|
|
— |
|
|
588 |
|
Intersegment revenue |
|
(1 |
) |
|
2 |
|
|
6 |
|
|
3 |
|
|
(10 |
) |
|
— |
|
Total revenue |
|
29,882 |
|
|
5,854 |
|
|
5,976 |
|
|
477 |
|
|
1,460 |
|
|
43,649 |
|
1Includes realized and unrealized gains and losses from our hedging program which were net gains of $160 million and $23 million and a net loss of $97 million for the years ended December 31, 2025, 2024 and 2023, respectively.
2Includes revenues from lease contracts. Refer to Note 26 - Leases.
We disaggregate revenue into categories which represent our principal performance obligations within each business segment. These revenue categories represent the most significant revenue streams in each segment and consequently are considered to be the most relevant revenue information for management to consider in evaluating performance.
Contract Balances
|
|
|
|
|
|
|
|
|
|
|
Contract Receivables |
|
Contract
Assets |
|
Contract Liabilities |
|
(millions of Canadian dollars) |
|
|
|
|
|
|
Balance as at December 31, 2025 |
|
3,799 |
|
|
315 |
|
|
2,765 |
|
Balance as at December 31, 2024 |
|
3,764 |
|
|
330 |
|
|
2,828 |
|
Contract receivables represent the amount of receivables derived from contracts with customers.
Contract assets represent the amount of revenue which has been recognized in advance of payments received for performance obligations we have fulfilled (or have partially fulfilled) and prior to the point in time at which our right to payment is unconditional. Amounts included in contract assets are transferred to accounts receivable when our right to receive the consideration becomes unconditional.
Contract liabilities represent payments received for performance obligations which have not been fulfilled. Contract liabilities primarily relate to make-up rights and deferred revenues. Revenue recognized during the year ended December 31, 2025 included in contract liabilities at the beginning of the period was $455 million. Increases in contract liabilities from cash received, net of amounts recognized as revenues, during the year ended December 31, 2025 was $481 million.
Performance Obligations
|
|
Segment |
Nature of Performance Obligation |
Liquids Pipelines |
•Transportation and storage of crude oil and natural gas liquids (NGL) |
Gas Transmission |
•Transportation, storage, gathering, compression and treating of natural gas |
•Transportation of crude oil and NGL |
•Sale of renewable natural gas and its attached environmental attributes |
Gas Distribution and Storage |
•Supply and delivery of natural gas |
•Transportation of natural gas |
|
Renewable Power Generation |
•Generation and transmission of electricity |
•Delivery of electricity from renewable energy generation facilities |
There was no material revenue recognized in the year ended December 31, 2025 from performance obligations satisfied in previous periods.
Payment Terms
Payments are received monthly from customers under long-term transportation, commodity sales, and gas gathering and processing contracts. Payments from Gas Distribution and Storage customers are received on a continuous basis based on established billing cycles.
Certain contracts in our US offshore business provide for us to receive a series of fixed monthly payments (FMPs) for a specified period that is less than the period during which the performance obligations are satisfied. As a result, a portion of the FMPs are recorded as contract liabilities. The FMPs are not considered to be a financing arrangement as payments are scheduled to match the production profiles of offshore oil and gas fields, which generate greater revenue in the initial years of their productive lives.
Revenue to be Recognized from Unfulfilled Performance Obligations
The following table presents our estimated revenue allocated to remaining performance obligations for contracted revenue that has not yet been recognized, that is expected to be recognized in the following periods:
|
|
|
|
|
|
|
|
|
|
|
|
|
|
Total |
|
1 year |
|
2-5 years |
|
Thereafter |
|
(billions of Canadian dollars) |
|
|
|
|
|
|
|
|
Expected revenue |
|
59.1 |
|
|
9.7 |
|
|
24.6 |
|
|
24.8 |
|
The revenues excluded from the amounts above based on optional exemptions available under ASC 606, as explained below, represent a significant portion of our overall revenues and revenues from contracts with customers. Certain revenues such as flow-through operating costs charged to shippers are recognized at the amount for which we have the right to invoice our customers and are excluded from the amounts for revenues to be recognized in the future from unfulfilled performance obligations above. Variable consideration is excluded from the amounts above due to the uncertainty of the associated consideration, which is generally resolved when actual volumes and prices are determined. For example, we consider interruptible transportation service revenues to be variable revenues since volumes cannot be estimated. Additionally, the effect of escalation on certain tolls which are contractually escalated for inflation has not been reflected in the amounts above as it is not possible to reliably estimate future inflation rates. Revenues for periods extending beyond the current rate settlement term for regulated contracts where the tolls are periodically reset by the regulator are excluded from the amounts above since future tolls remain unknown. Finally, revenues from contracts with customers which have an original expected duration of one year or less are excluded from the amounts above.
SIGNIFICANT JUDGMENTS MADE IN RECOGNIZING REVENUE
Long-Term Transportation Agreements
For long-term transportation agreements, significant judgments pertain to the period over which revenue is recognized and whether the agreement provides for make-up rights for the shippers. Transportation revenue earned from firm contracted capacity arrangements is recognized ratably over the contract period. Transportation revenue from interruptible or volumetric-based arrangements is recognized when services are performed.
Variable Consideration
Revenue from arrangements subject to variable consideration is recognized only to the extent that it is probable that a significant reversal in the amount of cumulative revenue recognized will not occur when the uncertainty associated with the variable consideration is subsequently resolved. Uncertainties associated with variable consideration relate principally to differences between estimated and actual volumes and prices. These uncertainties are resolved each month when actual volumes are sold or transported and actual tolls and prices are determined.
On March 4, 2024, the CER approved the negotiated Mainline Tolling Settlement (MTS). The new tolls were finalized and were in effect on an interim basis on July 1, 2023, and the overall agreement is retroactively effective as of July 1, 2021 through to the end of 2028.
Recognition and Measurement of Revenues
|
|
|
|
|
|
|
|
|
|
|
|
|
|
|
|
Year ended December 31, 2025 |
Liquids
Pipelines |
|
Gas Transmission |
|
Gas Distribution and Storage |
|
Renewable Power Generation |
|
Consolidated |
|
(millions of Canadian dollars) |
|
|
|
|
|
|
|
|
|
|
Revenues from products transferred at a point in time |
|
— |
|
|
137 |
|
|
161 |
|
|
55 |
|
|
353 |
|
Revenues from products and services transferred over time1 |
|
12,213 |
|
|
6,271 |
|
|
10,315 |
|
|
177 |
|
|
28,976 |
|
Total revenue from contracts with customers |
|
12,213 |
|
|
6,408 |
|
|
10,476 |
|
|
232 |
|
|
29,329 |
|
|
|
|
|
|
|
|
|
|
|
|
|
|
|
|
|
Year ended December 31, 2024 |
Liquids
Pipelines |
|
Gas Transmission |
|
Gas Distribution and Storage |
|
Renewable Power Generation |
|
Consolidated |
|
(millions of Canadian dollars) |
|
|
|
|
|
|
|
|
|
|
Revenues from products transferred at a point in time |
|
— |
|
|
158 |
|
|
137 |
|
|
— |
|
|
295 |
|
Revenues from products and services transferred over time1 |
|
12,213 |
|
|
5,852 |
|
|
7,339 |
|
|
189 |
|
|
25,593 |
|
Total revenue from contracts with customers |
|
12,213 |
|
|
6,010 |
|
|
7,476 |
|
|
189 |
|
|
25,888 |
|
|
|
|
|
|
|
|
|
|
|
|
|
|
|
|
|
Year ended December 31, 2023 |
Liquids
Pipelines |
|
Gas Transmission |
|
Gas Distribution and Storage |
|
Renewable Power Generation |
|
Consolidated |
|
(millions of Canadian dollars) |
|
|
|
|
|
|
|
|
|
|
Revenues from products transferred at a point in time |
|
— |
|
|
17 |
|
|
138 |
|
|
— |
|
|
155 |
|
Revenues from products and services transferred over time1 |
|
12,132 |
|
|
5,763 |
|
|
5,788 |
|
|
259 |
|
|
23,942 |
|
Total revenue from contracts with customers |
|
12,132 |
|
|
5,780 |
|
|
5,926 |
|
|
259 |
|
|
24,097 |
|
1Revenue from crude oil and natural gas pipeline transportation, storage, natural gas gathering, compression and treating, natural gas distribution, natural gas storage services and electricity sales.
Performance Obligations Satisfied Over Time
For arrangements involving the transportation and sale of petroleum products and natural gas where the transportation services or commodities are simultaneously received and consumed by the shipper or customer, we recognize revenue over time using an output method based on volumes of commodities delivered or transported. The measurement of the volumes transported or delivered corresponds directly to the benefits received by the shippers or customers during that period.
Determination of Transaction Prices
Prices for transportation and gas processing services are determined based on the capital cost of the facilities, pipelines and associated infrastructure required to provide such services, plus a rate of return on capital invested that is determined either through negotiations with customers or through regulatory processes for those operations that are subject to rate regulation.
Prices for commodities sold are determined by reference to market price indices, plus or minus a negotiated differential and in certain cases a marketing fee.
Prices for natural gas sold and distribution services provided by regulated natural gas distribution operations are prescribed by regulation.
5. SEGMENTED INFORMATION
|
|
|
|
|
|
|
|
|
|
|
|
|
|
|
|
Year ended December 31, 2025 |
Liquids
Pipelines |
|
Gas
Transmission |
|
Gas
Distribution
and Storage1 |
|
Renewable
Power
Generation |
|
Total
Reportable
Segments |
|
(millions of Canadian dollars) |
|
|
|
|
|
|
|
|
|
|
Operating revenues2 |
|
45,944 |
|
|
6,652 |
|
|
10,654 |
|
|
561 |
|
|
63,811 |
|
Commodity and gas distribution costs |
|
(33,038 |
) |
|
(68 |
) |
|
(3,709 |
) |
|
2 |
|
|
(36,813 |
) |
Operating and administrative |
|
(4,440 |
) |
|
(2,252 |
) |
|
(3,030 |
) |
|
(332 |
) |
|
(10,054 |
) |
Impairment of long-lived assets |
|
(240 |
) |
|
— |
|
|
(330 |
) |
|
— |
|
|
(570 |
) |
Income from equity investments |
|
1,091 |
|
|
853 |
|
|
4 |
|
|
291 |
|
|
2,239 |
|
Other income |
|
79 |
|
|
306 |
|
|
220 |
|
|
98 |
|
|
703 |
|
Earnings before interest, income taxes and depreciation and amortization |
|
9,396 |
|
|
5,491 |
|
|
3,809 |
|
|
620 |
|
|
19,316 |
|
Eliminations and Other |
|
|
|
|
|
|
|
|
|
1,161 |
|
Depreciation and amortization |
|
|
|
|
|
|
|
|
|
(5,661 |
) |
Interest expense (Note 17) |
|
|
|
|
|
|
|
|
|
(5,023 |
) |
Earnings before income taxes |
|
|
|
|
|
|
|
|
|
9,793 |
|
|
|
|
|
|
|
|
|
|
|
|
|
|
|
|
|
Year ended December 31, 2024 |
Liquids
Pipelines |
|
Gas
Transmission |
|
Gas
Distribution
and Storage1 |
|
Renewable
Power
Generation |
|
Total
Reportable
Segments |
|
(millions of Canadian dollars) |
|
|
|
|
|
|
|
|
|
|
Operating revenues2 |
|
38,183 |
|
|
6,199 |
|
|
7,542 |
|
|
514 |
|
|
52,438 |
|
Commodity and gas distribution costs |
|
(25,283 |
) |
|
(130 |
) |
|
(2,501 |
) |
|
4 |
|
|
(27,910 |
) |
Operating and administrative |
|
(4,495 |
) |
|
(2,322 |
) |
|
(2,276 |
) |
|
(304 |
) |
|
(9,397 |
) |
Impairment of long-lived assets |
|
(2 |
) |
|
(162 |
) |
|
(3 |
) |
|
(23 |
) |
|
(190 |
) |
Income from equity investments |
|
1,051 |
|
|
812 |
|
|
3 |
|
|
455 |
|
|
2,321 |
|
Gain on disposition of equity investments (Note 13) |
|
— |
|
|
1,063 |
|
|
— |
|
|
28 |
|
|
1,091 |
|
Other income |
|
77 |
|
|
196 |
|
|
104 |
|
|
59 |
|
|
436 |
|
Earnings before interest, income taxes and depreciation and amortization |
|
9,531 |
|
|
5,656 |
|
|
2,869 |
|
|
733 |
|
|
18,789 |
|
Eliminations and Other |
|
|
|
|
|
|
|
|
|
(1,904 |
) |
Depreciation and amortization |
|
|
|
|
|
|
|
|
|
(5,167 |
) |
Interest expense (Note 17) |
|
|
|
|
|
|
|
|
|
(4,419 |
) |
Earnings before income taxes |
|
|
|
|
|
|
|
|
|
7,299 |
|
|
|
|
|
|
|
|
|
|
|
|
|
|
|
|
|
Year ended December 31, 2023 |
Liquids
Pipelines |
|
Gas
Transmission |
|
Gas
Distribution
and Storage1 |
|
Renewable
Power
Generation |
|
Total
Reportable
Segments |
|
(millions of Canadian dollars) |
|
|
|
|
|
|
|
|
|
|
Operating revenues2 |
|
29,882 |
|
|
5,854 |
|
|
5,976 |
|
|
477 |
|
|
42,189 |
|
Commodity and gas distribution costs |
|
(17,106 |
) |
|
(15 |
) |
|
(2,871 |
) |
|
(20 |
) |
|
(20,012 |
) |
Operating and administrative |
|
(4,659 |
) |
|
(2,380 |
) |
|
(1,285 |
) |
|
(261 |
) |
|
(8,585 |
) |
Impairment of long-lived assets3 |
|
145 |
|
|
— |
|
|
(281 |
) |
|
(283 |
) |
|
(419 |
) |
Income from equity investments |
|
1,007 |
|
|
688 |
|
|
2 |
|
|
140 |
|
|
1,837 |
|
Other income |
|
114 |
|
|
117 |
|
|
51 |
|
|
96 |
|
|
378 |
|
Earnings before interest, income taxes and depreciation and amortization |
|
9,383 |
|
|
4,264 |
|
|
1,592 |
|
|
149 |
|
|
15,388 |
|
Eliminations and Other |
|
|
|
|
|
|
|
|
|
916 |
|
Depreciation and amortization |
|
|
|
|
|
|
|
|
|
(4,613 |
) |
Interest expense (Note 17) |
|
|
|
|
|
|
|
|
|
(3,812 |
) |
Earnings before income taxes |
|
|
|
|
|
|
|
|
|
7,879 |
|
1Primarily relates to public utilities that are subject to regulation.
2Refer to Note 4 - Revenue for a reconciliation of segment Operating revenues to the Consolidated Statements of Earnings.
3The Liquids Pipelines segment includes the impact of a gain resulting from the derecognition of a net regulatory liability due to the discontinuance of regulatory accounting for our Southern Lights Pipeline.
Capital Expenditures1
|
|
|
|
|
|
|
|
|
|
Year ended December 31, |
2025 |
|
2024 |
|
2023 |
|
(millions of Canadian dollars) |
|
|
|
|
|
|
Liquids Pipelines |
|
1,358 |
|
|
1,157 |
|
|
1,158 |
|
Gas Transmission |
|
3,271 |
|
|
2,571 |
|
|
1,944 |
|
Gas Distribution and Storage |
|
3,351 |
|
|
2,386 |
|
|
1,451 |
|
Renewable Power Generation |
|
947 |
|
|
661 |
|
|
100 |
|
Eliminations and Other |
|
174 |
|
|
59 |
|
|
55 |
|
|
|
9,101 |
|
|
6,834 |
|
|
4,708 |
|
1Capital expenditures are cash basis plus equity component of the allowance for funds used during construction.
Property, Plant and Equipment
|
|
|
|
|
|
|
Year ended December 31, |
2025 |
|
2024 |
|
(millions of Canadian dollars) |
|
|
|
|
Liquids Pipelines |
|
51,689 |
|
|
53,863 |
|
Gas Transmission |
|
35,421 |
|
|
34,683 |
|
Gas Distribution and Storage |
|
39,644 |
|
|
38,636 |
|
Renewable Power Generation |
|
4,439 |
|
|
3,612 |
|
Eliminations and Other |
|
405 |
|
|
310 |
|
|
|
131,598 |
|
|
131,104 |
|
GEOGRAPHIC INFORMATION
Revenues1
|
|
|
|
|
|
|
|
|
|
Year ended December 31, |
2025 |
|
2024 |
|
2023 |
|
(millions of Canadian dollars) |
|
|
|
|
|
|
Canada |
|
23,077 |
|
|
22,001 |
|
|
23,781 |
|
US |
|
42,117 |
|
|
31,472 |
|
|
19,868 |
|
|
|
65,194 |
|
|
53,473 |
|
|
43,649 |
|
1Revenues are based on the country of origin of the product or service sold.
Property, Plant and Equipment1
|
|
|
|
|
|
|
Year ended December 31, |
2025 |
|
2024 |
|
(millions of Canadian dollars) |
|
|
|
|
Canada |
|
49,642 |
|
|
48,873 |
|
United States |
|
81,956 |
|
|
82,231 |
|
|
|
131,598 |
|
|
131,104 |
|
1Amounts are based on the locations where the assets are held.
6. EARNINGS PER COMMON SHARE
NUMERATOR
The numerator used in calculating both basic and diluted earnings per share equals Earnings attributable to common shareholders per the Consolidated Statements of Earnings, less Redemption value adjustment attributable to redeemable NCI per the Consolidated Statements of Changes in Equity.
DENOMINATOR
The denominator of the basic earnings per common share calculation represents the weighted average number of common shares outstanding.
The denominator of the diluted earnings per common share calculation uses the treasury stock method to determine the dilutive impact of stock options and share-settled RSUs. This method assumes any proceeds from the exercise of stock options and vesting of share-settled RSUs would be used to purchase common shares at the average market price during the period. The basic weighted average shares outstanding are adjusted by this dilutive impact to derive the diluted weighted average shares outstanding.
Weighted average shares outstanding used to calculate basic and diluted earnings per common share are as follows:
|
|
|
|
|
|
|
|
|
|
December 31, |
2025 |
|
|
2024 |
|
|
2023 |
|
(number of shares in millions) |
|
|
|
|
|
|
Weighted average shares outstanding |
|
2,180 |
|
|
2,155 |
|
|
2,056 |
|
Effect of dilutive options and RSUs |
|
6 |
|
|
3 |
|
|
2 |
|
Diluted weighted average shares outstanding |
|
2,186 |
|
|
2,158 |
|
|
2,058 |
|
For the years ended December 31, 2025, 2024 and 2023, 1.2 million, 14.6 million and 19.3 million, respectively, of anti-dilutive stock options with a weighted average exercise price of $60.37, $54.37 and $54.42, respectively, were excluded from the diluted earnings per common share calculation.
7. REGULATORY MATTERS
We record assets and liabilities that result from regulated ratemaking processes that would not be recorded under US GAAP for non-regulated entities. See Note 2 - Significant Accounting Policies for further discussion. Our significant regulated businesses and the related accounting impacts are described below.
Under the current authorized rate structure for certain operations, income tax costs are recovered in rates based on the current income tax payable and do not include accruals for deferred income tax. However, as income taxes become payable as a result of the reversal of temporary differences that created the deferred income taxes, it is expected that rates will be adjusted to recover these taxes. Since most of these temporary differences are related to property, plant and equipment costs, this recovery is expected to occur over the life of the related assets. In the absence of rate-regulated accounting, this regulatory tax asset and the related earnings impact would not be recorded.
LIQUIDS PIPELINES
Canadian Mainline
Canadian Mainline includes the Canadian portion of our Mainline system. The MTS governs the tolls paid for products shipped on its Mainline System, with the exception of Lines 8 and 9 which are tolled on a separate basis, and was approved by the CER on March 4, 2024. The MTS has a seven-and-a-half year term through the end of 2028 and provides a Canadian Local Toll for all volumes shipped on the Canadian Mainline and an International Joint Tariff for all volumes shipped from western Canadian receipt points to delivery points on our Lakehead System. We have recognized a regulatory asset of $2.0 billion as at December 31, 2025 and 2024 to offset deferred income taxes, as a CER rate order governing flow-through income tax treatment permits future recovery. We also collect and set aside amounts to fund future pipeline abandonment costs for our regulated pipelines as a result of the requirements under the LMCI (Note 23). Amounts expected to be paid for these future costs are recognized as long-term regulatory liabilities. No other material regulatory assets or liabilities are recognized under the terms of the MTS.
GAS TRANSMISSION
British Columbia Pipeline and Maritimes & Northeast Canada
British Columbia (BC) Pipeline and Maritimes & Northeast Canada (M&N Canada) are regulated by the CER. Rates are approved by the CER through negotiated toll settlement agreements based on cost-of-service. Both our BC Pipeline and M&N Canada systems currently operate under the terms of their respective 2022–2026 and 2024–2025 settlement agreements, which stipulate an allowable return on equity (ROE) and the continuation and establishment of certain deferral and variance accounts. The M&N Canada 2024–2025 toll settlement expired at the end of 2025. M&N Canada reached a new toll settlement with shippers for the effective period from January 1, 2026 to December 31, 2027. On December 15, 2025, M&N Canada filed the 2026–2027 toll settlement agreement with the CER, which is currently pending CER approval.
US Gas Transmission
The majority of our US gas transmission and storage services are regulated by the FERC and may also be subject to the jurisdiction of various other federal, state and local agencies. The FERC regulates natural gas transmission in US interstate commerce including the establishment of rates for services, while rates for intrastate commerce and/or gathering services are regulated by the state gas commissions. Cost-of-service is the basis for the calculation of regulated tariff rates, although the FERC also allows the use of negotiated and discounted rates within contracts with shippers that may result in a rate that is above or below the FERC-regulated recourse rate for that service.
GAS DISTRIBUTION AND STORAGE
Enbridge Gas Ontario
Enbridge Gas Ontario's distribution rates, commencing in 2024, were set by the OEB under a five-year Incentive Regulation (IR) framework. The framework included the establishment of 2024 base rates on a cost-of-service basis, while rates for 2025 through 2028 were or will be established using a price cap mechanism. The price cap mechanism establishes new rates each year through certain annual base rate adjustments and updates, and annual base rate escalation at inflation less a 0.28% productivity factor. The price cap mechanism includes the continuation and establishment of certain deferral and variance accounts, as well as an earnings sharing mechanism that requires Enbridge Gas Ontario to share equally with customers any earnings in excess of 100 basis points over the allowed ROE, and share 90% of earnings in excess of 300 basis points over the allowed ROE.
Enbridge Gas Ohio
Enbridge Gas Ohio is subject to the jurisdiction of the Ohio Commission with its natural gas sales and transportation and storage services being provided under rate schedules approved by the regulatory commission. Enbridge Gas Ohio uses a straight-fixed-variable rate design, where the majority of operating costs are recovered through a monthly charge, as established in a 2008 rate case settlement.
In October 2023, Enbridge Gas Ohio filed its first base rates application with the Ohio Commission since 2007, proposing a base rate annual revenue increase to be effective January 2025. The base rate increase was proposed to recover the significant investment in distribution infrastructure for the benefit of Ohio customers, including an ROE of 10.40%.
In June 2025, the Ohio Commission ordered a decrease to annual revenue of US$26.3 million, utilizing an ROE of 9.79%, and an increase to the equity thickness to 51.9%. The order also resulted in disallowances of $330 million (US$240 million), including regulatory pension assets of $280 million (US$204 million) and other disallowances of $50 million (US$36 million). The impairment loss of $330 million for the year ended December 31, 2025, is included in Impairment of long-lived assets in the Consolidated Statements of Earnings.
The order authorized the continuation of the Pipeline Infrastructure Replacement (PIR) and Capital Expenditure Programs (CEP) through 2028, with 3% increases of capital expenditures under the PIR per year. Assets placed in service accrue a carrying cost at the cost of long-term debt approved in the most recent rate case until incorporated into rates via annual filings.
In July 2025, Enbridge Gas Ohio filed a rehearing application for certain aspects of the order. The Ohio Commission corrected errors in its order addressing the rehearing application, resulting in a reduction of the original annual revenue decrease to US$14.3 million. Updated rates were effective on November 1, 2025. On December 12, 2025, Enbridge Gas Ohio filed a notice of appeal with the Ohio Supreme Court, focusing on the Ohio Commission's treatment of the pension fund and capitalized incentive-compensation costs.
In December 2025, Enbridge Gas Ohio filed a base rate case application proposing an annual revenue increase of US$163 million, subject to update and adjustments, to be effective in early 2027. The base rate increase was proposed to recover Enbridge Gas Ohio's investment in distribution infrastructure and other costs to serve, including operating expenses and debt servicing costs.
The CEP allows Enbridge Gas Ohio to defer depreciation expense, property tax expense and carrying costs at the debt rate of 6.5% on capital investments not covered by its PIR program. In September 2024, the Ohio Commission approved adjustments to CEP cost recovery rates for 2023 costs. In March 2025, Enbridge Gas Ohio filed an application with the Ohio Commission to adjust CEP cost recovery rates for 2024 costs. Although this application is still pending, revised base rates went into effect in November 2025 on an interim basis, with any true-up to be included in the subsequent annual filing. Enbridge Gas Ohio also updated the debt rate for carrying costs to 3.16%.
The PIR program aims to replace 25% of the pipeline system. In June 2025, the Ohio Commission extended the PIR program through 2028.
Enbridge Gas Utah, Enbridge Gas Wyoming and Enbridge Gas Idaho
Enbridge Gas Utah, Enbridge Gas Wyoming and Enbridge Gas Idaho are regulated by the Utah Commission, the Wyoming Commission, and the Idaho Commission. For rate oversight of Enbridge Gas Idaho's operations in a small area of southeastern Idaho, the Idaho Commission has contracted with Utah Commission. Both Utah and Wyoming Commissions allow for the recovery of gas costs through a balancing-account mechanism.
Enbridge Gas Utah, Enbridge Gas Wyoming and Enbridge Gas Idaho use several mechanisms to manage costs and promote efficiency including:
•recovery of gas costs through a balance-account mechanism that adjusts rates periodically to reflect changes in natural gas prices;
•a mechanism to place into rate base, and earn a return on, capital expenditures associated with the Infrastructure Replacement Program;
•decoupling of non-gas revenues from customer usage under the CET, enabling the collection of allowed revenue per customer and encouraging energy conservation; and
•promoting natural gas conservation through advertising, rebates, and home energy plans under the Energy Efficiency Program.
In May 2025, Enbridge Gas Utah filed its first rates application since 2022 with the Utah Commission, proposing the recovery of costs to deliver natural gas to customers and investments in infrastructure to support service reliability and customer growth.
In September 2025, Enbridge Gas Utah filed a settlement and final order approving an annual revenue increase of US$61 million was issued on December 24, 2025 with updated rates effective January 1, 2026.
Enbridge Gas North Carolina
Enbridge Gas North Carolina is subject to regulation of rates and other aspects of its business by the North Carolina Commission. Base rates for Enbridge Gas North Carolina are designed primarily based on rate design methodology in which the majority of operating costs are recovered through volumetric charges. The North Carolina Commission authorized Enbridge Gas North Carolina to use a tracker mechanism to recover costs related to pipeline integrity and safety requirements that are not included in current base rates.
Enbridge Gas North Carolina uses several mechanisms to adjust rates and recover costs. CUT allows for rate adjustments based on changes in customer usage patterns. Rider D enables the recovery of gas purchases from customers, with rates periodically adjusted to reflect market price changes.
In April 2025, Enbridge Gas North Carolina filed its first rates application since 2021 with the North Carolina Commission, proposing the recovery of costs to deliver natural gas to customers and investments in infrastructure to support service reliability and customer growth.
In September 2025, a settlement agreement was filed reflecting an annual revenue increase of US$33 million. The settlement was approved by the North Carolina Commission on December 9, 2025, with updated rates effective November 1, 2025.
The settlement includes a Major Projects Rider for the Moriah Energy Center LNG facility and the T-15 Reliability Project, as a standalone cost recovery mechanism between general base rate cases.
FINANCIAL STATEMENT EFFECTS
Accounting for rate-regulated activities has resulted in the recognition of the following regulatory assets and liabilities in the Consolidated Statements of Financial Position.
|
|
|
|
|
|
|
|
|
|
December 31, |
2025 |
|
2024 |
|
Recovery/Refund
Period Ends |
|
(millions of Canadian dollars) |
|
|
|
|
|
|
Current regulatory assets |
|
|
|
|
|
|
Purchase gas variance |
|
124 |
|
|
74 |
|
|
2026 |
|
Under-recovery of fuel costs |
|
144 |
|
|
4 |
|
|
2026 |
|
Deferred projects costs1 |
|
96 |
|
|
90 |
|
|
2026 |
|
Other current regulatory assets |
|
330 |
|
|
304 |
|
|
2026 |
|
Total current regulatory assets2 (Note 9) |
|
694 |
|
|
472 |
|
|
|
Long-term regulatory assets |
|
|
|
|
|
|
Deferred income taxes3 |
|
4,847 |
|
|
4,698 |
|
Various |
|
Deferred projects costs1 |
|
1,009 |
|
|
1,045 |
|
Various |
|
Long-term debt4 |
|
291 |
|
|
318 |
|
2032–2046 |
|
Negative salvage5 |
|
208 |
|
|
136 |
|
Various |
|
Demand-side management costs |
|
185 |
|
|
237 |
|
Various |
|
Pension plan receivable6 |
|
18 |
|
|
266 |
|
Various |
|
Other long-term regulatory assets |
|
347 |
|
|
447 |
|
Various |
|
Total long-term regulatory assets2 |
|
6,905 |
|
|
7,147 |
|
|
|
Total regulatory assets |
|
7,599 |
|
|
7,619 |
|
|
|
Current regulatory liabilities |
|
|
|
|
|
|
Purchase gas variance |
|
200 |
|
|
292 |
|
|
2026 |
|
Other current regulatory liabilities |
|
333 |
|
|
324 |
|
|
2026 |
|
Total current regulatory liabilities8 (Note 16) |
|
533 |
|
|
616 |
|
|
|
Long-term regulatory liabilities |
|
|
|
|
|
|
Future removal and site restoration reserves9 |
|
3,029 |
|
|
2,964 |
|
Various |
|
Regulatory liability related to US income taxes7 |
|
1,852 |
|
|
2,021 |
|
Various |
|
Pipeline future abandonment costs (Note 23) |
|
949 |
|
|
826 |
|
Various |
|
Pension plan payable6 |
|
100 |
|
|
59 |
|
Various |
|
Other long-term regulatory liabilities |
|
283 |
|
|
242 |
|
Various |
|
Total long-term regulatory liabilities8 |
|
6,213 |
|
|
6,112 |
|
|
|
Total regulatory liabilities |
|
6,746 |
|
|
6,728 |
|
|
|
1Amounts anticipated to be collected from customers in East Ohio’s service areas for rider projects, including CEP, PIR and costs related to the Pipeline Safety Management Program. The recovery periods for these expenditures vary according to the stipulations outlined in the respective riders. For Enbridge Gas North Carolina, these amounts relate to pipeline integrity management which represent operating costs incurred to comply with federal regulatory requirements related to natural gas pipelines and have been deferred pending future approval of rate recovery.
2Current regulatory assets are included in Other current assets, while long-term regulatory assets are included in Deferred amounts and other assets.
3Regulatory offset to deferred income tax liabilities to the extent that it is expected to be included in future regulator-approved rates and recovered from customers. The recovery period depends on the timing of the reversal of temporary differences. In the absence of rate-regulated accounting, this regulatory balance and the related earnings impact would not be recorded. This balance is net of regulatory deferred tax write-offs.
4Regulatory offset to the fair value adjustment to debt acquired in our merger with Spectra Energy Corp. (Spectra Energy). The offset is viewed as a proxy for the regulatory asset that would be recorded in the event such debt was extinguished at an amount higher than the carrying value.
5Recovery in future rates of the actual cost of removal of previously retired or decommissioned plant assets, as approved by the FERC.
6Regulatory offset to our pension liability to the extent that it is expected to be included in regulator-approved future rates and recovered from customers. The settlement period for this balance is not determinable. In the absence of rate-regulated accounting, this regulatory balance and the related pension expense would be recorded in earnings and OCI.
7Regulatory liability related to US income taxes resulted from the US tax reform legislation dated December 22, 2017. This balance will be refunded to customers in accordance with the respective rate settlements approved by the FERC for our US Gas Transmission pipelines and by the respective state utility commission for each US Gas Distribution franchise.
8Current regulatory liabilities are included in Other current liabilities, while long-term regulatory liabilities are included in Other long-term liabilities.
9Future removal and site restoration reserves consists of amounts collected from customers, with the approval of the respective regulatory authorities, to fund future costs of removal and site restoration relating to property, plant and equipment. These costs are collected as part of the depreciation expense charged on property, plant and equipment that is reflected in rates. The settlement of this balance will occur over the long-term as costs are incurred. In the absence of rate-regulated accounting, depreciation rates would not include a charge for removal and site restoration and costs would be charged to earnings as incurred with recognition of revenue for amounts previously collected.
8. ACQUISITIONS AND DISPOSITION
BUSINESS COMBINATIONS
We accounted for each of the acquisitions discussed below using the acquisition method as prescribed by ASC 805 Business Combinations. In accordance with valuation methodologies described in ASC 820 Fair Value Measurement, acquired assets and assumed liabilities are recorded at their estimated fair values as at the date of acquisition.
The fair values of regulatory assets and liabilities, which are subject to rate-setting and cost recovery mechanisms under ASC 980 Regulated Operations, are equal to their carrying values at acquisition. The recognition of regulatory assets and liabilities is based on the actions, or expected future actions, of the regulator. To the extent that the regulator's actions differ from our expectations, the timing and amount of recovery or settlement of regulatory balances could differ significantly from those recorded at acquisition.
Public Service Company of North Carolina, Incorporated
On September 30, 2024, through a wholly-owned US subsidiary, we acquired all of the membership interests of Fall North Carolina Holdco LLC, which owns 100% of Public Service Company of North Carolina, Incorporated (PSNC), for cash consideration of $2.7 billion (US$2.0 billion) (the PSNC Acquisition). PSNC is a public utility primarily engaged in the purchase, sale, transportation and distribution of natural gas to residential, commercial and industrial customers in North Carolina. PSNC operates under rates approved by the North Carolina Commission. Subsequent to its acquisition, PSNC conducts business as Enbridge Gas North Carolina.
The following table summarizes the estimated fair values that were assigned to the net assets of PSNC:
|
|
|
September 30, 20241 |
(millions of Canadian dollars) |
|
Fair value of net assets acquired: |
|
Current assets (a) |
303 |
Property, plant and equipment (b) |
4,147 |
Long-term assets (c) |
189 |
Current liabilities |
277 |
Long-term debt (d) |
1,529 |
Other long-term liabilities (e) |
653 |
Deferred income tax liabilities |
365 |
Goodwill (f) |
895 |
Purchase price: |
|
Cash |
2,710 |
1In the fourth quarter of 2024, immaterial adjustments were made to the PSNC Acquisition purchase price allocation.
a)Current assets consist primarily of cash, trade and other accounts receivable, regulatory assets and inventory. The fair value of trade receivables from customers approximates their carrying value of $70 million due to the short period to maturity. A provision of $2 million for expected credit loss associated with accounts receivable has been recorded.
b)PSNC's property, plant and equipment constitutes an integrated system of rate-regulated natural gas transmission, distribution and storage assets. For these rate-regulated assets, fair value was determined using a market participant perspective. Given the regulated nature of, and fixed return on the assets, the fair value of property, plant and equipment acquired is equal to its carrying value.
c)Long-term assets consist primarily of $114 million of regulatory assets expected to be recovered from customers in future periods through rates and equity interests in a liquefied natural gas (LNG) storage facility in North Carolina and in an intrastate natural gas pipeline.
d)The fair value of long-term debt was determined based on the current underlying US Treasury interest rates on instruments of similar yield, credit risk and tenor, as well as an implied credit spread based on current market conditions. We recorded a fair value adjustment to reduce long-term debt by $156 million with no corresponding regulatory offset.
e)Other long-term liabilities consist primarily of regulatory liabilities expected to be refunded to customers in future periods through rates.
f)Goodwill is primarily attributable to the existing assembled assets and workforce of PSNC that cannot be duplicated at the same cost by a new entrant and the enhanced scale and geographic diversity of our regulated natural gas distribution business, which provides a platform for future growth and optimization with existing assets. The goodwill balance recognized has been assigned to our Gas Distribution and Storage segment and is not tax deductible.
Upon completion of the PSNC Acquisition, we began consolidating PSNC. For the period beginning September 30, 2024 through to December 31, 2024, PSNC generated $284 million of operating revenues and $50 million of earnings attributable to common shareholders.
Our supplemental pro forma consolidated financial information for the years ended December 31, 2024 and 2023, including the results of operations for PSNC as if the PSNC Acquisition had been completed on January 1, 2023, is as follows:
|
|
|
Year ended December 31, |
2024 |
2023 |
(unaudited; millions of Canadian dollars) |
|
|
Operating revenues |
54,116 |
44,614 |
Earnings attributable to common shareholders1 |
5,149 |
5,944 |
1Includes adjustment for pro forma interest expense on debt financing for the PSNC Acquisition of $48 million (after-tax of $37 million) for the year ended December 31, 2023.
Questar Gas Company
On May 31, 2024, through a wholly-owned US subsidiary, we acquired all of the membership interests of Fall West Holdco LLC which owns 100% of Questar and Wexpro for cash consideration of $4.1 billion (US$3.0 billion) (the Questar Acquisition). Questar is a public natural gas utility providing distribution, storage and transmission services to residential, commercial and industrial customers in Utah, southwestern Wyoming and southeastern Idaho. The Utah Commission, the Wyoming Commission and the Idaho Commission have granted Questar the necessary regulatory approvals to serve these areas. Wexpro develops and produces cost-of-service gas reserves for Questar and operates under agreements with the states of Utah and Wyoming. Subsequent to its acquisition, Questar conducts business as Enbridge Gas Utah, Enbridge Gas Wyoming, and Enbridge Gas Idaho in those respective states.
The following table summarizes the estimated fair values that were assigned to the net assets of Questar and Wexpro:
|
|
|
May 31, 20241 |
(millions of Canadian dollars) |
|
Fair value of net assets acquired: |
|
Current assets (a) |
380 |
Property, plant and equipment (b) |
6,013 |
Long-term assets (c) |
163 |
Current liabilities |
416 |
Long-term debt (d) |
1,343 |
Other long-term liabilities (e) |
919 |
Deferred income tax liabilities |
527 |
Goodwill (f) |
793 |
Purchase price: |
|
Cash |
4,144 |
1In the fourth quarter of 2024, immaterial adjustments were made to the Questar Acquisition purchase price allocation.
a)Current assets consist primarily of cash, trade and other accounts receivable and inventory. The fair value of trade receivables from customers approximates their carrying value of $202 million due to the short period to maturity. A provision of $9 million for expected credit loss associated with accounts receivable has been recorded.
b)Questar's property, plant and equipment constitutes an integrated system of rate-regulated natural gas transmission, distribution and storage assets. Wexpro's property, plant and equipment consists of cost-of-service gas and oil properties developed and produced for Questar. For these rate-regulated assets, fair value was determined using a market participant perspective. Given the regulated nature of, and fixed return on the assets, the fair value of property, plant and equipment acquired is equal to its carrying value.
c)Long-term assets consist primarily of funds collected from Questar by Wexpro and held in trust to fund future asset AROs, as well as regulatory assets expected to be recovered from customers in future periods through rates.
d)The fair value of long-term debt was determined based on the current underlying US Treasury interest rates on instruments of similar yield, credit risk and tenor, as well as an implied credit spread based on current market conditions. We recorded a fair value adjustment to reduce long-term debt by $301 million with no corresponding regulatory offset.
e)Other long-term liabilities consist primarily of regulatory liabilities, expected to be refunded to customers in future periods through rates, as well as ARO. The fair value of the ARO liability was determined using a discounted cash flow approach.
f)Goodwill is primarily attributable to the existing assembled assets and workforce of Questar and Wexpro that cannot be duplicated at the same cost by a new entrant and the enhanced scale and geographic diversity of our regulated natural gas distribution business, which provides a platform for future growth and optimization with existing assets. The goodwill balance recognized has been assigned to our Gas Distribution and Storage segment and is not tax deductible.
Upon completion of the Questar Acquisition, we began consolidating Questar and Wexpro. For the period beginning May 31, 2024 through to December 31, 2024, Questar and Wexpro generated $755 million of operating revenues and $75 million of earnings attributable to common shareholders.
Our supplemental pro forma consolidated financial information for the years ended December 31, 2024 and 2023, including the results of operations for Questar and Wexpro as if the Questar Acquisition had been completed on January 1, 2023, is as follows:
|
|
|
Year ended December 31, |
2024 |
2023 |
(unaudited; millions of Canadian dollars) |
|
|
Operating revenues |
54,698 |
45,918 |
Earnings attributable to common shareholders1 |
5,193 |
6,005 |
1Includes adjustment for pro forma interest expense on debt financing for the Questar Acquisition of $70 million (after-tax of $53 million) for the year ended December 31, 2023.
The East Ohio Gas Company
On March 6, 2024, through a wholly-owned US subsidiary, we acquired all of the outstanding shares of capital stock of the East Ohio Gas Company (EOG) for cash consideration of $5.8 billion (US$4.3 billion) (the EOG Acquisition). EOG is a public natural gas utility providing distribution, storage and transmission services to residential, commercial and industrial customers in Ohio and is regulated by the Ohio Commission. Subsequent to its acquisition, EOG conducts business as Enbridge Gas Ohio.
The following table summarizes the estimated fair values that were assigned to the net assets of EOG:
|
|
|
March 6, 20241 |
(millions of Canadian dollars) |
|
Fair value of net assets acquired: |
|
Current assets (a) |
493 |
Property, plant and equipment (b) |
7,276 |
Long-term assets (c) |
1,689 |
Current liabilities |
551 |
Long-term debt (d) |
2,612 |
Other long-term liabilities (e) |
1,001 |
Deferred income tax liabilities |
1,045 |
Goodwill (f) |
1,603 |
Purchase price: |
|
Cash |
5,852 |
1In the fourth quarter of 2024, immaterial adjustments were made to the EOG Acquisition purchase price allocation.
a)Current assets consist primarily of trade and other accounts receivable, prepaid expenses, regulatory assets and inventory. The fair value of trade receivables from customers approximates their carrying value of $379 million due to the short period to maturity. A provision of $3 million for expected credit loss associated with accounts receivable has been recorded.
b)EOG's property, plant and equipment constitutes an integrated system of rate-regulated natural gas transmission, gathering, distribution and storage assets. For these rate-regulated assets, fair value was determined using a market participant perspective. Given the regulated nature of, and fixed return on the assets, the fair value of property, plant and equipment acquired is equal to its carrying value.
c)Long-term assets consist primarily of overfunded pension plan assets of $367 million and $1.2 billion of regulatory assets expected to be recovered from customers in future periods through rates.
Pension plan assets attributable to the workforce acquired from EOG were transferred in cash to an Enbridge-sponsored pension plan based on their fair value as at March 6, 2024. The fair value of plan assets was determined using unadjusted quoted market prices for identical investments.
d)The fair value of long-term debt was determined based on the current underlying US Treasury interest rates on instruments of similar yield, credit risk and tenor, as well as an implied credit spread based on current market conditions. We recorded a fair value adjustment to reduce long-term debt by $478 million with no corresponding regulatory offset.
e)Other long-term liabilities consist primarily of regulatory liabilities expected to be refunded to customers in future periods through rates.
f)Goodwill is primarily attributable to the existing assembled assets and workforce of EOG that cannot be duplicated at the same cost by a new entrant and the enhanced scale and geographic diversity of our regulated natural gas distribution business, which provides a platform for future growth and optimization with existing assets. The goodwill balance recognized has been assigned to our Gas Distribution and Storage segment and is not tax deductible.
Upon completion of the EOG Acquisition, we began consolidating EOG. For the period beginning March 6, 2024 through to December 31, 2024, EOG generated $1.2 billion of operating revenues and $190 million of earnings attributable to common shareholders.
Our supplemental pro forma consolidated financial information for the years ended December 31, 2024 and 2023, including the results of operations for EOG as if the EOG Acquisition had been completed on January 1, 2023, was as follows:
|
|
|
Year ended December 31, |
2024 |
2023 |
(unaudited; millions of Canadian dollars) |
|
|
Operating revenues |
53,788 |
45,058 |
Earnings attributable to common shareholders1 |
5,130 |
5,961 |
1Includes adjustment for pro forma interest expense on debt financing for the EOG Acquisition of $100 million (after-tax of $77 million) for the year ended December 31, 2023.
The PSNC Acquisition, Questar Acquisition and EOG Acquisition (together, the Acquisitions) further diversify, and are complementary to, our existing gas distribution operations.
Acquisition of RNG Facilities
On January 2, 2024, through a wholly-owned US subsidiary, we acquired six Morrow Renewables operating landfill gas-to-RNG production facilities (Tomorrow RNG) located in Texas and Arkansas for total consideration of $1.3 billion (US$1.0 billion), of which $584 million (US$439 million) was paid at close and an additional deferred consideration is payable within two years with a fair value of $757 million (US$568 million) (the RNG Facilities Acquisition). The acquired assets align with and advance our lower-carbon strategy.
The following table summarizes the estimated fair values that were assigned to the net assets of Tomorrow RNG:
|
|
|
January 2, 2024 |
(millions of Canadian dollars) |
|
Fair value of net assets acquired: |
|
Current assets |
31 |
Intangible assets (a) |
925 |
Property, plant and equipment (b) |
174 |
Current liabilities |
5 |
Goodwill (c) |
223 |
Purchase price: |
|
Cash |
584 |
Deferred consideration (d): |
|
Current portion of long-term debt |
550 |
Long-term debt |
207 |
Other adjustments |
7 |
|
1,348 |
a)Intangible assets consist of long-term gas supply agreements with the respective facility's landfill owner. Fair value was determined using an income-based approach, specifically the multi-period excess earnings method, by estimating the present value of the after-tax cash flows attributable to the gas rights. The intangible assets will be amortized on a straight-line basis over the term of the respective agreement, inclusive of extension options, which range from 13 to 42 years (approximately nine years to the next extension period on a weighted-average basis).
b)Tomorrow RNG's property, plant and equipment constitutes specialized landfill gas plant and equipment which collects gas produced by waste decomposition, treats and compresses the gas to pipeline specifications. The direct method of replacement cost was used to determine the majority of the fair value of property, plant and equipment. Adjustments were then applied for estimated physical deterioration.
c)Goodwill is primarily attributable to expected future returns from a portfolio of both operating and scalable RNG assets, furthering the diversity of our renewable projects portfolio and accelerating progress toward our energy transition goals. The goodwill balance recognized has been assigned to our Gas Transmission segment and is tax deductible over 15 years.
d)We entered into six non-interest bearing promissory notes due to Morrow Renewables, the total value of which represents deferred payments of $808 million (US$606 million) due within two years. The first payment was made on January 2, 2025 and the second payment was made on December 31, 2025. The $757 million (US$568 million) recognized in the purchase price represents the fair value of deferred consideration at the date of acquisition using the imputed interest rate method over the terms of the notes.
Upon completion of the RNG Facilities Acquisition, we began consolidating Tomorrow RNG. For the period beginning January 2, 2024 through to December 31, 2024, operating revenues and earnings attributable to common shareholders generated by Tomorrow RNG were immaterial. The impact to our supplemental pro forma consolidated operating revenues and earnings attributable to common shareholders for the years ended December 31, 2024 and 2023, as if the RNG Facilities Acquisition had been completed on January 1, 2023, was also immaterial.
Aitken Creek Gas Storage
On November 1, 2023, through a wholly-owned Canadian subsidiary, we acquired a 93.8% interest in Aitken Creek Gas Storage Facility and a 100% interest in Aitken Creek North Gas Storage Facility (collectively, Aitken Creek), located in BC, Canada, for $400 million (the Aitken Creek Acquisition). Aitken Creek is the only underground natural gas storage facility in BC and connects to all major natural gas pipelines in western Canada. The Aitken Creek Acquisition enables us to continue to meet regional energy needs and to support increasing demand for LNG exports.
The following table summarizes the estimated fair values that were assigned to the net assets of Aitken Creek:
|
|
|
November 1, 2023 |
(millions of Canadian dollars) |
|
Fair value of net assets acquired: |
|
Current assets (a) |
105 |
Property, plant and equipment (b) |
466 |
Current liabilities |
20 |
Long-term liabilities (c) |
130 |
Goodwill (d) |
46 |
Purchase price: |
|
Cash |
397 |
Additional consideration (e) |
70 |
|
467 |
a)Current assets consist primarily of inventory which is short-term in nature and represents natural gas held in storage. Fair value was determined using the market price of natural gas at the date of acquisition.
b)Aitken Creek's property, plant and equipment constitutes an integrated system of cavern storage facilities, associated header pipeline, and land and right-of-ways. The depreciated replacement cost approach was adopted as the primary valuation methodology to determine the fair value of property, plant and equipment, excluding the reservoir storage asset. In determining replacement cost, both indirect costing using relevant inflation indices and direct costing using relevant market quotes were utilized. Adjustments were then applied for physical deterioration as well as functional and economic obsolescence.
Fair value of the reservoir storage asset was determined using a residual approach whereby the adjusted purchase price was allocated to the fair value of the net tangible assets, excluding the reservoir storage asset, with the remaining value allocated to the reservoir storage asset. The income approach was also utilized to corroborate that the cash flows attributable to the reservoir storage asset support the residual value.
c)Long-term liabilities consist primarily of a deferred income tax liability arising from temporary differences between the tax bases of assets and liabilities and their carrying values for accounting purposes at the date of acquisition.
d)Goodwill is primarily attributable to the recognition of a deferred income tax liability. The goodwill balance recognized has been assigned to our Gas Transmission segment and is not tax deductible.
e)The $70 million of additional consideration recognized in the purchase price represents the fair value of derivative contracts and working gas as at March 31, 2023.
Upon completion of the Aitken Creek Acquisition, we began consolidating Aitken Creek. For the period beginning November 1, 2023 through to December 31, 2023, operating revenues and earnings attributable to common shareholders generated by Aitken Creek were immaterial. The impact to our supplemental pro forma consolidated operating revenues and earnings attributable to common shareholders for the year ended December 31, 2023, as if the Aitken Creek Acquisition had been completed on January 1, 2022, was also immaterial.
NONCONTROLLING INTEREST INVESTMENT
Westcoast Energy Limited Partnership
On July 1, 2025, Westcoast completed a reorganization in which substantially all of the property and assets relating to the BC Pipeline system were transferred to a newly formed partnership, Westcoast LP. On July 2, 2025, the First Nations Partnership invested approximately $736 million to subscribe for all of the Class A units of Westcoast LP, resulting in a 12.50% interest in the partnership. The cash consideration of $736 million and a respective Redeemable NCI based on the consideration received less transaction costs were recorded in the Consolidated Statements of Financial Position on close, to reflect the interest held by the First Nations Partnership.
We continue to manage and operate the BC Pipeline system. Refer to Note 12 - Variable Interest Entities and Note 19 - Noncontrolling Interests.
ASSET ACQUISITION
Tres Palacios Holdings LLC
On April 3, 2023, we acquired Tres Palacios Holdings LLC (Tres Palacios) for $451 million (US$335 million) of cash. Tres Palacios owns and operates a natural gas storage facility located in the US Gulf Coast and its infrastructure serves Texas gas-fired power generation and LNG exports, as well as Mexico pipeline exports.
We allocated assets with a fair value of $790 million (US$588 million) to Property, plant and equipment, net, of which $254 million (US$189 million) relates to storage cavern right-of-use assets, and recorded the related lease liabilities of $7 million (US$5 million) and $248 million (US$184 million) to Current portion of long-term debt and Long-term debt, respectively, in the Consolidated Statements of Financial Position. The acquired assets are included in our Gas Transmission segment.
9. OTHER CURRENT ASSETS
|
|
|
|
|
|
|
December 31, |
2025 |
|
2024 |
|
(millions of Canadian dollars) |
|
|
|
|
Gas imbalances |
|
705 |
|
|
517 |
|
Regulatory assets (Note 7) |
|
694 |
|
|
472 |
|
Derivative assets (Note 23) |
|
591 |
|
|
557 |
|
Income taxes receivable |
|
346 |
|
|
375 |
|
Other |
|
894 |
|
|
849 |
|
|
|
3,230 |
|
|
2,770 |
|
10. INVENTORY
|
|
|
|
|
|
|
December 31, |
2025 |
|
|
2024 |
|
(millions of Canadian dollars) |
|
|
|
|
Natural gas |
|
901 |
|
|
811 |
|
Crude oil |
|
548 |
|
|
479 |
|
Other |
|
172 |
|
|
198 |
|
|
|
1,621 |
|
|
1,488 |
|
11. PROPERTY, PLANT AND EQUIPMENT
|
|
|
|
December 31, |
Weighted Average Depreciation Rate |
2025 |
2024 |
(millions of Canadian dollars) |
|
|
|
Pipelines |
2.8 % |
72,233 |
73,633 |
Facilities and equipment |
3.2 % |
44,101 |
43,439 |
Land and right-of-way1 |
2.9 % |
4,330 |
4,181 |
Gas mains, services and other |
3.0 % |
27,927 |
26,925 |
Storage |
2.5 % |
6,673 |
6,455 |
Wind turbines, solar panels and other |
3.4 % |
5,818 |
4,798 |
Other |
9.3 % |
4,416 |
3,987 |
Under construction |
— % |
7,240 |
5,648 |
Total property, plant and equipment2 |
|
172,738 |
169,066 |
Total accumulated depreciation2 |
|
(41,140) |
(37,962) |
Property, plant and equipment, net |
|
131,598 |
131,104 |
1The measurement of weighted average depreciation rate excludes non-depreciable assets.
2As at December 31, 2025, the cost and accumulated depreciation of leased assets accounted for as lessor operating leases was $4.7 billion and $2.1 billion, respectively (December 31, 2024 - $4.7 billion and $2.0 billion, respectively).
Depreciation expense for the years ended December 31, 2025, 2024 and 2023 was $5.1 billion, $4.6 billion and $4.0 billion, respectively.
12. VARIABLE INTEREST ENTITIES
WESTCOAST ENERGY LIMITED PARTNERSHIP
Westcoast LP is a BC limited partnership which holds and operates our Westcoast BC Pipeline system, serving customers in western Canada and the US Pacific Northwest. The limited partners, Westcoast and the First Nations Partnership, hold 87.52% and 12.47% interests in Westcoast LP, respectively. The remaining 0.01% general partner interest is held by Westcoast Energy GP Inc., our wholly-owned subsidiary.
Westcoast LP is considered a VIE as its limited partners lack substantive participating rights and kick-out rights. In addition to having the obligation to absorb losses and the right to expected returns, we, through our direct interests and the operating agreement between Westcoast and Westcoast LP, have the ability to direct the activities of Westcoast LP's principal operations, thereby making us the primary beneficiary of the VIE. Westcoast LP is a consolidated VIE of Enbridge.
CONSOLIDATED VARIABLE INTEREST ENTITIES
Our consolidated VIEs consist of legal entities of which we are the primary beneficiary. We are the primary beneficiary when our variable interest(s) provide(s) us with (i) the power to direct the activities of the VIE that most significantly impact the entity's economic performance and (ii) the obligation to absorb losses, or the right to receive benefits, from the VIE that could potentially be significant to the VIE. We determine whether we are the primary beneficiary of a VIE by considering qualitative and quantitative factors, including, but not limited to: decision-making responsibilities, the VIE capital structure, risk and reward sharing, contractual agreements with the VIE, voting rights and level of involvement of other parties.
The following table includes assets only to be used to settle the liabilities of our consolidated VIEs. The creditors of the liabilities of our consolidated VIEs do not have recourse to us as the primary beneficiary. These assets and liabilities are included in the Consolidated Statements of Financial Position.
|
|
|
|
|
|
|
December 31, |
2025 |
|
|
2024 |
|
(millions of Canadian dollars) |
|
|
|
|
Assets |
|
|
|
|
Current assets |
|
|
|
|
Cash and cash equivalents |
|
681 |
|
|
448 |
|
Restricted cash |
|
15 |
|
|
11 |
|
Trade receivables and unbilled revenues |
|
221 |
|
|
138 |
|
Other current assets |
|
31 |
|
|
5 |
|
Accounts receivable from affiliates |
|
50 |
|
|
13 |
|
Inventory |
|
45 |
|
|
13 |
|
|
|
1,043 |
|
|
628 |
|
Property, plant and equipment, net |
|
12,543 |
|
|
6,934 |
|
Long-term investments |
|
2 |
|
|
20 |
|
Restricted long-term investments and cash |
|
308 |
|
|
141 |
|
Deferred amounts and other assets |
|
171 |
|
|
145 |
|
Intangible assets, net |
|
83 |
|
|
77 |
|
|
|
14,150 |
|
|
7,945 |
|
Liabilities |
|
|
|
|
Current liabilities |
|
|
|
|
Trade payables and accrued liabilities |
|
325 |
|
|
108 |
|
Other current liabilities |
|
144 |
|
|
124 |
|
Accounts payable to affiliates |
|
1 |
|
|
22 |
|
|
|
470 |
|
|
254 |
|
Other long-term liabilities |
|
1,293 |
|
|
1,133 |
|
Deferred income taxes |
|
9 |
|
|
6 |
|
|
|
1,772 |
|
|
1,393 |
|
|
|
12,378 |
|
|
6,552 |
|
On July 2, 2025, we entered into a credit agreement with Westcoast LP, pursuant to which we provided a one-year non-revolving term credit facility of up to $100 million. As at December 31, 2025, there have been no funds drawn on the credit facility. We did not provide, and did not have obligations to provide, additional financial support to any of our other consolidated VIEs.
UNCONSOLIDATED VARIABLE INTEREST ENTITIES
We also hold interests in unconsolidated VIEs where we are not the primary beneficiary as we do not have the power to direct the activities of the VIEs that most significantly impact the entity's economic performance. These interests include investments in limited partnerships that are assessed to be VIEs due to the limited partners not having substantive participating rights or kick-out rights. The power to direct the activities of a majority of these unconsolidated limited partnership VIEs is shared amongst the partners. Each partner has representatives that make up an executive committee that makes significant decisions for the VIE and none of the partners may make significant decisions unilaterally.
The carrying amount of these VIEs and our estimated maximum exposure to loss as at December 31, 2025 and 2024 are as follows:
|
|
|
|
|
|
|
December 31, 2025 |
Carrying Amount of the VIE |
|
Maximum Exposure to Loss |
|
(millions of Canadian dollars) |
|
|
|
|
Rampion Offshore Wind Limited1 |
|
365 |
|
|
408 |
|
Vector Pipeline2 |
|
179 |
|
|
295 |
|
Woodfibre LNG Limited Partnership3 |
|
2,081 |
|
|
4,490 |
|
Whistler Parent JV4 |
|
949 |
|
|
1,001 |
|
Other3 |
|
187 |
|
|
1,364 |
|
|
|
3,761 |
|
|
7,558 |
|
|
|
|
|
|
|
|
December 31, 2024 |
Carrying Amount of the VIE |
|
Maximum Exposure to Loss |
|
(millions of Canadian dollars) |
|
|
|
|
Rampion Offshore Wind Limited1 |
|
387 |
|
|
490 |
|
Vector Pipeline2 |
|
193 |
|
|
314 |
|
Woodfibre LNG Limited Partnership3 |
|
1,275 |
|
|
3,153 |
|
Whistler Parent JV4 |
|
1,102 |
|
|
1,425 |
|
Other3 |
|
168 |
|
|
501 |
|
|
|
3,125 |
|
|
5,883 |
|
1As at December 31, 2025 and 2024, our maximum exposure to loss includes parental guarantees that have been committed in project contracts in which we would be liable for in the event of default by the VIE and the carrying value of an affiliate dividend receivable of nil and $73 million, respectively.
2Includes Vector Pipeline Limited Partnership in Canada and Vector Pipeline L.P. in the US. As at December 31, 2025 and 2024, our maximum exposure to loss includes the carrying value of outstanding affiliate loans receivable of $11 million and $16 million, respectively, and our share of the VIE's available credit facility for $105 million.
3Our maximum exposure to loss includes parental guarantees and funding obligations that have been committed in connection with the projects for which we would be liable in the event of default by the VIE(s).
4Our maximum exposure to loss included funding obligations that have been committed in project contracts in which we would be liable for in the event of default by the VIE.
With respect to our equity investment in Woodfibre LNG Limited Partnership, we provide certain construction and operational guarantees. Although some guarantees do not contain contractual limitations on potential future payments, our undiscounted estimated maximum exposure to loss related to these guarantees as at December 31, 2025 is approximately $2.4 billion (2024 - $1.9 billion). Construction guarantees expire upon completion of the related construction activities. Operational guarantees are expected to expire over a period ranging from 17 to 42 years. Certain of these guarantees also include contractual indemnification rights that allow us to recover amounts paid under the guarantees from other project participants. These indemnification rights are separate from, and legally independent of, our guarantee obligations.
We did not provide, and did not have obligations to provide, financial support to our unconsolidated VIEs during the years ended December 31, 2025 and 2024. For details on guarantee arrangements entered into with our VIEs refer to Note 31 - Guarantees.
13. LONG-TERM INVESTMENTS
|
|
|
|
|
December 31, |
Ownership
Interest |
|
2025 |
2024 |
(millions of Canadian dollars) |
|
|
|
|
EQUITY INVESTMENTS |
|
|
|
|
Liquids Pipelines |
|
|
|
|
Cactus II Pipeline LLC |
30.0% |
|
594 |
651 |
DCP Midstream, LLC (Class B Units)1 |
90.0% |
|
1,437 |
1,554 |
Illinois Extension Pipeline Company, L.L.C. |
65.0% |
|
566 |
608 |
MarEn Bakken Company LLC2 |
75.0% |
|
2,090 |
2,296 |
Seaway Crude Holdings LLC |
50.0% |
|
2,630 |
2,820 |
Other |
30.0%–62.5% |
|
173 |
96 |
Gas Transmission |
|
|
|
|
DCP Midstream, LLC (Class A Units)3 |
23.4% |
|
736 |
480 |
Delaware Basin Residue, LLC4 |
15.0% |
|
320 |
319 |
Gulfstream Natural Gas System, L.L.C. |
50.0% |
|
1,240 |
1,316 |
Matterhorn Express Pipeline5 |
10.0% |
|
454 |
— |
NEXUS Gas Transmission, LLC |
50.0% |
|
1,223 |
1,301 |
Sabal Trail Transmission, LLC |
50.0% |
|
1,456 |
1,565 |
Southeast Supply Header, LLC |
50.0% |
|
348 |
355 |
Steckman Ridge, LP |
50.0% |
|
104 |
101 |
Vector Pipeline |
60.0% |
|
179 |
193 |
Whistler Parent JV6 |
19.0% |
|
949 |
1,102 |
Woodfibre LNG Limited Partnership |
30.0% |
|
2,081 |
1,275 |
Offshore - various joint ventures |
22.0%–74.3% |
|
294 |
260 |
Other |
21.3%–24.8% |
|
18 |
49 |
Gas Distribution and Storage |
|
|
|
|
Other |
17.0%–50.0% |
|
66 |
67 |
Renewable Power Generation |
|
|
|
|
East-West Tie Limited Partnership7 |
24.1% |
|
— |
106 |
EIH S.à r.l.8 |
51.0% |
|
156 |
89 |
Fox Squirrel Solar LLC |
50.0% |
|
723 |
783 |
Hohe See and Albatros Offshore Wind Facilities |
49.9% |
|
1,641 |
1,606 |
Rampion Offshore Wind Limited |
24.9% |
|
365 |
387 |
Other |
16.4%–50.0% |
|
87 |
93 |
OTHER LONG-TERM INVESTMENTS |
|
|
|
|
Gas Transmission |
|
|
139 |
139 |
Gas Distribution and Storage |
|
|
25 |
27 |
Renewable Power Generation |
|
|
21 |
21 |
Eliminations and Other9 |
|
|
1,149 |
1,032 |
|
|
|
21,264 |
20,691 |
1We own 90.0% of the Class B units of DCP Midstream, LLC. This class of units represents DCP Midstream, LLC's 65.0% interest in Gray Oak Pipeline, LLC (Gray Oak), resulting in a 58.5% interest in Gray Oak through DCP Midstream, LLC. We also have an additional 10.0% direct interest in Gray Oak, bringing our effective interest in Gray Oak to 68.5%.
2We own 75.0% of MarEn Bakken Company LLC, which owns a 49.0% interest in Bakken Pipeline Investments LLC. Bakken Pipeline Investments LLC owns 75.0% of the Bakken Pipeline System, resulting in a 27.6% effective interest in the Bakken Pipeline System held by us. We provide a financing guarantee for certain debt obligations. Our undiscounted maximum exposure to loss related to this guarantee as at December 31, 2025, is approximately $320 million (2024 - $337 million). The guarantee expires in 2029.
3We own 23.4% of the Class A units of DCP Midstream, LLC. These units represent DCP Midstream, LLC's 56.5% interest in DCP Midstream, LP (DCP), resulting in a 13.2% effective interest in DCP held by us.
4On October 31, 2024, we acquired an effective 15.0% interest in Delaware Basin Residue, LLC for consideration of $303 million (US$220 million).
5On June 16, 2025, we acquired a 10% non-operating equity interest in Matterhorn Express natural gas pipeline for $413 million (US$302 million).
6On May 29, 2024, we formed a joint venture with WhiteWater/I Squared Capital and MPLX LP. We hold a 19.0% interest in the joint venture, which owns a 100% interest in the Rio Bravo Pipeline project.
7On March 4, 2025, we closed the sale of our 24.1% equity interest in the East-West Tie Limited Partnership for $130 million.
8EIH S.à r.l. owns a 50.0% interest in Éolien Maritime France SAS (EMF). Through our investment in EMF, we own equity interests in three French offshore wind projects, including effective interests in Saint-Nazaire (25.5%), Fécamp (17.9%) and Courseulles (Calvados) (21.7%).
9Consists of investments in debt securities held by our wholly-owned captive insurance subsidiary. Refer to Note 23 - Risk Management and Financial Instruments.
Equity investments include the unamortized excess of the purchase price over the underlying net book value of the investees' assets at the purchase date. As at December 31, 2025, this basis difference was $3.9 billion (2024 - $3.7 billion), of which $1.8 billion (2024 - $1.7 billion) was amortizable.
For the years ended December 31, 2025, 2024 and 2023, distributions received from equity investments were $2.7 billion, $2.9 billion and $3.1 billion, respectively, which are reported within Operating activities and Investing activities in the Consolidated Statements of Cash Flows.
Summarized combined financial information of our unconsolidated equity investments (presented at 100%) is as follows:
|
|
|
|
|
|
|
|
|
|
Year ended December 31, |
2025 |
|
2024 |
|
2023 |
|
(millions of Canadian dollars) |
|
|
|
|
|
|
Operating revenues |
|
23,721 |
|
|
20,657 |
|
|
22,586 |
|
Operating expenses |
|
16,860 |
|
|
14,692 |
|
|
17,111 |
|
Earnings |
|
6,346 |
|
|
5,177 |
|
|
4,818 |
|
Earnings attributable to Enbridge |
|
2,224 |
|
|
2,304 |
|
|
1,816 |
|
|
|
|
|
|
|
|
December 31, |
2025 |
|
2024 |
|
(millions of Canadian dollars) |
|
|
|
|
Current assets |
|
8,503 |
|
|
8,611 |
|
Non-current assets |
|
72,855 |
|
|
69,381 |
|
Current liabilities |
|
5,049 |
|
|
7,240 |
|
Non-current liabilities |
|
30,800 |
|
|
27,491 |
|
Noncontrolling interests |
|
5,564 |
|
|
4,979 |
|
DISPOSITION
Disposition of Alliance Pipeline and Aux Sable Interests
On April 1, 2024, we closed the sale of our 50.0% interest in the Alliance Pipeline, our interest in Aux Sable and our interest in NRGreen Power Limited Partnership (NRGreen) to Pembina Pipeline Corporation for $3.1 billion, including $327 million of non-recourse debt. A gain on disposal of $1.1 billion before tax, which is net of $1.0 billion of the goodwill from our Gas Transmission segment allocated to the disposal group, is included in Gain on disposition of equity investments in the Consolidated Statements of Earnings for the year ended December 31, 2024. Our equity investments in the Alliance Pipeline and Aux Sable were previously included in our Gas Transmission segment. Our equity investment in NRGreen was previously included in our Renewable Power Generation segment.
OTHER EQUITY INVESTMENT TRANSACTIONS
Joint Venture with WhiteWater/I Squared and MPLX
On May 29, 2024, we formed a joint venture (the Whistler Parent JV) with WhiteWater/I Squared Capital (WhiteWater/I Squared) and MPLX LP (MPLX) that will develop, construct, own and operate natural gas pipeline and storage assets connecting Permian Basin natural gas supply to growing LNG and other US Gulf Coast demand. The Whistler Parent JV is owned by WhiteWater/I Squared (50.6%), MPLX (30.4%) and Enbridge (19.0%) and is accounted for as an equity method investment.
In connection with the formation of the Whistler Parent JV, we contributed our 100% interest in the Rio Bravo Pipeline project and $487 million (US$357 million) of cash to the Whistler Parent JV. In addition to our 19.0% equity interest in the Whistler Parent JV, we received a special equity interest in the Whistler Parent JV which provides for a 25.0% economic interest in the Rio Bravo Pipeline project. This interest is subject to certain redemption rights held by the Whistler Parent JV, which was redeemed on July 17, 2025 for net proceeds of $180 million (US$130 million). After the closing on May 29, 2024, we accrued for our share of the post-closing mandatory capital expenditures of approximately US$150 million for the Rio Bravo Pipeline project.
The contribution of our interest in the Rio Bravo Pipeline project to the Whistler Parent JV in exchange for the equity interests discussed above represents a non-cash transaction in Cash Flows from Investing Activities and does not have an effect on our Consolidated Statements of Cash Flows. This component of the transaction resulted in a reduction of $321 million (US$235 million) to Property, plant and equipment, net and a corresponding increase to Long-term investments in the Consolidated Statements of Financial Position. The cash component of the transaction, as well as subsequent cash payments made for post-closing mandatory capital expenditures, have been reflected as contributions in Cash Flows from Investing Activities.
14. INTANGIBLE ASSETS
|
|
|
|
|
|
|
|
|
|
|
|
|
December 31, 2025 |
Weighted Average
Amortization Rate |
|
Cost |
|
Accumulated
Amortization |
|
Net |
|
(millions of Canadian dollars) |
|
|
|
|
|
|
|
|
Software |
|
10.3 |
% |
|
1,980 |
|
|
(1,244 |
) |
|
736 |
|
Power purchase agreements |
|
4.5 |
% |
|
58 |
|
|
(29 |
) |
|
29 |
|
Project agreement1 |
|
4.0 |
% |
|
164 |
|
|
(56 |
) |
|
108 |
|
Customer relationships |
|
8.6 |
% |
|
2,730 |
|
|
(1,168 |
) |
|
1,562 |
|
Biogas rights agreements2 |
|
3.3 |
% |
|
952 |
|
|
(64 |
) |
|
888 |
|
Other intangible assets |
|
6.2 |
% |
|
674 |
|
|
(277 |
) |
|
397 |
|
Under development |
|
— |
% |
|
271 |
|
|
— |
|
|
271 |
|
|
|
|
|
6,829 |
|
|
(2,838 |
) |
|
3,991 |
|
|
|
|
|
|
|
|
|
|
|
|
|
|
December 31, 2024 |
Weighted Average
Amortization Rate |
|
Cost |
|
Accumulated
Amortization |
|
Net |
|
(millions of Canadian dollars) |
|
|
|
|
|
|
|
|
Software |
|
10.9 |
% |
|
2,109 |
|
|
(1,222 |
) |
|
887 |
|
Power purchase agreements |
|
4.5 |
% |
|
58 |
|
|
(26 |
) |
|
32 |
|
Project agreement1 |
|
4.0 |
% |
|
173 |
|
|
(52 |
) |
|
121 |
|
Customer relationships |
|
8.6 |
% |
|
2,856 |
|
|
(975 |
) |
|
1,881 |
|
Biogas rights agreements2 |
|
3.4 |
% |
|
999 |
|
|
(34 |
) |
|
965 |
|
Other intangible assets |
|
5.8 |
% |
|
665 |
|
|
(234 |
) |
|
431 |
|
Under development |
|
— |
% |
|
270 |
|
|
— |
|
|
270 |
|
|
|
|
|
7,130 |
|
|
(2,543 |
) |
|
4,587 |
|
1Represents a project agreement acquired from the merger of Enbridge and Spectra Energy.
2Biogas rights agreements are amortized on a straight-line basis over the term of the respective agreement, inclusive of extension options, which range from 12 to 41 years (approximately seven years to the next extension period on a weighted-average basis).
For the years ended December 31, 2025, 2024 and 2023, our amortization expense related to intangible assets totaled $534 million, $530 million and $535 million, respectively. Our expected amortization expense associated with existing intangible assets for each of the years 2026 to 2030 is $520 million.
15. GOODWILL
|
|
|
|
|
|
|
|
|
|
|
|
|
|
|
|
|
Liquids
Pipelines |
|
Gas
Transmission |
|
Gas Distribution
and Storage |
|
Renewable Power
Generation |
|
Consolidated |
|
(millions of Canadian dollars) |
|
|
|
|
|
|
|
|
|
|
Balance at January 1, 2024 |
|
8,344 |
|
|
17,727 |
|
|
5,397 |
|
|
380 |
|
|
31,848 |
|
Dispositions3 |
|
— |
|
|
(1,026 |
) |
|
— |
|
|
— |
|
|
(1,026 |
) |
Foreign exchange and other |
|
672 |
|
|
1,354 |
|
|
204 |
|
|
34 |
|
|
2,264 |
|
Acquisition4 |
|
— |
|
|
223 |
|
|
3,291 |
|
|
— |
|
|
3,514 |
|
Balance at December 31, 20241,2 |
|
9,016 |
|
|
18,278 |
|
|
8,892 |
|
|
414 |
|
|
36,600 |
|
Foreign exchange and other |
|
(379 |
) |
|
(747 |
) |
|
(171 |
) |
|
(19 |
) |
|
(1,316 |
) |
Balance at December 31, 20251,2 |
|
8,637 |
|
|
17,531 |
|
|
8,721 |
|
|
395 |
|
|
35,284 |
|
1Gross goodwill as at December 31, 2025 and 2024 was $39.4 billion and $40.7 billion, respectively.
2Accumulated impairment as at December 31, 2025 and 2024 was $4.1 billion.
3In 2024, we derecognized $1.0 billion of goodwill related to the sale of our interests in the Alliance Pipeline and Aux Sable. Refer to Note 13 - Long-Term Investments.
4In 2024, we recorded $895 million of goodwill related to the PSNC Acquisition, $793 million of goodwill related to the Questar Acquisition, $1.6 billion of goodwill related to the EOG Acquisition, and $223 million of goodwill related to the RNG Facilities Acquisition. Refer to Note 8 - Acquisitions and Disposition.
16. OTHER CURRENT LIABILITIES
|
|
|
|
|
|
|
December 31, |
2025 |
|
|
2024 |
|
(millions of Canadian dollars) |
|
|
|
|
Dividends payable |
|
2,150 |
|
|
2,088 |
|
Deferred credits |
|
1,214 |
|
|
1,072 |
|
Taxes payable |
|
901 |
|
|
959 |
|
Derivative liabilities (Note 23) |
|
712 |
|
|
1,335 |
|
Regulatory liabilities (Note 7) |
|
533 |
|
|
616 |
|
Affiliate note payable (Note 29) |
|
228 |
|
|
172 |
|
Asset retirement obligations (Note 18) |
|
113 |
|
|
120 |
|
Federal carbon program liability |
|
— |
|
|
498 |
|
Other |
|
323 |
|
|
381 |
|
|
|
6,174 |
|
|
7,241 |
|
17. DEBT
|
|
|
|
|
December 31, |
Weighted Average Interest Rate8 |
Maturity |
2025 |
2024 |
(millions of Canadian dollars) |
|
|
Enbridge Inc. |
|
|
US dollar senior notes |
5.0% |
2026 - 2054 |
22,550 |
19,703 |
Medium-term notes |
4.6% |
2026 - 2064 |
11,719 |
9,900 |
Sustainability-linked bonds |
4.7% |
2032 - 2033 |
6,924 |
7,146 |
Fixed-to-fixed subordinated term notes1 |
7.2% |
2054 - 2084 |
10,015 |
9,372 |
Fixed-to-floating rate subordinated term notes2 |
5.8% |
2077 - 2078 |
5,964 |
6,139 |
Floating rate notes3 |
|
2028 |
400 |
— |
Commercial paper and credit facility draws |
3.0% |
2027 - 2049 |
6,488 |
5,843 |
Other4 |
|
|
24 |
12 |
Enbridge (U.S.) Inc. |
|
|
Commercial paper and credit facility draws |
4.1% |
2027 - 2030 |
4,636 |
4,707 |
Other4 |
|
|
528 |
276 |
Enbridge Energy Partners, L.P. |
|
|
Senior notes |
6.7% |
2026 - 2045 |
2,673 |
3,524 |
Enbridge Gas Inc. |
|
|
Medium-term notes |
4.2% |
2026 - 2055 |
10,150 |
9,970 |
Debentures |
|
2025 |
— |
125 |
Commercial paper and credit facility draws |
2.4% |
2027 |
1,030 |
530 |
Other4 |
|
|
— |
1 |
Enbridge Pipelines (Southern Lights) LLC |
|
|
Senior notes |
4.0% |
2040 |
618 |
736 |
Enbridge Pipelines Inc. |
|
|
Medium-term notes |
4.3% |
2026 - 2053 |
4,725 |
5,425 |
Commercial paper and credit facility draws |
2.7% |
2027 |
1,024 |
509 |
Other4 |
|
|
— |
2 |
Enbridge Southern Lights LP |
|
|
Senior notes |
4.0% |
2040 |
168 |
183 |
Spectra Energy Capital, LLC |
|
|
Senior notes |
7.1% |
2032 - 2038 |
237 |
248 |
Algonquin Gas Transmission, LLC |
|
|
Senior notes |
4.4% |
2029 - 2034 |
1,165 |
1,222 |
East Tennessee Natural Gas, LLC |
|
|
Senior notes |
5.7% |
2034 |
631 |
662 |
Texas Eastern Transmission, LP |
|
|
Senior notes |
4.7% |
2028 - 2048 |
3,496 |
3,667 |
Spectra Energy Partners, LP |
|
|
Senior notes |
4.4% |
2026 - 2045 |
2,330 |
3,164 |
Blauracke GmbH |
|
|
Senior notes |
2.1% |
2032 |
446 |
471 |
The East Ohio Gas Company |
|
|
Senior notes |
4.3% |
2030 - 2056 |
3,701 |
3,308 |
Other4 |
|
|
23 |
24 |
Questar Gas Company |
|
|
Senior notes |
4.2% |
2027 - 2052 |
1,933 |
2,028 |
Public Service Co. of North Carolina |
|
|
Senior notes |
4.8% |
2026 |
1,576 |
1,654 |
Debentures |
7.2% |
2028 - 2054 |
137 |
144 |
Enbridge Holdings (Tomorrow RNG), LLC |
|
|
Senior notes |
|
|
— |
817 |
Westcoast Energy Inc. |
|
|
Medium-term notes |
6.2% |
2027 - 2041 |
550 |
875 |
Debentures |
7.3% |
2026 |
125 |
275 |
Other4 |
|
|
2 |
— |
Fair value adjustment |
|
|
(430) |
(468) |
Other5 |
|
|
(534) |
(522) |
Total debt6 |
|
|
105,024 |
101,672 |
Current maturities |
|
|
(5,031) |
(7,729) |
Short-term borrowings7 |
|
|
(1,030) |
(529) |
Long-term debt |
|
|
98,963 |
93,414 |
1For an initial five, 5.25, 5.5, 9.75 or 10 years, the notes carry a fixed interest rate. Subsequently, during each reset period the interest rate will be reset to equal to the Five-Year US Treasury Rate or Five-Year Government of Canada bond yield plus a margin. The notes would be converted automatically into Conversion Preference Shares in the event of bankruptcy and related events.
2For an initial five or 10 years, the notes carry a fixed interest rate. Subsequently, the interest rate converts to a floating rate. The notes would be converted automatically into Conversion Preference Shares in the event of bankruptcy and related events.
3Notes carry an interest rate set to equal the Canadian Overnight Repo Rate Average plus a margin of 85 basis points.
4Primarily finance lease obligations.
5Primarily unamortized discounts, premiums and debt issuance costs.
62025 - $43 billion, US$45 billion and €277 million; 2024 - $40 billion, US$43 billion and €316 million. Totals exclude finance lease obligations, unamortized discounts, premiums and debt issuance costs and fair value adjustment.
7Weighted average interest rates on outstanding commercial paper were 2.4% as at December 31, 2025 (2024 - 3.4%).
8Calculated based on term notes, debentures, commercial paper and credit facility draws outstanding as at December 31, 2025.
As at December 31, 2025, all outstanding debt was unsecured.
CREDIT FACILITIES
The following table provides details of our committed credit facilities as at December 31, 2025:
|
|
|
|
|
|
|
|
|
|
|
|
Maturity1 |
Total
Facility |
|
Draws2 |
|
Available |
|
(millions of Canadian dollars) |
|
|
|
|
|
|
|
Enbridge Inc. |
2027-2049 |
|
8,033 |
|
|
6,488 |
|
|
1,545 |
|
Enbridge (U.S.) Inc. |
2027-2030 |
|
10,307 |
|
|
4,636 |
|
|
5,671 |
|
Enbridge Pipelines Inc. |
2027 |
|
2,000 |
|
|
1,024 |
|
|
976 |
|
Enbridge Gas Inc. |
2027 |
|
2,500 |
|
|
1,030 |
|
|
1,470 |
|
Total committed credit facilities |
|
|
22,840 |
|
|
13,178 |
|
|
9,662 |
|
1Maturity date is inclusive of the one-year term out option for certain credit facilities.
2Includes facility draws and commercial paper issuances that are back-stopped by credit facilities.
In July 2025, we renewed approximately $8.8 billion of our 364-day extendible credit facilities, extending the maturity dates to July 2027, which includes a one-year term out provision from July 2026. We also renewed approximately $7.8 billion of our five-year credit facilities, extending the maturity dates to July 2030. Further, we extended the maturity dates of our three-year credit facilities to July 2028.
In July 2025, Enbridge Gas Ontario and Enbridge Pipelines Inc. extended the maturity dates of their $2.5 billion and $2.0 billion 364-day extendible credit facilities, respectively, to July 2027, which includes a one-year term out provision from July 2026.
In addition to the committed credit facilities noted above, we maintain $1.6 billion of uncommitted demand letter of credit facilities, of which $932 million was unutilized as at December 31, 2025. As at December 31, 2024, we had $1.4 billion of uncommitted demand letter of credit facilities, of which $931 million was unutilized.
Our credit facilities carry a weighted average standby fee of 0.1% per annum on the unused portion and draws bear interest at market rates. Certain credit facilities serve as a back-stop to our commercial paper programs and we have the option to extend such facilities, which are currently scheduled to mature from 2027 to 2049.
As at December 31, 2025 and December 31, 2024, commercial paper and credit facility draws, net of short-term borrowings and non-revolving credit facilities that mature within one year, of $12.1 billion and $10.3 billion, respectively, were supported by the availability of long-term committed credit facilities and, therefore, have been classified as long-term debt.
LONG-TERM DEBT ISSUANCES
During the year ended December 31, 2025, we completed the following long-term debt issuances totaling $4.6 billion and US$4.7 billion:
|
|
|
|
|
Company |
Issuance Date |
|
|
Principal
Amount |
(millions of Canadian dollars, unless otherwise stated) |
Enbridge Inc. |
|
February 2025 |
Floating rate medium-term notes due February 20281 |
$400 |
|
February 2025 |
3.55% |
medium-term notes due February 2028 |
$300 |
|
February 2025 |
3.90% |
medium-term notes due February 2030 |
$800 |
|
February 2025 |
4.56% |
medium-term notes due February 2035 |
$700 |
|
February 2025 |
5.32% |
medium-term notes due August 2054 |
$600 |
|
June 2025 |
4.60% |
senior notes due June 2028 |
US$400 |
|
June 2025 |
4.90% |
senior notes due June 2030 |
US$600 |
|
June 2025 |
5.55% |
senior notes due June 2035 |
US$900 |
|
June 2025 |
5.95% |
senior notes due April 2054 |
US$350 |
|
September 2025 |
5.15% |
fixed-to-fixed subordinated notes due December 20552 |
$1,000 |
|
November 2025 |
4.20% |
senior notes due November 2028 |
US$500 |
|
November 2025 |
4.50% |
senior notes due February 2031 |
US$500 |
|
November 2025 |
5.20% |
senior notes due November 2035 |
US$500 |
Enbridge Gas Inc. |
|
September 2025 |
4.16% |
medium-term notes due September 2035 |
$500 |
|
September 2025 |
4.84% |
medium-term notes due September 2055 |
$300 |
The East Ohio Gas Company |
|
June 2025 |
5.68% |
senior notes due June 2035 |
US$250 |
|
June 2025 |
6.32% |
senior notes due June 2055 |
US$250 |
|
December 2025 |
5.23% |
senior notes due March 2036 |
US$250 |
|
December 2025 |
5.95% |
senior notes due March 2056 |
US$150 |
1Notes carry an interest rate set to equal the Canadian Overnight Repo Rate Average plus a margin of 85 basis points.
2For the initial 5.25 years, the notes carry a fixed interest rate. On December 17, 2030, the interest rate will be reset to equal the Five-Year Government of Canada bond yield plus a margin of 2.39%.
LONG-TERM DEBT REPAYMENTS
During the year ended December 31, 2025, we completed the following long-term debt repayments totaling US$3.1 billion, $2.5 billion and €39 million:
|
|
|
|
|
Company |
Repayment Date |
|
|
Principal
Amount |
(millions of Canadian dollars, unless otherwise stated) |
Enbridge Inc. |
|
January 2025 |
2.50% |
senior notes |
US$500 |
|
February 2025 |
2.50% |
senior notes |
US$500 |
|
June 2025 |
2.44% |
medium-term notes |
$550 |
Enbridge Gas Inc. |
|
September 2025 |
3.31% |
medium-term notes |
$400 |
|
September 2025 |
3.19% |
medium-term notes |
$200 |
|
October 2025 |
8.85% |
medium-term notes |
$20 |
|
November 2025 |
8.65% |
debentures |
$125 |
Enbridge Pipelines (Southern Lights) L.L.C. |
|
June and December 2025 |
3.98% |
senior notes |
US$61 |
Enbridge Pipelines Inc. |
|
February 2025 |
4.10% |
medium-term notes1 |
$100 |
|
September 2025 |
3.45% |
medium-term notes |
$600 |
Enbridge Southern Lights LP |
|
June and December 2025 |
4.01% |
senior notes |
$15 |
Westcoast Energy Inc. |
|
July 2025 |
8.85% |
debentures |
$150 |
|
November 2025 |
8.80% |
medium-term notes |
$25 |
|
December 2025 |
3.77% |
medium-term notes |
$300 |
Enbridge Energy Partners, L.P. |
|
July 2025 |
5.88% |
senior notes2 |
US$500 |
Spectra Energy Partners, LP |
|
March 2025 |
3.50% |
senior notes |
US$500 |
Blauracke GmbH |
|
April and October 2025 |
2.10% |
senior notes |
€39 |
Enbridge Holdings (Tomorrow RNG), LLC |
|
January 2025 |
4.97% |
senior notes |
US$309 |
|
January 2025 |
4.97% |
senior notes |
US$85 |
|
January 2025 |
4.97% |
senior notes |
US$19 |
|
December 2025 |
4.80% |
senior notes |
US$7 |
|
December 2025 |
4.80% |
senior notes |
US$90 |
|
December 2025 |
4.80% |
senior notes |
US$58 |
The East Ohio Gas Company |
|
June 2025 |
1.30% |
senior notes |
US$500 |
1The notes carried an original maturity date in July 2112.
2The notes carried an original maturity date in October 2025.
DEBT COVENANTS
Our credit facility agreements and term debt indentures include standard events of default and covenant provisions whereby accelerated repayment and/or termination of the agreements may result if we were to default on payment or violate certain covenants. As at December 31, 2025, we were in compliance with all such debt covenant provisions.
ANNUAL DEBT MATURITIES
As at December 31, 2025, we have commitments as detailed below:
|
|
|
|
|
|
|
|
|
Total |
Less than 1 year |
2 years |
3 years |
4 years |
5 years |
Thereafter |
(millions of Canadian dollars) |
|
|
|
|
|
|
|
Annual debt maturities1 |
104,410 |
4,988 |
8,995 |
4,900 |
5,704 |
12,584 |
67,239 |
1Includes debentures, term notes, commercial paper and credit facility draws based on the facility's maturity date and excludes short-term borrowings, unamortized discounts, premiums, debt issuance costs, finance lease obligations and fair value adjustment. We have the ability under certain debt facilities to call and repay the obligations prior to scheduled maturities. Therefore, the actual timing of future cash repayments could be materially different than presented above.
INTEREST EXPENSE
|
|
|
|
|
|
|
|
|
|
Year ended December 31, |
|
2025 |
|
|
2024 |
|
|
2023 |
|
(millions of Canadian dollars) |
|
|
|
|
|
|
Debentures and term notes |
|
4,688 |
|
|
4,123 |
|
|
3,439 |
|
Commercial paper and credit facility draws |
|
559 |
|
|
439 |
|
|
519 |
|
Amortization of fair value adjustment |
|
31 |
|
|
18 |
|
|
(45 |
) |
Capitalized interest |
|
(255 |
) |
|
(161 |
) |
|
(101 |
) |
|
|
5,023 |
|
|
4,419 |
|
|
3,812 |
|
18. ASSET RETIREMENT OBLIGATIONS
Our ARO relate mostly to the retirement of pipelines, renewable power generation assets, oil and gas wells and production facilities, and obligations related to right-of way agreements and contractual leases for land use.
The discount rates used to estimate the present value of the expected future cash flows for the year ended December 31, 2025 ranged from 3.0% to 9.0% and for the year ended December 31, 2024 ranged from 1.5% to 9.0%.
A reconciliation of movements in our ARO liabilities is as follows:
|
|
|
|
|
|
|
December 31, |
2025 |
|
2024 |
|
(millions of Canadian dollars) |
|
|
|
|
Obligations at beginning of year |
|
666 |
|
|
493 |
|
Liabilities acquired |
|
— |
|
|
185 |
|
Liabilities incurred |
|
368 |
|
|
3 |
|
Liabilities settled |
|
(56 |
) |
|
(139 |
) |
Change in estimate and other |
|
48 |
|
|
51 |
|
Foreign currency translation adjustment |
|
(23 |
) |
|
40 |
|
Accretion expense |
|
29 |
|
|
33 |
|
Obligations at end of year |
|
1,032 |
|
|
666 |
|
Presented as follows: |
|
|
|
|
Other current liabilities (Note 16) |
|
113 |
|
|
120 |
|
Other long-term liabilities |
|
919 |
|
|
546 |
|
|
|
1,032 |
|
|
666 |
|
19. NONCONTROLLING INTERESTS
The following table provides additional information regarding Noncontrolling interests as presented in our Consolidated Statements of Financial Position:
|
|
|
|
|
|
|
December 31, |
|
2025 |
|
|
2024 |
|
(millions of Canadian dollars) |
|
|
|
|
Enbridge Athabasca Midstream Investor Limited Partnership |
|
1,052 |
|
|
1,073 |
|
Renewable energy assets |
|
744 |
|
|
786 |
|
Maritimes & Northeast Pipeline, L.L.C. |
|
562 |
|
|
606 |
|
Algonquin Gas Transmission, LLC |
|
390 |
|
|
414 |
|
Maritimes & Northeast Pipeline Limited Partnership |
|
106 |
|
|
109 |
|
Other |
|
1 |
|
|
5 |
|
|
|
2,855 |
|
|
2,993 |
|
REDEEMABLE NONCONTROLLING INTEREST
Westcoast Energy Limited Partnership
The First Nations Partnership's Class A units are classified as Redeemable NCI within the mezzanine equity section of the Consolidated Statements of Financial Position. As at December 31, 2025, the outstanding Class B and Class C units are held by us.
The First Nations Partnership is required to fund a minimum amount for capital costs related to other than designated capital programs, however, they may elect to fund up to their pro-rata share should it be higher than the minimum amount. Class A and Class B units are issued to the First Nations Partnership and us, respectively, in exchange for this funding.
The changes in our Redeemable NCI were as follows:
|
|
|
|
Year ended December 31, |
2025 |
|
(millions of Canadian dollars) |
|
|
Balance at beginning of year |
|
— |
|
Proceeds from investment by redeemable noncontrolling interest in subsidiary |
|
736 |
|
Transaction costs, net of deferred tax benefit |
|
(27 |
) |
Earnings attributable to redeemable noncontrolling interest |
|
28 |
|
Distributions declared to unitholder |
|
(35 |
) |
Contributions from unitholder |
|
6 |
|
Redemption value adjustment |
|
28 |
|
Balance at end of year |
|
736 |
|
The First Nations Partnership’s ownership percentage decreased from 12.50% on transaction close to 12.47% as at December 31, 2025, as a result of contributing less than their pro-rata share of capital costs for other than designated capital programs.
20. SHARE CAPITAL
Our authorized share capital consists of an unlimited number of common shares with no par value and an unlimited number of preference shares.
|
|
|
|
|
|
|
|
|
|
|
|
|
|
|
|
|
|
|
|
2025 |
|
2024 |
|
2023 |
|
|
Number |
|
|
|
Number |
|
|
|
Number |
|
|
|
December 31, |
of Shares |
|
Amount |
|
of Shares |
|
Amount |
|
of Shares |
|
Amount |
|
(millions of Canadian dollars; number of shares in millions) |
|
|
|
|
|
|
|
|
|
|
|
|
Balance at beginning of year |
|
2,178 |
|
|
71,738 |
|
|
2,125 |
|
|
69,180 |
|
|
2,025 |
|
|
64,760 |
|
Shares issued, net of issue costs and tax |
|
— |
|
|
— |
|
|
51 |
|
|
2,489 |
|
|
103 |
|
|
4,485 |
|
Shares issued on exercise of stock options |
|
3 |
|
|
89 |
|
|
1 |
|
|
39 |
|
|
— |
|
|
3 |
|
Shares issued on vesting of RSUs |
|
1 |
|
|
49 |
|
|
1 |
|
|
30 |
|
|
— |
|
|
12 |
|
Share repurchases at stated value1 |
|
— |
|
|
— |
|
|
— |
|
|
— |
|
|
(3 |
) |
|
(80 |
) |
Balance at end of year |
|
2,182 |
|
|
71,876 |
|
|
2,178 |
|
|
71,738 |
|
|
2,125 |
|
|
69,180 |
|
1.Reflects the repurchase and cancellation of common shares under our normal course issuer bid.
On May 15, 2024, we filed prospectus supplements in Canada and the US to establish an at-the-market equity issuance program (the ATM Program) that allowed us to issue and sell, at our discretion, up to $2.75 billion (or the US dollar equivalent) of our common shares from treasury to the public from time to time at the market prices prevailing at the time of sale through the Toronto Stock Exchange, the New York Stock Exchange (NYSE) or any other marketplace in Canada or the US where the common shares may be traded.
During the period from May 15, 2024 to July 31, 2024, 51,298,629 common shares were issued and sold under the ATM Program at average prices of CAD$48.72 and US$35.77 per common share for aggregate gross proceeds of $2.50 billion ($2.48 billion, net of aggregate commissions paid of $16.3 million and other issuance costs). On August 1, 2024, we terminated the ATM Program. Net proceeds from sales of common shares under the ATM Program were used to partially fund the Questar Acquisition and PSNC Acquisition and to pay related fees and expenses.
On September 8, 2023, we closed a public offering of 102,913,500 common shares at a price of $44.70 per share for gross proceeds of $4.6 billion which were also used to finance a portion of the aggregate cash consideration payable for the Acquisitions discussed in Note 8 - Acquisitions and Disposition.
PREFERENCE SHARES
|
|
|
|
|
|
|
|
|
|
|
|
|
|
|
|
|
|
|
|
2025 |
|
2024 |
|
2023 |
|
|
Number |
|
|
|
Number |
|
|
|
Number |
|
|
|
December 31, |
of Shares |
|
Amount |
|
of Shares |
|
Amount |
|
of Shares |
|
Amount |
|
(millions of Canadian dollars; number of shares in millions) |
|
|
|
|
|
|
|
|
|
|
|
|
Preference Shares, Series A |
|
5 |
|
|
125 |
|
|
5 |
|
|
125 |
|
|
5 |
|
|
125 |
|
Preference Shares, Series B |
|
20 |
|
|
500 |
|
|
20 |
|
|
500 |
|
|
20 |
|
|
500 |
|
Preference Shares, Series D |
|
18 |
|
|
450 |
|
|
18 |
|
|
450 |
|
|
18 |
|
|
450 |
|
Preference Shares, Series F |
|
18 |
|
|
454 |
|
|
18 |
|
|
454 |
|
|
18 |
|
|
454 |
|
Preference Shares, Series G |
|
2 |
|
|
46 |
|
|
2 |
|
|
46 |
|
|
2 |
|
|
46 |
|
Preference Shares, Series H |
|
12 |
|
|
291 |
|
|
12 |
|
|
291 |
|
|
12 |
|
|
291 |
|
Preference Shares, Series I |
|
2 |
|
|
59 |
|
|
2 |
|
|
59 |
|
|
2 |
|
|
59 |
|
Preference Shares, Series L |
|
16 |
|
|
411 |
|
|
16 |
|
|
411 |
|
|
16 |
|
|
411 |
|
Preference Shares, Series N |
|
18 |
|
|
450 |
|
|
18 |
|
|
450 |
|
|
18 |
|
|
450 |
|
Preference Shares, Series P |
|
16 |
|
|
400 |
|
|
16 |
|
|
400 |
|
|
16 |
|
|
400 |
|
Preference Shares, Series R |
|
16 |
|
|
400 |
|
|
16 |
|
|
400 |
|
|
16 |
|
|
400 |
|
Preference Shares, Series 1 |
|
16 |
|
|
411 |
|
|
16 |
|
|
411 |
|
|
16 |
|
|
411 |
|
Preference Shares, Series 3 |
|
22 |
|
|
562 |
|
|
22 |
|
|
562 |
|
|
24 |
|
|
600 |
|
Preference Shares, Series 41 |
|
2 |
|
|
38 |
|
|
2 |
|
|
38 |
|
|
— |
|
|
— |
|
Preference Shares, Series 5 |
|
8 |
|
|
206 |
|
|
8 |
|
|
206 |
|
|
8 |
|
|
206 |
|
Preference Shares, Series 7 |
|
10 |
|
|
250 |
|
|
10 |
|
|
250 |
|
|
10 |
|
|
250 |
|
Preference Shares, Series 9 |
|
11 |
|
|
275 |
|
|
11 |
|
|
275 |
|
|
11 |
|
|
275 |
|
Preference Shares, Series 11 |
|
20 |
|
|
500 |
|
|
20 |
|
|
500 |
|
|
20 |
|
|
500 |
|
Preference Shares, Series 13 |
|
14 |
|
|
350 |
|
|
14 |
|
|
350 |
|
|
14 |
|
|
350 |
|
Preference Shares, Series 15 |
|
11 |
|
|
275 |
|
|
11 |
|
|
275 |
|
|
11 |
|
|
275 |
|
Preference Shares, Series 19 |
|
20 |
|
|
500 |
|
|
20 |
|
|
500 |
|
|
20 |
|
|
500 |
|
Issuance costs |
|
|
|
(135 |
) |
|
|
|
(135 |
) |
|
|
|
(135 |
) |
Balance at end of year |
|
|
|
6,818 |
|
|
|
|
6,818 |
|
|
|
|
6,818 |
|
1On September 1, 2024, 1,502,775 of the outstanding Preference Shares, Series 3 were converted into Preference Shares, Series 4.
Characteristics of our outstanding preference shares are as follows:
|
|
|
|
|
|
|
Dividend Rate |
Dividend1 |
Per Share Base Redemption Value2,3 |
Redemption and Conversion Option Date2,3 |
Right to Convert Into3,4 |
(Canadian dollars unless otherwise stated) |
|
|
|
|
|
Preference Shares, Series A |
5.50% |
$1.37500 |
$25 |
— |
— |
Preference Shares, Series B |
5.20% |
$1.30050 |
$25 |
June 1, 2027 |
Series C |
Preference Shares, Series D |
5.41% |
$1.35300 |
$25 |
March 1, 2028 |
Series E |
Preference Shares, Series F |
5.54% |
$1.38450 |
$25 |
June 1, 2028 |
Series G |
Preference Shares, Series G5 |
4.84% |
$1.21000 |
$25 |
June 1, 2028 |
Series F |
Preference Shares, Series H |
6.11% |
$1.52800 |
$25 |
September 1, 2028 |
Series I |
Preference Shares, Series I6 |
4.45% |
$1.11250 |
$25 |
September 1, 2028 |
Series H |
Preference Shares, Series L |
5.86% |
US$1.46448 |
US$25 |
September 1, 2027 |
Series M |
Preference Shares, Series N |
6.70% |
$1.67400 |
$25 |
December 1, 2028 |
Series O |
Preference Shares, Series P |
5.92% |
$1.47950 |
$25 |
March 1, 2029 |
Series Q |
Preference Shares, Series R |
6.31% |
$1.57850 |
$25 |
June 1, 2029 |
Series S |
Preference Shares, Series 1 |
6.70% |
US$1.67593 |
US$25 |
June 1, 2028 |
Series 2 |
Preference Shares, Series 3 |
5.29% |
$1.32200 |
$25 |
September 1, 2029 |
Series 4 |
Preference Shares, Series 47 |
4.71% |
$1.17750 |
$25 |
September 1, 2029 |
Series 3 |
Preference Shares, Series 5 |
6.68% |
US$1.67075 |
US$25 |
March 1, 2029 |
Series 6 |
Preference Shares, Series 7 |
5.99% |
$1.49700 |
$25 |
March 1, 2029 |
Series 8 |
Preference Shares, Series 9 |
5.67% |
$1.41800 |
$25 |
December 1, 2029 |
Series 10 |
Preference Shares, Series 118 |
5.48% |
$1.36925 |
$25 |
March 1, 2030 |
Series 12 |
Preference Shares, Series 139 |
5.40% |
$1.34875 |
$25 |
June 1, 2030 |
Series 14 |
Preference Shares, Series 1510 |
5.63% |
$1.40650 |
$25 |
September 1, 2030 |
Series 16 |
Preference Shares, Series 19 |
6.21% |
$1.55300 |
$25 |
March 1, 2028 |
Series 20 |
1The holder is entitled to receive a fixed cumulative quarterly preferential dividend, as declared by the Board of Directors. With the exception of Preference Shares, Series A, such fixed dividend rate resets every five years beginning on the initial Redemption and Conversion Option Date. Preference Shares, Series G, Series I and Series 4 contain a feature where the dividend rate resets on a quarterly basis. The Preference Shares, Series 19 contain a feature where the fixed dividend rate, when reset every five years, will not be less than 4.90%. No other series of preference shares has this feature.
2Preference Shares, Series A may be redeemed any time at our option. For all other series of preference shares, we may at our option, redeem all or a portion of the outstanding preference shares for the Per Share Base Redemption Value plus all accrued and unpaid dividends on the Redemption Option Date and on every fifth anniversary thereafter.
3The holder will have the right, subject to certain conditions, to convert their shares into Cumulative Redeemable Preference Shares of a specified series on a one-for-one basis on the Conversion Option Date and every fifth anniversary thereafter at an ascribed issue price equal to the Per Share Base Redemption Value.
4With the exception of Preference Shares, Series A, after the Redemption and Conversion Option Date, holders may elect to receive quarterly floating rate cumulative dividends per share at a rate equal to: $25 x (number of days in quarter/number of days in year) x three-month Government of Canada treasury bill rate + 2.4% (Series C), 2.4% (Series E), 2.5% (Series G), 2.1% (Series I), 2.7% (Series O), 2.5% (Series Q), 2.5% (Series S), 2.4% (Series 4), 2.6% (Series 8), 2.7% (Series 10), 2.6% (Series 12), 2.7% (Series 14), 2.7% (Series 16), or 3.2% (Series 20); or US$25 x (number of days in quarter/number of days in year) x three-month US Government treasury bill rate + 3.2% (Series M), 3.1% (Series 2), or 2.8% (Series 6).
5The quarterly dividend per share paid on Preference Shares, Series G was decreased to $0.29836 from $0.32411 on December 1, 2025 due to reset on a quarterly basis.
6The quarterly dividend per share paid on Preference Shares, Series I was decreased to $0.27432 from $0.29980 on December 1, 2025 due to reset on a quarterly basis.
7The quarterly dividend per share paid on Preference Shares, Series 4 was decreased to $0.29034 from $0.31601 on December 1, 2025 due to reset on a quarterly basis.
8The quarterly dividend per share paid on Preference Shares, Series 11 was increased to $0.34231 from $0.24613 on March 1, 2025,due to the reset of the annual dividend on March 1, 2025.
9The quarterly dividend per share paid on Preference Shares, Series 13 was increased to $0.33719 from $0.19019 on June 1, 2025 due to the reset of the annual dividend on June 1, 2025.
10 The quarterly dividend per share paid on Preference Shares, Series 15 was increased to $0.35163 from $0.18644 on September 1, 2025 due to the reset of the annual dividend on September 1, 2025.
SHAREHOLDER RIGHTS PLAN
The Shareholder Rights Plan is designed to encourage the fair treatment of our shareholders in connection with any takeover offer. Rights issued under the plan become exercisable when a person and any related parties acquires or announces its intention to acquire 20% or more of our outstanding common shares without complying with certain provisions set out in the plan or without approval of our Board of Directors. Should such an acquisition occur, each rights holder, other than the acquiring person and related parties, will have the right to purchase our common shares at a 50% discount to the market price at that time.
21. STOCK OPTION AND STOCK UNIT PLANS
We maintain three primary vehicles under our long-term incentive plan (the Plan): ISOs, PSUs and RSUs. Total stock-based compensation expense recorded for the years ended December 31, 2025, 2024 and 2023 was $285 million, $186 million and $154 million, respectively. The number of common shares authorized for share-settled awards under the Plan was 181 million as at December 31, 2025, 2024 and 2023.
INCENTIVE STOCK OPTIONS
Certain key employees are granted ISOs to purchase common shares at the grant date market price. ISOs vest in equal annual installments over a four-year period and expire 10 years after the issue date.
|
|
|
|
|
December 31, 2025 |
Number |
Weighted Average Exercise Price |
Weighted Average Remaining Contractual Life (years) |
Aggregate Intrinsic Value |
(number of options in thousands; weighted average exercise price in Canadian dollars; intrinsic value in millions of Canadian dollars) |
|
|
|
|
Options outstanding at beginning of year |
25,324 |
50.31 |
|
|
Options granted |
3,146 |
60.13 |
|
|
Options exercised1 |
(10,200) |
51.03 |
|
|
Options cancelled or expired |
(584) |
56.25 |
|
|
Options outstanding at end of year |
17,686 |
51.45 |
6.3 |
214 |
Options vested at end of year2 |
8,780 |
50.17 |
4.7 |
116 |
1The total intrinsic value of ISOs exercised during the years ended December 31, 2025, 2024 and 2023 was $123 million, $18 million and $2 million, respectively, and cash received on exercise was $28 million, $1 million and nil, respectively.
2The total fair value of ISOs vested during the years ended December 31, 2025, 2024 and 2023 was $17 million, $17 million and $20 million, respectively.
Weighted average assumptions used to determine the fair value of ISOs granted using the Black-Scholes-Merton model are as follows:
|
|
|
|
Year ended December 31, |
2025 |
2024 |
2023 |
Fair value per option (Canadian dollars)1 |
6.97 |
4.07 |
6.05 |
Valuation assumptions |
|
|
|
Expected option term (years)2 |
6 |
6 |
6 |
Expected volatility3 |
21.2% |
21.1% |
22.2% |
Expected dividend yield4 |
6.3% |
8.1% |
6.7% |
Risk-free interest rate5 |
3.6% |
3.8% |
3.5% |
1Options granted to US employees are based on the NYSE prices. The option value and assumptions shown are based on a weighted average of the US and Canadian options. The fair value per option for the years ended December 31, 2025, 2024 and 2023 were $5.76, $3.53 and $5.38, respectively, for Canadian employees and US$5.88, US$3.58 and US$5.23, respectively, for US employees.
2The expected option term is six years based on historical exercise practice and five years for retirement eligible employees.
3Expected volatility is determined with reference to historic daily share price volatility and consideration of the implied volatility observable in call option values near the grant date.
4The expected dividend yield is the current annual dividend at the grant date divided by the current stock price.
5The risk-free interest rate is based on the Government of Canada's Canadian bond yields and the US Treasury bond yields at the grant date.
Compensation expense recorded for the years ended December 31, 2025, 2024 and 2023 for ISOs was $21 million, $19 million and $18 million, respectively. As at December 31, 2025, unrecognized compensation expense related to non-vested ISOs was $12 million. The expense is expected to be fully recognized over a weighted average period of approximately two years.
PERFORMANCE STOCK UNITS
PSUs are granted to certain key employees where cash awards are paid following a three-year performance cycle. Awards are calculated by multiplying the number of units outstanding at the end of the performance period by Enbridge's weighted average share price for 20 days prior to the maturity of the grant and by a performance multiplier. The performance multiplier ranges from zero, if our performance fails to meet threshold performance levels, to a maximum of 2.0 if we perform within the highest range of the performance targets. The performance multiplier is derived through a calculation of our Total Shareholder Return percentile rank relative to a specified peer group of companies and our distributable cash flow per share, adjusted for unusual, infrequent or other non-operating factors, relative to targets established at the time of grant, as well as a greenhouse gas reduction component. To calculate the 2025 expense, a multiplier of 1.68 was used for 2025 PSU grants, 1.82 for 2024 PSU grants and 1.32 for 2023 PSU grants.
|
|
|
|
December 31, 2025 |
Number |
Weighted Average Remaining Contractual Life (years) |
Aggregate Intrinsic Value |
(number of units in thousands; intrinsic value in millions of Canadian dollars) |
|
|
|
Units outstanding at beginning of year |
3,402 |
|
|
Units granted |
1,071 |
|
|
Units cancelled |
(101) |
|
|
Units matured1 |
(938) |
|
|
Dividend reinvestment |
195 |
|
|
Units outstanding at end of year |
3,629 |
1.9 |
386 |
1.The total amount paid during the years ended December 31, 2025, 2024 and 2023 for PSUs was $60 million, $65 million and $123 million, respectively.
Compensation expense recorded for the years ended December 31, 2025, 2024 and 2023 for PSUs was $164 million, $75 million and $59 million, respectively. As at December 31, 2025, unrecognized compensation expense related to non-vested PSUs was $100 million. The expense is expected to be fully recognized over a weighted average period of approximately one-and-a-half years.
RESTRICTED STOCK UNITS
Employees may also be granted cash-settled or share-settled RSUs under the Plan. Share-settled awards granted to non-executive senior management employees vest following a three-year maturity period. Share-settled units are also granted to non-executive employees and vest either on each of the first, second and third anniversaries of the grant date, or following a 12-month period. Cash-settled RSUs are given to non-executive employees and are paid in equal installments on each of the first, second and third anniversaries of the grant date.
RSU holders receive cash or shares equal to Enbridge's weighted average share price for 20 days prior to the maturity of the grant multiplied by the number of units outstanding on the maturity date.
|
|
|
|
|
December 31, 2025 |
Number |
Weighted Average Grant Date Fair Value1 |
Weighted Average Remaining Contractual Life (years) |
Aggregate Intrinsic Value |
(number of units in thousands; intrinsic value in millions of Canadian dollars) |
|
|
|
|
Units outstanding at beginning of year |
3,591 |
51.10 |
|
|
Units granted |
1,435 |
59.30 |
|
|
Units cancelled or expired |
(130) |
52.98 |
|
|
Units matured2 |
(1,680) |
50.95 |
|
|
Dividend reinvestment |
212 |
52.60 |
|
|
Units outstanding at end of year |
3,428 |
53.54 |
0.9 |
184 |
1Weighted average grant date fair value excludes cash-settled units.
2The total amount paid during the years ended December 31, 2025, 2024 and 2023 for RSUs was $23 million, $40 million and $56 million, respectively.
Compensation expense recorded for the years ended December 31, 2025, 2024 and 2023 for RSUs was $100 million, $92 million and $77 million, respectively. As at December 31, 2025, unrecognized compensation expense related to non-vested RSUs was $63 million. The expense is expected to be fully recognized over a weighted average period of approximately one-and-a-half years.
22. COMPONENTS OF ACCUMULATED OTHER COMPREHENSIVE INCOME
Changes in AOCI attributable to our common shareholders for the years ended December 31, 2025, 2024 and 2023 are as follows:
|
|
|
|
|
|
|
|
|
|
|
|
|
|
|
|
|
|
|
|
|
|
|
Cash
Flow
Hedges |
|
Excluded
Components
of Fair Value
Hedges |
|
Net
Investment
Hedges |
|
Cumulative
Translation
Adjustment |
|
Equity
Investees
and Other
Investments |
|
Pension
and
OPEB
Adjustment |
|
Total |
|
(millions of Canadian dollars) |
|
|
|
|
|
|
|
|
|
|
|
|
|
|
Balance as at January 1, 2025 |
|
407 |
|
|
(14 |
) |
|
(2,033 |
) |
|
8,452 |
|
|
1 |
|
|
302 |
|
|
7,115 |
|
Other comprehensive income/(loss) retained in AOCI |
|
46 |
|
|
12 |
|
|
419 |
|
|
(3,080 |
) |
|
23 |
|
|
237 |
|
|
(2,343 |
) |
Other comprehensive (income)/loss reclassified to earnings |
|
|
|
|
|
|
|
|
|
|
|
|
|
|
Interest rate contracts1 |
|
30 |
|
|
— |
|
|
— |
|
|
— |
|
|
— |
|
|
— |
|
|
30 |
|
Foreign exchange contracts2 |
|
— |
|
|
(3 |
) |
|
— |
|
|
— |
|
|
— |
|
|
— |
|
|
(3 |
) |
Amortization of pension and OPEB actuarial gain3 |
|
— |
|
|
— |
|
|
— |
|
|
— |
|
|
— |
|
|
(39 |
) |
|
(39 |
) |
|
|
76 |
|
|
9 |
|
|
419 |
|
|
(3,080 |
) |
|
23 |
|
|
198 |
|
|
(2,355 |
) |
Tax impact |
|
|
|
|
|
|
|
|
|
|
|
|
|
|
Income tax on amounts retained in AOCI |
|
(18 |
) |
|
4 |
|
|
— |
|
|
— |
|
|
1 |
|
|
(73 |
) |
|
(86 |
) |
Income tax on amounts reclassified to earnings |
|
(3 |
) |
|
1 |
|
|
— |
|
|
— |
|
|
— |
|
|
9 |
|
|
7 |
|
|
|
(21 |
) |
|
5 |
|
|
— |
|
|
— |
|
|
1 |
|
|
(64 |
) |
|
(79 |
) |
Balance as at December 31, 2025 |
|
462 |
|
|
— |
|
|
(1,614 |
) |
|
5,372 |
|
|
25 |
|
|
436 |
|
|
4,681 |
|
|
|
|
|
|
|
|
|
|
|
|
|
|
|
|
|
|
|
|
|
|
|
|
Cash
Flow
Hedges |
|
Excluded
Components
of Fair Value
Hedges |
|
Net
Investment
Hedges |
|
Cumulative
Translation
Adjustment |
|
Equity
Investees
and Other
Investments |
|
Pension
and
OPEB
Adjustment |
|
Total |
|
(millions of Canadian dollars) |
|
|
|
|
|
|
|
|
|
|
|
|
|
|
Balance as at January 1, 2024 |
|
320 |
|
|
(23 |
) |
|
(728 |
) |
|
2,653 |
|
|
11 |
|
|
70 |
|
|
2,303 |
|
Other comprehensive income/(loss) retained in AOCI |
|
79 |
|
|
(42 |
) |
|
(1,305 |
) |
|
5,799 |
|
|
(9 |
) |
|
323 |
|
|
4,845 |
|
Other comprehensive (income)/loss reclassified to earnings |
|
|
|
|
|
|
|
|
|
|
|
|
|
|
Interest rate contracts1 |
|
31 |
|
|
— |
|
|
— |
|
|
— |
|
|
— |
|
|
— |
|
|
31 |
|
Commodity contracts4 |
|
(1 |
) |
|
— |
|
|
— |
|
|
— |
|
|
— |
|
|
— |
|
|
(1 |
) |
Foreign exchange contracts2 |
|
— |
|
|
53 |
|
|
— |
|
|
— |
|
|
— |
|
|
— |
|
|
53 |
|
Amortization of pension and OPEB actuarial gain3 |
|
— |
|
|
— |
|
|
— |
|
|
— |
|
|
— |
|
|
(21 |
) |
|
(21 |
) |
|
|
109 |
|
|
11 |
|
|
(1,305 |
) |
|
5,799 |
|
|
(9 |
) |
|
302 |
|
|
4,907 |
|
Tax impact |
|
|
|
|
|
|
|
|
|
|
|
|
|
|
Income tax on amounts retained in AOCI |
|
(15 |
) |
|
10 |
|
|
— |
|
|
— |
|
|
(1 |
) |
|
(75 |
) |
|
(81 |
) |
Income tax on amounts reclassified to earnings |
|
(7 |
) |
|
(12 |
) |
|
— |
|
|
— |
|
|
— |
|
|
5 |
|
|
(14 |
) |
|
|
(22 |
) |
|
(2 |
) |
|
— |
|
|
— |
|
|
(1 |
) |
|
(70 |
) |
|
(95 |
) |
Balance as at December 31, 2024 |
|
407 |
|
|
(14 |
) |
|
(2,033 |
) |
|
8,452 |
|
|
1 |
|
|
302 |
|
|
7,115 |
|
|
|
|
|
|
|
|
|
|
|
|
|
|
|
|
|
|
|
|
|
|
|
|
Cash
Flow
Hedges |
|
Excluded
Components
of Fair Value
Hedges |
|
Net
Investment
Hedges |
|
Cumulative
Translation
Adjustment |
|
Equity
Investees
and Other
Investments |
|
Pension
and
OPEB
Adjustment |
|
Total |
|
(millions of Canadian dollars) |
|
|
|
|
|
|
|
|
|
|
|
|
|
|
Balance as at January 1, 2023 |
|
121 |
|
|
(35 |
) |
|
(1,137 |
) |
|
4,348 |
|
|
5 |
|
|
218 |
|
|
3,520 |
|
Other comprehensive income/(loss) retained in AOCI |
|
232 |
|
|
62 |
|
|
409 |
|
|
(1,695 |
) |
|
6 |
|
|
(158 |
) |
|
(1,144 |
) |
Other comprehensive (income)/loss reclassified to earnings |
|
|
|
|
|
|
|
|
|
|
|
|
|
|
Interest rate contracts1 |
|
28 |
|
|
— |
|
|
— |
|
|
— |
|
|
— |
|
|
— |
|
|
28 |
|
Foreign exchange contracts2 |
|
— |
|
|
(47 |
) |
|
— |
|
|
— |
|
|
— |
|
|
— |
|
|
(47 |
) |
Amortization of pension and OPEB actuarial gain3 |
|
— |
|
|
— |
|
|
— |
|
|
— |
|
|
— |
|
|
(24 |
) |
|
(24 |
) |
|
|
260 |
|
|
15 |
|
|
409 |
|
|
(1,695 |
) |
|
6 |
|
|
(182 |
) |
|
(1,187 |
) |
Tax impact |
|
|
|
|
|
|
|
|
|
|
|
|
|
|
Income tax on amounts retained in AOCI |
|
(47 |
) |
|
(14 |
) |
|
— |
|
|
— |
|
|
— |
|
|
28 |
|
|
(33 |
) |
Income tax on amounts reclassified to earnings |
|
(14 |
) |
|
11 |
|
|
— |
|
|
— |
|
|
— |
|
|
6 |
|
|
3 |
|
|
|
(61 |
) |
|
(3 |
) |
|
— |
|
|
— |
|
|
— |
|
|
34 |
|
|
(30 |
) |
Balance as at December 31, 2023 |
|
320 |
|
|
(23 |
) |
|
(728 |
) |
|
2,653 |
|
|
11 |
|
|
70 |
|
|
2,303 |
|
1Reported within Interest expense in the Consolidated Statements of Earnings.
2Reported within Interest expense and Other income/(expense) in the Consolidated Statements of Earnings.
3These components are included in the computation of net periodic benefit credit and are reported within Other income/(expense) in the Consolidated Statements of Earnings.
4Reported within Transportation and other services revenues in the Consolidated Statements of Earnings.
23. RISK MANAGEMENT AND FINANCIAL INSTRUMENTS
MARKET RISK
Our earnings, cash flows and OCI are subject to movements in foreign exchange rates, interest rates, commodity prices and our share price (collectively, market risks). Formal risk management policies, processes and systems have been designed to mitigate these risks.
The following summarizes the types of market risks to which we are exposed and the risk management instruments used to mitigate them. We use a combination of qualifying and non-qualifying derivative instruments to manage the risks noted below.
Foreign Exchange Risk
We generate certain revenues, incur expenses and hold a number of investments and subsidiaries that are denominated in currencies other than Canadian dollars. As a result, our earnings, cash flows and OCI are exposed to fluctuations resulting from foreign exchange rate variability.
We employ financial derivative instruments to hedge foreign currency denominated earnings exposure. A combination of qualifying and non-qualifying derivative instruments is used to hedge anticipated foreign currency denominated revenues and expenses and to manage variability in cash flows. We hedge certain net investments in US dollar-denominated investments and subsidiaries using US dollar-denominated debt.
Interest Rate Risk
Our earnings, cash flows and OCI are exposed to short-term interest rate variability due to the regular repricing of our variable rate debt, primarily commercial paper. We have a policy of limiting the maximum floating rate debt to 30% of total debt outstanding. We monitor and adjust our debt portfolio mix of fixed and variable rate debt instruments, along with the use of derivative instruments, to support compliance with our policy. We have implemented a program to partially mitigate the impact of short-term interest rate volatility on interest expense via the execution of floating-to-fixed interest rate swaps and costless collars. These swaps have an average fixed rate of 2.8%.
We are exposed to changes in the fair value of fixed rate debt that arise as a result of changes in market interest rates. Pay floating-receive fixed interest rate swaps are used, when applicable, to hedge against future changes to the fair value of fixed rate debt which mitigates the impact of fluctuations in fair value. Executed fixed-to-floating interest rate swaps have an average swap rate of 2.8%.
Our earnings and cash flows are also exposed to variability in longer term interest rates ahead of anticipated fixed rate term debt issuances. A combination of qualifying and non-qualifying forward starting interest rate swaps are used to hedge against the effect of future interest rate movements. We have established a program including some of our subsidiaries to partially mitigate our exposure to long-term interest rate variability on forecasted term debt issuances via execution of floating-to-fixed interest rate swaps with an average swap rate of 3.4%.
Commodity Price Risk
Our earnings, cash flows and OCI are exposed to changes in commodity prices as a result of our ownership interests in certain assets and investments, as well as through the activities of our energy marketing subsidiaries. These commodities include natural gas, crude oil, power and NGL. We employ financial and physical derivative instruments to fix a portion of the variable price exposures that arise from physical transactions involving these commodities. For our US Gas Utilities, changes in derivatives' fair values are deferred as regulatory assets or liabilities until settlement. We use primarily non-qualifying derivative instruments to manage commodity price risk.
Equity Price Risk
Equity price risk is the risk of earnings fluctuations due to changes in our share price. We have exposure to our own common share price through the issuance of various forms of stock-based compensation, which affect earnings through the revaluation of outstanding units every period.
TOTAL DERIVATIVE INSTRUMENTS
We have a policy of entering into individual International Swaps and Derivatives Association, Inc. (ISDA) agreements, or other similar derivative agreements, with the majority of our financial derivative counterparties. These agreements provide for the net settlement of derivative instruments outstanding with specific counterparties in the event of bankruptcy or other significant credit events and reduce our credit risk exposure on financial derivative asset positions in those circumstances.
The following tables summarize the Consolidated Statements of Financial Position location and carrying value of our derivative instruments, as well as the maximum potential settlement amounts, in the event of the specific circumstances described above.
|
|
|
|
|
|
|
|
|
|
|
|
|
|
|
|
|
|
|
December 31, 2025 |
Derivative
Instruments Used as
Cash Flow Hedges |
|
Derivative
Instruments
Used as
Fair Value
Hedges |
|
Non-
Qualifying
Derivative
Instruments |
|
Total Gross
Derivative
Instruments
as Presented |
|
Amounts
Available
for Offset |
|
Total Net
Derivative
Instruments |
|
(millions of Canadian dollars) |
|
|
|
|
|
|
|
|
|
|
|
|
Other current assets |
|
|
|
|
|
|
|
|
|
|
|
|
Foreign exchange contracts |
|
— |
|
|
— |
|
|
27 |
|
|
27 |
|
|
(17 |
) |
|
10 |
|
Interest rate contracts |
|
79 |
|
|
5 |
|
|
22 |
|
|
106 |
|
|
(37 |
) |
|
69 |
|
Commodity contracts |
|
— |
|
|
— |
|
|
458 |
|
|
458 |
|
|
(192 |
) |
|
266 |
|
|
|
79 |
|
|
5 |
|
|
507 |
|
|
591 |
|
|
(246 |
) |
|
345 |
|
Deferred amounts and other assets |
|
|
|
|
|
|
|
|
|
|
|
|
Foreign exchange contracts |
|
— |
|
|
— |
|
|
52 |
|
|
52 |
|
|
(24 |
) |
|
28 |
|
Interest rate contracts |
|
9 |
|
|
— |
|
|
108 |
|
|
117 |
|
|
(27 |
) |
|
90 |
|
Commodity contracts |
|
— |
|
|
— |
|
|
124 |
|
|
124 |
|
|
(20 |
) |
|
104 |
|
|
|
9 |
|
|
— |
|
|
284 |
|
|
293 |
|
|
(71 |
) |
|
222 |
|
Other current liabilities |
|
|
|
|
|
|
|
|
|
|
|
|
Foreign exchange contracts |
|
— |
|
|
— |
|
|
(364 |
) |
|
(364 |
) |
|
17 |
|
|
(347 |
) |
Interest rate contracts |
|
(9 |
) |
|
— |
|
|
(39 |
) |
|
(48 |
) |
|
37 |
|
|
(11 |
) |
Commodity contracts |
|
— |
|
|
— |
|
|
(300 |
) |
|
(300 |
) |
|
192 |
|
|
(108 |
) |
|
|
(9 |
) |
|
— |
|
|
(703 |
) |
|
(712 |
) |
|
246 |
|
|
(466 |
) |
Other long-term liabilities |
|
|
|
|
|
|
|
|
|
|
|
|
Foreign exchange contracts |
|
— |
|
|
— |
|
|
(819 |
) |
|
(819 |
) |
|
24 |
|
|
(795 |
) |
Interest rate contracts |
|
— |
|
|
(34 |
) |
|
(50 |
) |
|
(84 |
) |
|
27 |
|
|
(57 |
) |
Commodity contracts |
|
— |
|
|
— |
|
|
(92 |
) |
|
(92 |
) |
|
20 |
|
|
(72 |
) |
|
|
— |
|
|
(34 |
) |
|
(961 |
) |
|
(995 |
) |
|
71 |
|
|
(924 |
) |
Total net derivative asset/(liability) |
|
|
|
|
|
|
|
|
|
|
|
|
Foreign exchange contracts |
|
— |
|
|
— |
|
|
(1,104 |
) |
|
(1,104 |
) |
|
— |
|
|
(1,104 |
) |
Interest rate contracts |
|
79 |
|
|
(29 |
) |
|
41 |
|
|
91 |
|
|
— |
|
|
91 |
|
Commodity contracts |
|
— |
|
|
— |
|
|
190 |
|
|
190 |
|
|
— |
|
|
190 |
|
|
|
79 |
|
|
(29 |
) |
|
(873 |
) |
|
(823 |
) |
|
— |
|
|
(823 |
) |
|
|
|
|
|
|
|
|
|
|
|
|
|
|
|
|
|
|
|
December 31, 2024 |
Derivative
Instruments Used as
Cash Flow Hedges |
|
Derivative
Instruments
Used as
Fair Value
Hedges |
|
Non-
Qualifying
Derivative
Instruments |
|
Total Gross
Derivative
Instruments
as Presented |
|
Amounts
Available
for Offset |
|
Total Net
Derivative
Instruments |
|
(millions of Canadian dollars) |
|
|
|
|
|
|
|
|
|
|
|
|
Other current assets |
|
|
|
|
|
|
|
|
|
|
|
|
Foreign exchange contracts |
|
— |
|
|
78 |
|
|
47 |
|
|
125 |
|
|
(29 |
) |
|
96 |
|
Interest rate contracts |
|
44 |
|
|
— |
|
|
23 |
|
|
67 |
|
|
(39 |
) |
|
28 |
|
Commodity contracts |
|
2 |
|
|
— |
|
|
360 |
|
|
362 |
|
|
(191 |
) |
|
171 |
|
Other contracts |
|
— |
|
|
— |
|
|
3 |
|
|
3 |
|
|
— |
|
|
3 |
|
|
|
46 |
|
|
78 |
|
|
433 |
|
|
557 |
|
|
(259 |
) |
|
298 |
|
Deferred amounts and other assets |
|
|
|
|
|
|
|
|
|
|
|
|
Foreign exchange contracts |
|
— |
|
|
— |
|
|
83 |
|
|
83 |
|
|
(71 |
) |
|
12 |
|
Interest rate contracts |
|
9 |
|
|
— |
|
|
137 |
|
|
146 |
|
|
(27 |
) |
|
119 |
|
Commodity contracts |
|
— |
|
|
— |
|
|
197 |
|
|
197 |
|
|
(39 |
) |
|
158 |
|
|
|
9 |
|
|
— |
|
|
417 |
|
|
426 |
|
|
(137 |
) |
|
289 |
|
Other current liabilities |
|
|
|
|
|
|
|
|
|
|
|
|
Foreign exchange contracts |
|
— |
|
|
(73 |
) |
|
(731 |
) |
|
(804 |
) |
|
29 |
|
|
(775 |
) |
Interest rate contracts |
|
(58 |
) |
|
— |
|
|
(22 |
) |
|
(80 |
) |
|
39 |
|
|
(41 |
) |
Commodity contracts |
|
— |
|
|
— |
|
|
(451 |
) |
|
(451 |
) |
|
191 |
|
|
(260 |
) |
|
|
(58 |
) |
|
(73 |
) |
|
(1,204 |
) |
|
(1,335 |
) |
|
259 |
|
|
(1,076 |
) |
Other long-term liabilities |
|
|
|
|
|
|
|
|
|
|
|
|
Foreign exchange contracts |
|
— |
|
|
— |
|
|
(1,579 |
) |
|
(1,579 |
) |
|
71 |
|
|
(1,508 |
) |
Interest rate contracts |
|
— |
|
|
— |
|
|
(80 |
) |
|
(80 |
) |
|
27 |
|
|
(53 |
) |
Commodity contracts |
|
(1 |
) |
|
— |
|
|
(238 |
) |
|
(239 |
) |
|
39 |
|
|
(200 |
) |
|
|
(1 |
) |
|
— |
|
|
(1,897 |
) |
|
(1,898 |
) |
|
137 |
|
|
(1,761 |
) |
Total net derivative asset/(liability) |
|
|
|
|
|
|
|
|
|
|
|
|
Foreign exchange contracts |
|
— |
|
|
5 |
|
|
(2,180 |
) |
|
(2,175 |
) |
|
— |
|
|
(2,175 |
) |
Interest rate contracts |
|
(5 |
) |
|
— |
|
|
58 |
|
|
53 |
|
|
— |
|
|
53 |
|
Commodity contracts |
|
1 |
|
|
— |
|
|
(132 |
) |
|
(131 |
) |
|
— |
|
|
(131 |
) |
Other contracts |
|
— |
|
|
— |
|
|
3 |
|
|
3 |
|
|
— |
|
|
3 |
|
|
|
(4 |
) |
|
5 |
|
|
(2,251 |
) |
|
(2,250 |
) |
|
— |
|
|
(2,250 |
) |
The following table summarizes the maturity and notional principal or quantity outstanding related to our derivative instruments:
|
|
|
|
|
|
|
|
|
|
|
|
|
|
|
|
|
|
|
|
|
|
|
|
|
|
|
|
2025 |
|
2024 |
|
As at December 31, |
2026 |
|
|
2027 |
|
|
2028 |
|
|
2029 |
|
|
2030 |
|
Thereafter |
|
Total |
|
Total |
|
Foreign exchange contracts - US dollar forwards - purchase (millions of US dollars) |
|
1,027 |
|
|
— |
|
|
— |
|
|
— |
|
|
— |
|
|
— |
|
|
1,027 |
|
|
1,245 |
|
Foreign exchange contracts - US dollar forwards - sell (millions of US dollars) |
|
6,406 |
|
|
5,321 |
|
|
4,332 |
|
|
2,358 |
|
|
1,110 |
|
|
360 |
|
|
19,887 |
|
|
21,614 |
|
Foreign exchange contracts - US dollar collars - sell (millions of US dollars) |
|
180 |
|
|
180 |
|
|
120 |
|
|
— |
|
|
— |
|
|
— |
|
|
480 |
|
|
— |
|
Foreign exchange contracts - British pound (GBP) forwards - sell (millions of GBP) |
|
28 |
|
|
32 |
|
|
— |
|
|
— |
|
|
— |
|
|
— |
|
|
60 |
|
|
90 |
|
Foreign exchange contracts - Euro forwards - sell (millions of Euro) |
|
121 |
|
|
81 |
|
|
67 |
|
|
66 |
|
|
65 |
|
|
64 |
|
|
464 |
|
|
590 |
|
Foreign exchange contracts - Japanese yen forwards - purchase (millions of yen) |
|
— |
|
|
— |
|
|
— |
|
|
— |
|
|
— |
|
|
— |
|
|
— |
|
|
84,800 |
|
Interest rate contracts - short-term pay fixed rate (millions of Canadian dollars) |
|
3,897 |
|
|
2,846 |
|
|
2,220 |
|
|
1,003 |
|
|
— |
|
|
— |
|
|
9,966 |
|
|
4,771 |
|
Interest rate contracts - receive fixed rate (millions of Canadian dollars) |
|
1,500 |
|
|
1,500 |
|
|
1,500 |
|
|
1,500 |
|
|
1,500 |
|
|
5,816 |
|
|
13,316 |
|
|
— |
|
Interest rate contracts - long-term pay fixed rate (millions of Canadian dollars)1 |
|
4,204 |
|
|
468 |
|
|
— |
|
|
— |
|
|
— |
|
|
— |
|
|
4,672 |
|
|
5,284 |
|
Interest rate contracts - costless collar (millions of Canadian dollars) |
|
1,955 |
|
|
1,823 |
|
|
77 |
|
|
— |
|
|
— |
|
|
— |
|
|
3,855 |
|
|
2,316 |
|
Commodity contracts - natural gas (billions of cubic feet)2 |
|
123 |
|
|
66 |
|
|
29 |
|
|
12 |
|
|
6 |
|
|
— |
|
|
236 |
|
|
288 |
|
Commodity contracts - crude oil (millions of barrels)2 |
|
(5 |
) |
|
13 |
|
|
1 |
|
|
1 |
|
|
1 |
|
|
— |
|
|
11 |
|
|
25 |
|
Commodity contracts - power (megawatt per hour (MW/H)) |
|
145 |
|
|
85 |
|
|
55 |
|
|
29 |
|
|
(2 |
) |
|
(2 |
) |
34³ |
|
(5)3 |
|
1Represents the notional amount of long-term debt issuances hedged.
2Represents the notional amount of net purchase/(sale).
3Total is an average net purchase/(sale) of power.
Derivatives Designated as Fair Value Hedges
The following table presents interest rate and foreign exchange derivative instruments that are designated and qualify as fair value hedges. The realized and unrealized gain or loss on the derivative is included in Other income/ (expense) or Interest expense in the Consolidated Statements of Earnings. The offsetting loss or gain on the hedged item attributable to the hedged risk is included in Other income/(expense) or Interest expense in the Consolidated Statements of Earnings. Any excluded components are included in the Consolidated Statements of Comprehensive Income.
|
|
|
|
|
|
|
Year ended December 31, |
|
2025 |
|
|
2024 |
|
(millions of Canadian dollars) |
|
|
|
|
Unrealized loss on derivative |
|
(43 |
) |
|
(3 |
) |
Unrealized gain on hedged item |
|
28 |
|
|
6 |
|
Realized gain on derivative |
|
25 |
|
|
26 |
|
Realized loss on hedged item |
|
(23 |
) |
|
(79 |
) |
The Effect of Derivative Instruments on the Statements of Earnings and Comprehensive Income
The following table presents the effect of cash flow hedges and fair value hedges on our consolidated earnings and comprehensive income, before the effect of income taxes:
|
|
|
|
|
|
|
|
|
|
Year ended December 31, |
2025 |
|
2024 |
|
2023 |
|
(millions of Canadian dollars) |
|
|
|
|
|
|
Amount of unrealized gain/(loss) recognized in OCI |
|
|
|
|
|
|
Cash flow hedges |
|
|
|
|
|
|
Interest rate contracts |
|
46 |
|
|
67 |
|
|
201 |
|
Commodity contracts |
|
— |
|
|
19 |
|
|
68 |
|
Other contracts |
|
— |
|
|
1 |
|
|
(2 |
) |
Fair value hedges |
|
|
|
|
|
|
Foreign exchange contracts |
|
12 |
|
|
(42 |
) |
|
15 |
|
|
|
58 |
|
|
45 |
|
|
282 |
|
Amount of (income)/loss reclassified from AOCI to earnings |
|
|
|
|
|
|
Foreign exchange contracts¹ |
|
(3 |
) |
|
53 |
|
|
— |
|
Interest rate contracts² |
|
30 |
|
|
31 |
|
|
28 |
|
Commodity contracts³ |
|
— |
|
|
(1 |
) |
|
— |
|
|
|
27 |
|
|
83 |
|
|
28 |
|
1Reported within Interest expense and Other income/(expense) in the Consolidated Statements of Earnings.
2Reported within Interest expense in the Consolidated Statements of Earnings.
3Reported within Transportation and other services revenues in the Consolidated Statements of Earnings.
We estimate that a gain of $9 million from AOCI related to cash flow hedges will be reclassified to earnings in the next 12 months. Actual amounts reclassified to earnings depend on the foreign exchange rates, interest rates and commodity prices in effect when derivative contracts that are currently outstanding mature. For all forecasted transactions, the maximum term over which we are hedging exposures to the variability of cash flows is two years as at December 31, 2025.
Non-Qualifying Derivatives
The following table presents the unrealized gains and losses associated with changes in the fair value of our non-qualifying derivatives:
|
|
|
|
|
|
|
|
|
|
Year ended December 31, |
2025 |
|
2024 |
|
2023 |
|
(millions of Canadian dollars) |
|
|
|
|
|
|
Foreign exchange contracts1 |
|
1,076 |
|
|
(2,033 |
) |
|
1,292 |
|
Interest rate contracts2 |
|
(17 |
) |
|
112 |
|
|
(63 |
) |
Commodity contracts3 |
|
322 |
|
|
(53 |
) |
|
(41 |
) |
Other contracts4 |
|
(3 |
) |
|
2 |
|
|
(8 |
) |
Total unrealized derivative fair value gain/(loss), net |
|
1,378 |
|
|
(1,972 |
) |
|
1,180 |
|
1For the respective years ended, reported within Transportation and other services revenues (2025 - nil; 2024 - nil; 2023 - $645 million gain) and Other income/(expense) (2025 - $1.1 billion loss; 2024 - $2 billion loss; 2023 - $647 million gain) in the Consolidated Statements of Earnings.
2Reported within Interest expense in the Consolidated Statements of Earnings.
3For the respective years ended, reported within Transportation and other services revenues (2025 - $102 million gain; 2024 - $23 million loss; 2023 - $35 million loss), Commodity sales (2025 - $34 million loss; 2024 - $92 million loss; 2023 - $153 million gain), Commodity costs (2025 - $190 million gain; 2024 - $31 million loss; 2023 - $94 million loss), Operating and administrative expense (2025 - $20 million gain; 2024 - $17 million loss; 2023 - $65 million loss) in the Consolidated Statements of Earnings. The fair value change in our US Gas Utilities is deferred as regulatory assets/(liabilities) (2025 - $44 million gain; 2024 - $110 million gain; 2023 - nil).
4Reported within Operating and administrative expense in the Consolidated Statements of Earnings.
LIQUIDITY RISK
Liquidity risk is the risk that we will not be able to meet our financial obligations, including commitments and guarantees, as they become due. In order to mitigate this risk, we forecast cash requirements over a 12-month rolling time period to determine whether sufficient funds will be available. Our primary sources of liquidity and capital resources are funds generated from operations, the issuance of commercial paper and draws under committed credit facilities and long-term debt, which includes debentures and medium-term notes. Our shelf prospectuses with securities regulators enable ready access to either the Canadian or US public capital markets, subject to market conditions. In addition, we maintain sufficient liquidity through committed credit facilities with a diversified group of banks and institutions which, if necessary, enables us to fund all anticipated requirements for approximately one year without accessing the capital markets. We were in compliance with all the terms and conditions of our committed credit facility agreements and term debt indentures as at December 31, 2025. As a result, all credit facilities are available to us and the banks are obligated to fund us under the terms of the facilities. We also identify other potential sources of debt and equity funding alternatives, including reinstatement of our dividend reinvestment and share purchase plan or at-the-market equity issuances.
CREDIT RISK
Entering into derivative instruments may result in exposure to credit risk from the possibility that a counterparty will default on its contractual obligations. In order to mitigate this risk, we enter into risk management transactions primarily with institutions that possess strong investment grade credit ratings. Credit risk relating to derivative counterparties is mitigated through the maintenance and monitoring of credit exposure limits, contractual requirements and netting arrangements. We also review counterparty financial strength using external credit rating services and other analytical tools to manage credit risk.
We have credit concentrations and credit exposure, with respect to derivative instruments, in the following counterparty segments:
|
|
|
|
|
|
|
December 31, |
2025 |
|
2024 |
|
(millions of Canadian dollars) |
|
|
|
|
Canadian financial institutions |
|
200 |
|
|
344 |
|
US financial institutions |
|
260 |
|
|
128 |
|
European financial institutions |
|
57 |
|
|
116 |
|
Asian financial institutions |
|
39 |
|
|
53 |
|
Other1 |
|
302 |
|
|
332 |
|
|
|
858 |
|
|
973 |
|
1Other is comprised of commodity clearing house and crude oil, natural gas and power counterparties.
As at December 31, 2025, we did not provide any letters of credit in lieu of providing cash collateral to our counterparties pursuant to the terms of the relevant ISDA agreements. We held no cash collateral on derivative asset exposures as at December 31, 2025 and December 31, 2024.
Gross derivative balances have been presented without the effects of collateral posted. Derivative assets are adjusted for non-performance risk of our counterparties using their credit default swap spread rates and are reflected at fair value. For derivative liabilities, our non-performance risk is considered in the valuation.
Credit risk also arises from trade and other long-term receivables, and is mitigated through credit exposure limits and contractual requirements, the assessment of counterparty credit ratings and netting arrangements. Within the Gas Distribution and Storage segment, credit risk is mitigated by the large and diversified customer base and the ability to recover expected credit losses through the ratemaking process. We actively monitor the financial strength of large industrial customers and, in select cases, have obtained additional security to minimize the risk of default on receivables. Generally, we utilize a loss allowance matrix which contemplates historical credit losses by age of receivables, adjusted for any forward-looking information and management expectations to measure lifetime expected credit losses of receivables. The maximum exposure to credit risk related to non-derivative financial assets is their carrying value.
FAIR VALUE MEASUREMENTS
Our financial assets and liabilities measured at fair value on a recurring basis include derivatives and other financial instruments. We also disclose the fair value of other financial instruments not measured at fair value. The fair value of financial instruments reflects our best estimates of market value based on generally accepted valuation techniques or models and is supported by observable market prices and rates. When such values are not available, we use discounted cash flow analysis from applicable yield curves based on observable market inputs to estimate fair value.
FAIR VALUE OF FINANCIAL INSTRUMENTS
We categorize our financial instruments measured at fair value into one of three different levels depending on the observability of the inputs employed in the measurement.
Level 1
Level 1 includes financial instruments measured at fair value based on unadjusted quoted prices for identical assets and liabilities in active markets that are accessible at the measurement date. An active market for a financial instrument is considered to be a market where transactions occur with sufficient frequency and volume to provide pricing information on an ongoing basis. Under the fair value hierarchy, cash and cash equivalents are classified as Level 1. Our Level 1 instruments consist primarily of exchange-traded derivatives used to mitigate the risk of crude oil price fluctuations, US and Canadian treasury bills, and investments in exchange-traded funds held by our captive insurance subsidiary. We also hold restricted long-term investments in exchange-traded funds and common shares in trusts in accordance with the CER's regulatory requirements under the LMCI and to cover future pipeline decommissioning costs in the state of Minnesota.
Level 2
Level 2 includes financial instrument valuations determined using directly or indirectly observable inputs other than quoted prices included within Level 1. Financial instruments in this category are valued using models or other industry standard valuation techniques derived from observable market data. Such valuation techniques include inputs such as quoted forward prices, time value, volatility factors and broker quotes that can be observed or corroborated in the market for the entire duration of the financial instrument. Derivatives valued using Level 2 inputs include non-exchange traded derivatives such as over-the-counter foreign exchange forward and cross-currency swap contracts, interest rate swaps, physical forward commodity contracts, as well as commodity swaps and options for which observable inputs can be obtained.
We have also categorized the fair value of our long-term debt, investments in debt securities held by our captive insurance subsidiary, and restricted long-term investments in Canadian government bonds held in trust in accordance with the CER's regulatory requirements under the LMCI as Level 2. The fair value of our long-term debt is based on quoted market prices for instruments of similar credit risk and tenor. When possible, the fair value of our restricted long-term investments is based on quoted market prices for similar instruments and, if not available, based on broker quotes.
Level 3
Level 3 includes derivative valuations based on inputs which are less observable, unavailable or where the observable data does not support a significant portion of the derivative's fair value. Generally, Level 3 derivatives are longer dated transactions, occur in less active markets, occur at locations where pricing information is not available or have no binding broker quote to support Level 2 classification. We have developed methodologies, benchmarked against industry standards, to determine fair value for these derivatives based on the extrapolation of observable future prices and rates. Derivatives valued using Level 3 inputs primarily include long-dated derivative power, NGL and natural gas contracts, basis swaps, commodity swaps, and power and energy swaps, physical forward commodity contracts, as well as options. We do not have any other financial instruments categorized in Level 3.
We use the most observable inputs available to estimate the fair value of our derivatives. When possible, we estimate the fair value of our derivatives based on quoted market prices. If quoted market prices are not available, we use estimates from third-party brokers. For non-exchange traded derivatives classified in Levels 2 and 3, we use standard valuation techniques to calculate the estimated fair value. These methods include discounted cash flows for forwards and swaps and Black-Scholes-Merton pricing models for options. Depending on the type of derivative and nature of the underlying risk, we use observable market prices (interest, foreign exchange, commodity and share price) and volatility as primary inputs to these valuation techniques. Finally, we consider our own credit default swap spread, as well as the credit default swap spreads associated with our counterparties, in our estimation of fair value.
Fair Value of Derivatives
We have categorized our derivative assets and liabilities measured at fair value as follows:
|
|
|
|
|
|
|
|
|
|
|
|
|
December 31, 2025 |
Level 1 |
|
Level 2 |
|
Level 3 |
|
Total Gross
Derivative
Instruments |
|
(millions of Canadian dollars) |
|
|
|
|
|
|
|
|
Financial assets |
|
|
|
|
|
|
|
|
Current derivative assets |
|
|
|
|
|
|
|
|
Foreign exchange contracts |
|
— |
|
|
27 |
|
|
— |
|
|
27 |
|
Interest rate contracts |
|
— |
|
|
106 |
|
|
— |
|
|
106 |
|
Commodity contracts |
|
70 |
|
|
59 |
|
|
329 |
|
|
458 |
|
|
|
70 |
|
|
192 |
|
|
329 |
|
|
591 |
|
Long-term derivative assets |
|
|
|
|
|
|
|
|
Foreign exchange contracts |
|
— |
|
|
52 |
|
|
— |
|
|
52 |
|
Interest rate contracts |
|
— |
|
|
117 |
|
|
— |
|
|
117 |
|
Commodity contracts |
|
— |
|
|
7 |
|
|
117 |
|
|
124 |
|
|
|
— |
|
|
176 |
|
|
117 |
|
|
293 |
|
Financial liabilities |
|
|
|
|
|
|
|
|
Current derivative liabilities |
|
|
|
|
|
|
|
|
Foreign exchange contracts |
|
— |
|
|
(364 |
) |
|
— |
|
|
(364 |
) |
Interest rate contracts |
|
— |
|
|
(48 |
) |
|
— |
|
|
(48 |
) |
Commodity contracts |
|
(55 |
) |
|
(68 |
) |
|
(177 |
) |
|
(300 |
) |
|
|
(55 |
) |
|
(480 |
) |
|
(177 |
) |
|
(712 |
) |
Long-term derivative liabilities |
|
|
|
|
|
|
|
|
Foreign exchange contracts |
|
— |
|
|
(819 |
) |
|
— |
|
|
(819 |
) |
Interest rate contracts |
|
— |
|
|
(84 |
) |
|
— |
|
|
(84 |
) |
Commodity contracts |
|
— |
|
|
(11 |
) |
|
(81 |
) |
|
(92 |
) |
|
|
— |
|
|
(914 |
) |
|
(81 |
) |
|
(995 |
) |
Total net financial asset/(liability) |
|
|
|
|
|
|
|
|
Foreign exchange contracts |
|
— |
|
|
(1,104 |
) |
|
— |
|
|
(1,104 |
) |
Interest rate contracts |
|
— |
|
|
91 |
|
|
— |
|
|
91 |
|
Commodity contracts |
|
15 |
|
|
(13 |
) |
|
188 |
|
|
190 |
|
|
|
15 |
|
|
(1,026 |
) |
|
188 |
|
|
(823 |
) |
|
|
|
|
|
|
|
|
|
|
|
|
|
December 31, 2024 |
Level 1 |
|
Level 2 |
|
Level 3 |
|
Total Gross
Derivative
Instruments |
|
(millions of Canadian dollars) |
|
|
|
|
|
|
|
|
Financial assets |
|
|
|
|
|
|
|
|
Current derivative assets |
|
|
|
|
|
|
|
|
Foreign exchange contracts |
|
— |
|
|
125 |
|
|
— |
|
|
125 |
|
Interest rate contracts |
|
— |
|
|
67 |
|
|
— |
|
|
67 |
|
Commodity contracts |
|
34 |
|
|
72 |
|
|
256 |
|
|
362 |
|
Other contracts |
|
— |
|
|
3 |
|
|
— |
|
|
3 |
|
|
|
34 |
|
|
267 |
|
|
256 |
|
|
557 |
|
Long-term derivative assets |
|
|
|
|
|
|
|
|
Foreign exchange contracts |
|
— |
|
|
83 |
|
|
— |
|
|
83 |
|
Interest rate contracts |
|
— |
|
|
146 |
|
|
— |
|
|
146 |
|
Commodity contracts |
|
1 |
|
|
14 |
|
|
182 |
|
|
197 |
|
|
|
1 |
|
|
243 |
|
|
182 |
|
|
426 |
|
Financial liabilities |
|
|
|
|
|
|
|
|
Current derivative liabilities |
|
|
|
|
|
|
|
|
Foreign exchange contracts |
|
— |
|
|
(804 |
) |
|
— |
|
|
(804 |
) |
Interest rate contracts |
|
— |
|
|
(80 |
) |
|
— |
|
|
(80 |
) |
Commodity contracts |
|
(52 |
) |
|
(116 |
) |
|
(283 |
) |
|
(451 |
) |
|
|
(52 |
) |
|
(1,000 |
) |
|
(283 |
) |
|
(1,335 |
) |
Long-term derivative liabilities |
|
|
|
|
|
|
|
|
Foreign exchange contracts |
|
— |
|
|
(1,579 |
) |
|
— |
|
|
(1,579 |
) |
Interest rate contracts |
|
— |
|
|
(80 |
) |
|
— |
|
|
(80 |
) |
Commodity contracts |
|
(1 |
) |
|
(31 |
) |
|
(207 |
) |
|
(239 |
) |
|
|
(1 |
) |
|
(1,690 |
) |
|
(207 |
) |
|
(1,898 |
) |
Total net financial asset/(liability) |
|
|
|
|
|
|
|
|
Foreign exchange contracts |
|
— |
|
|
(2,175 |
) |
|
— |
|
|
(2,175 |
) |
Interest rate contracts |
|
— |
|
|
53 |
|
|
— |
|
|
53 |
|
Commodity contracts |
|
(18 |
) |
|
(61 |
) |
|
(52 |
) |
|
(131 |
) |
Other contracts |
|
— |
|
|
3 |
|
|
— |
|
|
3 |
|
|
|
(18 |
) |
|
(2,180 |
) |
|
(52 |
) |
|
(2,250 |
) |
The significant unobservable inputs used in the fair value measurement of Level 3 derivative instruments were as follows:
|
|
|
|
|
|
|
|
|
|
|
|
|
|
|
December 31, 2025 |
Fair
Value |
|
Unobservable
Input |
Minimum
Price/
Volatility |
|
Maximum
Price/Volatility |
|
Weighted
Average Price/Volatility |
|
Unit of
Measurement |
(fair value in millions of Canadian dollars) |
|
|
|
|
|
|
|
|
|
|
Commodity contracts - financial¹ |
|
|
|
|
|
|
|
|
|
|
Natural gas |
|
6 |
|
Forward gas price |
|
3.47 |
|
|
26.99 |
|
|
4.99 |
|
$/mmbtu2 |
Crude |
|
51 |
|
Forward crude price |
|
59.10 |
|
|
81.17 |
|
|
72.99 |
|
$/barrel |
Power |
|
(7 |
) |
Forward power price |
|
33.74 |
|
|
196.77 |
|
|
73.14 |
|
$/MW/H |
Commodity contracts - physical¹ |
|
|
|
|
|
|
|
|
|
|
Natural gas |
|
(4 |
) |
Forward gas price |
|
1.13 |
|
|
21.65 |
|
|
4.32 |
|
$/mmbtu2 |
Crude |
|
(36 |
) |
Forward crude price |
|
58.39 |
|
|
112.73 |
|
|
78.13 |
|
$/barrel |
Power |
|
(9 |
) |
Forward power price |
|
28.67 |
|
|
153.83 |
|
|
74.75 |
|
$/MW/H |
Commodity options3 |
|
|
|
|
|
|
|
|
|
|
Natural gas |
|
187 |
|
Forward gas price |
|
3.94 |
|
|
12.09 |
|
|
7.37 |
|
$/mmbtu2 |
|
|
|
Price volatility |
5% |
|
76% |
|
49% |
|
|
|
|
188 |
|
|
|
|
|
|
|
|
|
1Financial and physical forward commodity contracts are valued using a market approach valuation technique.
2One million British thermal units (mmbtu).
3Commodity options contracts are valued using an option model valuation technique.
If adjusted, the significant unobservable inputs disclosed in the table above would have a direct impact on the fair value of our Level 3 derivative instruments. The significant unobservable inputs used in the fair value measurement of Level 3 derivative instruments include forward commodity prices. Changes in forward commodity prices could result in significantly different fair values for our Level 3 derivatives.
Changes in the net fair value of derivative assets and liabilities classified as Level 3 in the fair value hierarchy were as follows:
|
|
|
|
|
|
|
Year ended December 31, |
2025 |
|
2024 |
|
(millions of Canadian dollars) |
|
|
|
|
Level 3 net derivative liability at beginning of period |
|
(52 |
) |
|
(131 |
) |
Total gain/(loss), unrealized |
|
|
|
|
Included in earnings¹ |
|
31 |
|
|
(92 |
) |
Included in OCI |
|
— |
|
|
19 |
|
Included in regulatory assets/liabilities |
|
18 |
|
|
130 |
|
Settlements |
|
191 |
|
|
22 |
|
Level 3 net derivative asset/(liability) at end of period |
|
188 |
|
|
(52 |
) |
1Reported within Transportation and other services revenues, Commodity costs and Operating and administrative expense in the Consolidated Statements of Earnings.
There were no transfers into or out of Level 3 as at December 31, 2025 or December 31, 2024.
Net Investment Hedges
We currently have designated a portion of our US dollar-denominated debt as a hedge of our net investment in US dollar-denominated investments and subsidiaries.
During the years ended December 31, 2025 and 2024, we recognized unrealized foreign exchange gains of $500 million and losses of $1.2 billion, respectively, on the translation of US dollar-denominated debt, in OCI. During the years ended December 31, 2025 and 2024, we recognized realized losses of $81 million and $120 million, respectively, associated with the settlement of US dollar-denominated debt that had matured during the period, in OCI.
Fair Value of Other Financial Instruments
Certain long-term investments in other entities with no actively quoted prices are classified as FVMA investments and are recorded at cost less impairment. The carrying value of FVMA investments totaled $185 million and $187 million as at December 31, 2025 and December 31, 2024, respectively.
We have restricted long-term investments and cash held in trust for the purpose of funding pipeline abandonment in accordance with the CER's regulatory requirements under the LMCI, to cover future pipeline decommissioning costs in the state of Minnesota and to satisfy retirement obligations as Wexpro properties are abandoned. These investments are classified as available-for-sale, recognized at fair value and included in Restricted long-term investments and cash in the Consolidated Statements of Financial Position. As at December 31, 2025, the fair value of investments in Level 1 and Level 2 was $877 million and $416 million, respectively (December 31, 2024 - $491 million and $507 million, respectively). Our Level 2 investments had a cost basis of $426 million as at December 31, 2025 (December 31, 2024 - $540 million). There were unrealized holding gains of $99 million and $33 million on these investments for the years ended December 31, 2025 and 2024, respectively. Within Other long-term liabilities we had estimated future abandonment costs related to LMCI of $949 million and $826 million as at December 31, 2025 and 2024, respectively (Note 7). During the year ended December 31, 2025, we purchased and sold investments totaling $1.3 billion and $1.1 billion, respectively (2024 - purchases of $492 million and sales of $390 million). The resulting net cash flow impact is presented under Cash Flows from Investing Activities in the Consolidated Statements of Cash Flows.
We have a wholly-owned captive insurance subsidiary whose principal activity is providing insurance and reinsurance coverage for certain insurable property and casualty risk exposures of our operating subsidiaries and certain equity investments. As at December 31, 2025, the fair value of investments in equity funds and debt securities held by our captive insurance subsidiary was nil and $1.2 billion, respectively (December 31, 2024 - $114 million and $1.1 billion, respectively). Our investments in debt securities had a cost basis of $1.2 billion as at December 31, 2025 (December 31, 2024 - $1.1 billion). These investments in equity funds and debt securities are recognized at fair value, classified as Level 1 and Level 2 in the fair value hierarchy, respectively, and are recorded in Other current assets and Long-term investments in the Consolidated Statements of Financial Position. There were unrealized holding gains of $21 million for the year ended December 31, 2025 (2024 - losses of $16 million).
As at December 31, 2025, the maturities for our investments in debt securities were as follows:
|
|
|
|
|
|
|
|
|
|
|
|
|
|
|
|
|
Total |
|
Less than
1 year |
|
5 years |
|
10 years |
|
Thereafter |
|
(millions of Canadian dollars) |
|
|
|
|
|
|
|
|
|
|
Fair value of debt securities |
|
1,234 |
|
|
85 |
|
|
813 |
|
|
268 |
|
|
68 |
|
As at December 31, 2025 and December 31, 2024, our long-term debt, including finance lease liabilities, had a carrying value of $104.4 billion and $101.6 billion, respectively, before debt issuance costs and a fair value of $102.7 billion and $98.9 billion, respectively.
The fair value of financial assets and liabilities other than derivative instruments, certain long-term investments in other entities, restricted long-term investments, investments held by our captive insurance subsidiary and long-term debt described above approximate their carrying value due to the short period to maturity.
24. INCOME TAXES
INCOME TAX RATE RECONCILIATION
|
|
|
|
|
|
|
|
|
|
|
|
|
|
|
|
|
|
|
Year ended December 31, |
2025 |
|
2024 |
|
2023 |
|
(millions of Canadian dollars) |
|
|
|
|
|
|
|
|
|
|
|
|
Earnings before income taxes |
|
9,793 |
|
|
|
|
7,299 |
|
|
|
|
7,879 |
|
|
|
Canadian federal statutory income tax rate1 |
|
15.0 |
% |
|
|
|
15.0 |
% |
|
|
|
15.0 |
% |
|
|
Expected federal taxes at statutory rate |
|
1,469 |
|
|
15.0 |
% |
|
1,095 |
|
|
15.0 |
% |
|
1,182 |
|
|
15.0 |
% |
Increase/(decrease) resulting from: |
|
|
|
|
|
|
|
|
|
|
|
|
Provincial income taxes2 |
|
245 |
|
|
2.5 |
% |
|
(74 |
) |
|
(1.0 |
%) |
|
161 |
|
|
2.0 |
% |
Foreign tax effects: |
|
|
|
|
|
|
|
|
|
|
|
|
United States |
|
|
|
|
|
|
|
|
|
|
|
|
Statutory tax rate difference between US and Canada |
|
353 |
|
|
3.6 |
% |
|
314 |
|
|
4.3 |
% |
|
276 |
|
|
3.5 |
% |
State and local income taxes, net of federal income tax effect |
|
61 |
|
|
0.7 |
% |
|
227 |
|
|
3.1 |
% |
|
226 |
|
|
2.9 |
% |
Tax Credits |
|
|
|
|
|
|
|
|
|
|
|
|
Investment tax credits |
|
(153 |
) |
|
(1.6 |
%) |
|
(11 |
) |
|
(0.1 |
%) |
|
(31 |
) |
|
(0.4 |
%) |
Other tax credits |
|
(34 |
) |
|
(0.3 |
%) |
|
(12 |
) |
|
(0.2 |
%) |
|
(16 |
) |
|
(0.2 |
%) |
Nontaxable or nondeductible items |
|
|
|
|
|
|
|
|
|
|
|
|
Accounting impairment of goodwill3 |
|
— |
|
|
— |
|
|
208 |
|
|
2.9 |
% |
|
(88 |
) |
|
(1.1 |
%) |
Other adjustments |
|
|
|
|
|
|
|
|
|
|
|
|
US minimum tax |
|
195 |
|
|
2.0 |
% |
|
163 |
|
|
2.2 |
% |
|
100 |
|
|
1.3 |
% |
Effects of rate-regulated accounting |
|
(77 |
) |
|
(0.8 |
%) |
|
(110 |
) |
|
(1.5 |
%) |
|
(43 |
) |
|
(0.6 |
%) |
Other |
|
9 |
|
|
0.1 |
% |
|
54 |
|
|
0.7 |
% |
|
45 |
|
|
0.6 |
% |
Other jurisdictions |
|
(74 |
) |
|
(0.8 |
%) |
|
(26 |
) |
|
(0.4 |
%) |
|
(51 |
) |
|
(0.6 |
%) |
Nontaxable or nondeductible items |
|
|
|
|
|
|
|
|
|
|
|
|
Nontaxable portion of gain on sale of investment4 |
|
— |
|
|
— |
|
|
(147 |
) |
|
(2.0 |
%) |
|
— |
|
|
— |
|
Other adjustments |
|
|
|
|
|
|
|
|
|
|
|
|
Write-off of regulatory deferrals5 |
|
32 |
|
|
0.3 |
% |
|
4 |
|
|
0.1 |
% |
|
115 |
|
|
1.5 |
% |
Effects of rate-regulated accounting |
|
(87 |
) |
|
(0.9 |
%) |
|
(90 |
) |
|
(1.2 |
%) |
|
(107 |
) |
|
(1.4 |
%) |
Part VI. Tax, net of federal Part 1 deduction6 |
|
79 |
|
|
0.8 |
% |
|
73 |
|
|
1.0 |
% |
|
66 |
|
|
0.8 |
% |
Other |
|
(14 |
) |
|
(0.1 |
%) |
|
— |
|
|
— |
|
|
(14 |
) |
|
(0.2 |
%) |
Income tax expense and effective tax rate |
|
2,004 |
|
|
20.5 |
% |
|
1,668 |
|
|
22.9 |
% |
|
1,821 |
|
|
23.1 |
% |
1Represents the federal statutory rate of Canada of 15%, net of the federal tax abatement and general rate reduction.
2Provincial taxes in Alberta and Ontario accounted for more than 50% of the total tax effect in 2025. In both 2024 and 2023, provincial taxes in Alberta alone accounted for more than 50% of the total tax effect.
3The amount in 2024 relates to the federal impact of the nondeductible goodwill impairment in the Gas Transmission segment. Refer to Note 13 - Long-Term Investments and Note 15 - Goodwill.
4The amount in 2024 relates to the federal component of the nontaxable portion of the gain on sale relating to Alliance Pipeline and Aux Sable. Refer to Note 13 - Long-Term Investments.
5The amount in 2023 relates to the federal tax impact of the derecognition of rate-regulated accounting for income tax relating to Southern Lights Canada and portions of the Canadian Mainline including Line 9 and Line 3 Replacement.
6Represents the Part VI.1 tax which is levied on preferred share dividends paid in Canada.
COMPONENTS OF PRETAX EARNINGS AND INCOME TAXES
|
|
|
|
|
|
|
|
|
|
Year ended December 31, |
|
2025 |
|
|
2024 |
|
|
2023 |
|
(millions of Canadian dollars) |
|
|
|
|
|
|
Earnings before income taxes |
|
|
|
|
|
|
Canada |
|
3,391 |
|
|
1,035 |
|
|
2,233 |
|
US |
|
5,920 |
|
|
5,231 |
|
|
4,620 |
|
Other |
|
482 |
|
|
1,033 |
|
|
1,026 |
|
|
|
9,793 |
|
|
7,299 |
|
|
7,879 |
|
Income tax expense/(recovery) |
|
|
|
|
|
|
Canada |
|
|
|
|
|
|
Federal |
|
522 |
|
|
23 |
|
|
395 |
|
Provincial |
|
245 |
|
|
(74 |
) |
|
161 |
|
US |
|
1,245 |
|
|
1,591 |
|
|
1,165 |
|
Other |
|
(8 |
) |
|
128 |
|
|
100 |
|
|
|
2,004 |
|
|
1,668 |
|
|
1,821 |
|
Current income taxes |
|
979 |
|
|
949 |
|
|
401 |
|
Deferred income taxes |
|
1,025 |
|
|
719 |
|
|
1,420 |
|
COMPONENTS OF DEFERRED INCOME TAXES
Deferred income tax assets and liabilities are recognized for the future tax consequences of differences between carrying amounts of assets and liabilities and their respective tax bases. Major components of deferred income tax assets and liabilities are as follows:
|
|
|
|
|
|
|
December 31, |
|
2025 |
|
|
2024 |
|
(millions of Canadian dollars) |
|
|
|
|
Deferred income tax liabilities |
|
|
|
|
Property, plant and equipment |
|
(10,656 |
) |
|
(11,368 |
) |
Investments |
|
(9,538 |
) |
|
(9,043 |
) |
Regulatory assets |
|
(2,020 |
) |
|
(1,940 |
) |
Other |
|
(392 |
) |
|
(251 |
) |
Total deferred income tax liabilities |
|
(22,606 |
) |
|
(22,602 |
) |
Deferred income tax assets |
|
|
|
|
Financial instruments |
|
363 |
|
|
740 |
|
Loss carryforwards1 |
|
823 |
|
|
1,272 |
|
Other |
|
2,075 |
|
|
2,088 |
|
Total deferred income tax assets |
|
3,261 |
|
|
4,100 |
|
Less valuation allowance2 |
|
(236 |
) |
|
(298 |
) |
Total deferred income tax assets, net |
|
3,025 |
|
|
3,802 |
|
Net deferred income tax liabilities |
|
(19,581 |
) |
|
(18,800 |
) |
Presented as follows: |
|
|
|
|
Total deferred income tax assets |
|
701 |
|
|
796 |
|
Total deferred income tax liabilities |
|
(20,282 |
) |
|
(19,596 |
) |
Net deferred income tax liabilities |
|
(19,581 |
) |
|
(18,800 |
) |
1As at December 31, 2025 and 2024, represents the tax effect related to the benefit of unused tax loss carryforwards in Canada of $1.5 billion and $1.3 billion, respectively, which expire in 2031 and beyond, and in the US of $2.0 billion and $4.2 billion, respectively, with no expiration.
2A valuation allowance has been established for certain loss and credit carryforwards, and outside basis temporary differences on investments that reduce deferred income tax assets to an amount that will more likely than not be realized.
We have not provided for deferred income taxes on the difference between the carrying value of substantially all of our foreign subsidiaries and their corresponding tax basis as the earnings of those subsidiaries are intended to be permanently reinvested in their operations. As such, these investments are not anticipated to give rise to income taxes in the foreseeable future. The difference between the carrying values of the investments and their tax bases is largely a result of unremitted earnings and currency translation adjustments. The determination of the amount of unrecognized deferred income tax liabilities applicable to such amounts is not practicable.
Enbridge and certain of our subsidiaries are subject to taxation in Canada, the US and other foreign jurisdictions. The material jurisdictions in which we are subject to potential examinations include the US (Federal) and Canada (Federal, Alberta and Québec). We are open to examination by Canadian tax authorities for the 2018 to 2025 tax years and by US tax authorities for the 2022 to 2025 tax years. We are currently under examination for income tax matters in Canada for the 2019 to 2022 tax years. We are not currently under examination for income tax matters in any other material jurisdiction where we are subject to income tax.
INCOME TAXES PAID
|
|
|
|
|
|
|
|
|
|
Year ended December 31, |
|
2025 |
|
|
2024 |
|
|
2023 |
|
(millions of Canadian dollars) |
|
|
|
|
|
|
Canadian Federal |
|
398 |
|
|
132 |
|
|
216 |
|
Canadian Provincial1 |
|
142 |
|
|
61 |
|
|
46 |
|
United States |
|
585 |
|
|
592 |
|
|
221 |
|
Hungary |
|
— |
|
|
(2 |
) |
|
54 |
|
Switzerland |
|
68 |
|
|
76 |
|
|
38 |
|
Other |
|
14 |
|
|
2 |
|
|
3 |
|
Net cash paid for income taxes |
|
1,207 |
|
|
861 |
|
|
578 |
|
1Includes income taxes paid to Ontario of $46 million, $46 million, and $12 million for 2025, 2024, and 2023, respectively.
UNRECOGNIZED TAX BENEFITS
|
|
|
|
|
|
|
Year ended December 31, |
|
2025 |
|
|
2024 |
|
(millions of Canadian dollars) |
|
|
|
|
Unrecognized tax benefits at beginning of year |
|
31 |
|
|
45 |
|
Gross decreases for tax positions of prior year |
|
(30 |
) |
|
(2 |
) |
Change in translation of foreign currency |
|
(1 |
) |
|
4 |
|
Lapses of statute of limitations |
|
— |
|
|
(16 |
) |
Unrecognized tax benefits at end of year |
|
— |
|
|
31 |
|
We recognize accrued interest and penalties related to unrecognized tax benefits as a component of income taxes. Interest and penalties included in income taxes for the years ended December 31, 2025 and 2024 were recoveries of $6 million and $8 million, respectively. As at December 31, 2025 and 2024, interest and penalties of nil and $6 million, respectively, have been accrued.
25. PENSION AND OTHER POSTRETIREMENT BENEFITS
PENSION PLANS
We sponsor Canadian and US contributory and non-contributory registered defined benefit and defined contribution pension plans, which provide benefits covering substantially all employees. The Canadian pension plans provide defined benefit and defined contribution pension benefits to our Canadian employees. The US pension plans provide defined benefit pension benefits to our US employees. We also sponsor supplemental non-contributory defined benefit pension plans, which provide non-registered benefits for certain employees in Canada and the US.
Defined Benefit Pension Plan Benefits
Benefits payable from the defined benefit pension plans are based on each plan participant's years of service and final average remuneration. Some benefits are partially inflation-indexed after a plan participant’s retirement. Our contributions are made in accordance with independent actuarial valuations. Participant contributions to contributory defined benefit pension plans are based upon each plan participant's current eligible remuneration.
Defined Contribution Pension Plan Benefits
Our contributions are based on each plan participant's current eligible remuneration. Our contributions for some defined contribution pension plans are also based on age and years of service. Our defined contribution pension benefit costs are equal to the amount of contributions required to be made by us.
Benefit Obligations, Plan Assets and Funded Status
The following table details the changes in the projected benefit obligation, the fair value of plan assets and the recorded assets or liabilities for our defined benefit pension plans:
|
|
|
|
|
|
|
|
|
|
|
|
|
|
|
Canada |
|
|
US |
|
December 31, |
|
2025 |
|
|
2024 |
|
|
|
2025 |
|
|
2024 |
|
(millions of Canadian dollars) |
|
|
|
|
|
|
|
|
|
Change in projected benefit obligation |
|
|
|
|
|
|
|
|
|
Projected benefit obligation at beginning of year |
|
4,203 |
|
|
4,092 |
|
|
|
1,648 |
|
|
1,036 |
|
Service cost |
|
97 |
|
|
103 |
|
|
|
67 |
|
|
60 |
|
Interest cost |
|
181 |
|
|
186 |
|
|
|
80 |
|
|
69 |
|
Participant contributions |
|
33 |
|
|
32 |
|
|
|
— |
|
|
— |
|
Actuarial (gain)/loss1 |
|
(109 |
) |
|
— |
|
|
|
37 |
|
|
(98 |
) |
Benefits paid |
|
(205 |
) |
|
(210 |
) |
|
|
(105 |
) |
|
(100 |
) |
Transfer in |
|
— |
|
|
— |
|
|
|
6 |
|
|
569 |
|
Foreign currency exchange rate changes |
|
— |
|
|
— |
|
|
|
(79 |
) |
|
119 |
|
Other |
|
— |
|
|
— |
|
|
|
(8 |
) |
|
(7 |
) |
Projected benefit obligation at end of year2 |
|
4,200 |
|
|
4,203 |
|
|
|
1,646 |
|
|
1,648 |
|
Change in plan assets |
|
|
|
|
|
|
|
|
|
Fair value of plan assets at beginning of year |
|
5,000 |
|
|
4,528 |
|
|
|
2,194 |
|
|
1,052 |
|
Actual return on plan assets |
|
410 |
|
|
627 |
|
|
|
225 |
|
|
197 |
|
Employer contributions |
|
12 |
|
|
23 |
|
|
|
5 |
|
|
5 |
|
Participant contributions |
|
33 |
|
|
32 |
|
|
|
— |
|
|
— |
|
Benefits paid |
|
(205 |
) |
|
(210 |
) |
|
|
(105 |
) |
|
(100 |
) |
Transfer in |
|
— |
|
|
— |
|
|
|
6 |
|
|
900 |
|
Foreign currency exchange rate changes |
|
— |
|
|
— |
|
|
|
(106 |
) |
|
146 |
|
Other |
|
— |
|
|
— |
|
|
|
(7 |
) |
|
(6 |
) |
Fair value of plan assets at end of year3 |
|
5,250 |
|
|
5,000 |
|
|
|
2,212 |
|
|
2,194 |
|
Overfunded status at end of year |
|
1,050 |
|
|
797 |
|
|
|
566 |
|
|
546 |
|
Presented as follows: |
|
|
|
|
|
|
|
|
|
Deferred amounts and other assets |
|
1,176 |
|
|
943 |
|
|
|
676 |
|
|
653 |
|
Other current liabilities |
|
(10 |
) |
|
(10 |
) |
|
|
(5 |
) |
|
(6 |
) |
Other long-term liabilities |
|
(116 |
) |
|
(136 |
) |
|
|
(105 |
) |
|
(101 |
) |
|
|
1,050 |
|
|
797 |
|
|
|
566 |
|
|
546 |
|
1Primarily due to the increase in the discount rate and changes in benefit assumptions and member data used to measure the defined benefit obligation.
2The accumulated benefit obligation for our Canadian pension plans was $3.9 billion as at December 31, 2025 and 2024. The accumulated benefit obligation for our US pension plans was $1.6 billion as at December 31, 2025 and 2024.
3Assets in the amount of $21 million (2024 - $18 million) and $91 million (2024- $80 million), related to our Canadian and US non-registered supplemental pension plan obligations, respectively, are held in grantor trusts and rabbi trusts that, in accordance with federal tax regulations, are not restricted from creditors. These assets are committed for the future settlement of benefit obligations included in the underfunded status as at the end of the year, however they are excluded from plan assets for accounting purposes.
Certain of our pension plans have accumulated benefit obligations in excess of the fair value of plan assets. For these plans, the accumulated benefit obligation and fair value of plan assets were as follows:
|
|
|
|
|
|
|
|
|
|
|
|
|
|
|
Canada |
|
|
US |
|
December 31, |
|
2025 |
|
|
2024 |
|
|
|
2025 |
|
|
2024 |
|
(millions of Canadian dollars) |
|
|
|
|
|
|
|
|
|
Accumulated benefit obligation |
|
116 |
|
|
404 |
|
|
|
109 |
|
|
107 |
|
Fair value of plan assets |
|
— |
|
|
283 |
|
|
|
— |
|
|
— |
|
Certain of our pension plans have projected benefit obligations in excess of the fair value of plan assets. For these plans, the projected benefit obligation and fair value of plan assets were as follows:
|
|
|
|
|
|
|
|
|
|
|
|
|
|
|
Canada |
|
|
US |
|
December 31, |
|
2025 |
|
|
2024 |
|
|
|
2025 |
|
|
2024 |
|
(millions of Canadian dollars) |
|
|
|
|
|
|
|
|
|
Projected benefit obligation |
|
431 |
|
|
428 |
|
|
|
111 |
|
|
107 |
|
Fair value of plan assets |
|
306 |
|
|
283 |
|
|
|
— |
|
|
— |
|
Amount Recognized in Accumulated Other Comprehensive Income
The amount of pre-tax AOCI relating to our pension plans are as follows:
|
|
|
|
|
|
|
|
|
|
|
|
|
|
|
Canada |
|
|
US |
|
December 31, |
|
2025 |
|
|
2024 |
|
|
|
2025 |
|
|
2024 |
|
(millions of Canadian dollars) |
|
|
|
|
|
|
|
|
|
Net actuarial gain |
|
(241 |
) |
|
(122 |
) |
|
|
(114 |
) |
|
(42 |
) |
Prior service cost |
|
— |
|
|
— |
|
|
|
6 |
|
|
5 |
|
Total amount recognized in AOCI1 |
|
(241 |
) |
|
(122 |
) |
|
|
(108 |
) |
|
(37 |
) |
1Excludes amounts related to CTA.
Net Periodic Benefit (Credit)/Cost and Other Amounts Recognized in Comprehensive Income
The components of net periodic benefit (credit)/cost and other amounts recognized in pre-tax Comprehensive income related to our pension plans are as follows:
|
|
|
|
|
|
|
|
|
|
|
|
|
|
|
|
|
|
|
|
|
Canada |
|
|
US |
|
Year ended December 31, |
|
2025 |
|
|
2024 |
|
|
2023 |
|
|
|
2025 |
|
|
2024 |
|
|
2023 |
|
(millions of Canadian dollars) |
|
|
|
|
|
|
|
|
|
|
|
|
|
Service cost1 |
|
97 |
|
|
103 |
|
|
81 |
|
|
|
67 |
|
|
60 |
|
|
40 |
|
Interest cost2 |
|
181 |
|
|
186 |
|
|
184 |
|
|
|
80 |
|
|
69 |
|
|
47 |
|
Expected return on plan assets2 |
|
(345 |
) |
|
(304 |
) |
|
(271 |
) |
|
|
(169 |
) |
|
(131 |
) |
|
(77 |
) |
Amortization/settlement of net actuarial (gain)/loss2 |
|
— |
|
|
4 |
|
|
— |
|
|
|
(7 |
) |
|
7 |
|
|
(4 |
) |
Amortization/curtailment of prior service credit2 |
|
— |
|
|
— |
|
|
— |
|
|
|
(1 |
) |
|
(4 |
) |
|
— |
|
Net periodic benefit (credit)/cost |
|
(67 |
) |
|
(11 |
) |
|
(6 |
) |
|
|
(30 |
) |
|
1 |
|
|
6 |
|
Defined contribution benefit cost |
|
12 |
|
|
12 |
|
|
12 |
|
|
|
— |
|
|
— |
|
|
— |
|
Net pension (credit)/cost recognized in Earnings |
|
(55 |
) |
|
1 |
|
|
6 |
|
|
|
(30 |
) |
|
1 |
|
|
6 |
|
Amount recognized in OCI: |
|
|
|
|
|
|
|
|
|
|
|
|
|
Reclassification of actuarial gain from regulatory assets |
|
— |
|
|
— |
|
|
— |
|
|
|
(59 |
) |
|
— |
|
|
— |
|
Amortization/settlement of net actuarial gain |
|
— |
|
|
— |
|
|
— |
|
|
|
7 |
|
|
— |
|
|
4 |
|
Amortization/curtailment of prior service credit |
|
— |
|
|
— |
|
|
— |
|
|
|
1 |
|
|
4 |
|
|
— |
|
Net actuarial (gain)/loss arising during the year |
|
(119 |
) |
|
(173 |
) |
|
115 |
|
|
|
(20 |
) |
|
(116 |
) |
|
30 |
|
Total amount recognized in OCI |
|
(119 |
) |
|
(173 |
) |
|
115 |
|
|
|
(71 |
) |
|
(112 |
) |
|
34 |
|
Total amount recognized in Comprehensive income |
|
(174 |
) |
|
(172 |
) |
|
121 |
|
|
|
(101 |
) |
|
(111 |
) |
|
40 |
|
1Reported within Operating and administrative in the Consolidated Statements of Earnings.
2Reported within Other income/(expense) in the Consolidated Statements of Earnings.
Actuarial Assumptions
The weighted average assumptions made in the measurement of the projected benefit obligation and net periodic benefit cost of our pension plans are as follows:
|
|
|
|
|
|
|
|
|
Canada |
|
US |
|
2025 |
2024 |
2023 |
|
2025 |
2024 |
2023 |
Projected benefit obligation |
|
|
|
|
|
|
|
Discount rate |
5.0% |
4.7% |
4.6% |
|
5.4% |
5.5% |
4.7% |
Rate of salary increase |
3.0% |
3.0% |
3.0% |
|
2.5% |
2.6% |
2.6% |
Cash balance interest credit rate |
N/A |
N/A |
N/A |
|
4.7% |
4.0% |
4.5% |
Net periodic benefit cost |
|
|
|
|
|
|
|
Discount rate |
4.7% |
4.6% |
5.3% |
|
5.5% |
4.8% |
4.9% |
Rate of return on plan assets |
7.0% |
6.8% |
6.5% |
|
8.2% |
7.3% |
7.4% |
Rate of salary increase |
3.0% |
3.0% |
2.9% |
|
2.6% |
2.8% |
2.8% |
Cash balance interest credit rate |
N/A |
N/A |
N/A |
|
4.0% |
4.4% |
4.3% |
OTHER POSTRETIREMENT BENEFIT PLANS
We sponsor funded and unfunded defined benefit OPEB Plans, which provide non-contributory supplemental health, dental, life and health spending account benefit coverage for certain qualifying retired employees.
Benefit Obligations, Plan Assets and Funded Status
The following table details the changes in the accumulated postretirement benefit obligation, the fair value of plan assets and the recorded assets or liabilities for our defined benefit OPEB plans:
|
|
|
|
|
|
|
|
|
|
|
|
|
|
|
Canada |
|
|
US |
|
December 31, |
|
2025 |
|
|
2024 |
|
|
|
2025 |
|
|
2024 |
|
(millions of Canadian dollars) |
|
|
|
|
|
|
|
|
|
Change in accumulated postretirement benefit
obligation |
|
|
|
|
|
|
|
|
|
Accumulated postretirement benefit obligation at
beginning of year |
|
210 |
|
|
228 |
|
|
|
177 |
|
|
129 |
|
Service cost |
|
2 |
|
|
3 |
|
|
|
3 |
|
|
3 |
|
Interest cost |
|
8 |
|
|
10 |
|
|
|
8 |
|
|
7 |
|
Participant contributions |
|
— |
|
|
— |
|
|
|
5 |
|
|
5 |
|
Actuarial gain1 |
|
(5 |
) |
|
(21 |
) |
|
|
(3 |
) |
|
(9 |
) |
Benefits paid |
|
(10 |
) |
|
(10 |
) |
|
|
(19 |
) |
|
(20 |
) |
Transfer in |
|
— |
|
|
— |
|
|
|
— |
|
|
46 |
|
Plan amendments |
|
(12 |
) |
|
— |
|
|
|
(5 |
) |
|
— |
|
Foreign currency exchange rate changes |
|
— |
|
|
— |
|
|
|
(7 |
) |
|
16 |
|
Accumulated postretirement benefit obligation at end
of year |
|
193 |
|
|
210 |
|
|
|
159 |
|
|
177 |
|
Change in plan assets |
|
|
|
|
|
|
|
|
|
Fair value of plan assets at beginning of year |
|
— |
|
|
— |
|
|
|
278 |
|
|
187 |
|
Actual return on plan assets |
|
— |
|
|
— |
|
|
|
32 |
|
|
22 |
|
Employer contributions |
|
10 |
|
|
10 |
|
|
|
7 |
|
|
7 |
|
Participant contributions |
|
— |
|
|
— |
|
|
|
5 |
|
|
5 |
|
Benefits paid |
|
(10 |
) |
|
(10 |
) |
|
|
(19 |
) |
|
(20 |
) |
Transfer in |
|
— |
|
|
— |
|
|
|
— |
|
|
55 |
|
Foreign currency exchange rate changes |
|
— |
|
|
— |
|
|
|
(14 |
) |
|
20 |
|
Other |
|
— |
|
|
— |
|
|
|
— |
|
|
2 |
|
Fair value of plan assets at end of year |
|
— |
|
|
— |
|
|
|
289 |
|
|
278 |
|
Overfunded/(underfunded) status at end of year |
|
(193 |
) |
|
(210 |
) |
|
|
130 |
|
|
101 |
|
Presented as follows: |
|
|
|
|
|
|
|
|
|
Deferred amounts and other assets |
|
— |
|
|
— |
|
|
|
138 |
|
|
113 |
|
Other current liabilities |
|
(12 |
) |
|
(11 |
) |
|
|
— |
|
|
— |
|
Other long-term liabilities |
|
(181 |
) |
|
(199 |
) |
|
|
(8 |
) |
|
(12 |
) |
|
|
(193 |
) |
|
(210 |
) |
|
|
130 |
|
|
101 |
|
1Primarily due to the increase in the discount rate and changes in benefit assumptions and member data used to measure the defined benefit obligation.
Certain of our OPEB plans have accumulated benefit obligations in excess of the fair value of plan assets. For these plans, the accumulated benefit obligation and fair value of plan assets were as follows:
|
|
|
|
|
|
|
|
|
|
|
|
|
|
|
Canada |
|
|
US |
|
December 31, |
|
2025 |
|
|
2024 |
|
|
|
2025 |
|
|
2024 |
|
(millions of Canadian dollars) |
|
|
|
|
|
|
|
|
|
Accumulated benefit obligation |
|
193 |
|
|
210 |
|
|
|
26 |
|
|
100 |
|
Fair value of plan assets |
|
— |
|
|
— |
|
|
|
19 |
|
|
88 |
|
Amount Recognized in Accumulated Other Comprehensive Income
The amount of pre-tax AOCI relating to our OPEB plans are as follows:
|
|
|
|
|
|
|
|
|
|
|
|
|
|
|
Canada |
|
|
US |
|
December 31, |
|
2025 |
|
|
2024 |
|
|
|
2025 |
|
|
2024 |
|
(millions of Canadian dollars) |
|
|
|
|
|
|
|
|
|
Net actuarial gain |
|
(98 |
) |
|
(99 |
) |
|
|
(109 |
) |
|
(103 |
) |
Prior service credit |
|
(10 |
) |
|
— |
|
|
|
(9 |
) |
|
(16 |
) |
Total amount recognized in AOCI1 |
|
(108 |
) |
|
(99 |
) |
|
|
(118 |
) |
|
(119 |
) |
1Excludes amounts related to CTA.
Net Periodic Benefit (Credit)/Cost and Other Amounts Recognized in Comprehensive Income
The components of net periodic benefit (credit)/cost and other amounts recognized in pre-tax Comprehensive income related to our OPEB plans are as follows:
|
|
|
|
|
|
|
|
|
|
|
|
|
|
|
|
|
|
|
|
|
Canada |
|
|
US |
|
Year ended December 31, |
|
2025 |
|
|
2024 |
|
|
2023 |
|
|
|
2025 |
|
|
2024 |
|
|
2023 |
|
(millions of Canadian dollars) |
|
|
|
|
|
|
|
|
|
|
|
|
|
Service cost1 |
|
2 |
|
|
3 |
|
|
3 |
|
|
|
3 |
|
|
3 |
|
|
1 |
|
Interest cost2 |
|
8 |
|
|
10 |
|
|
11 |
|
|
|
8 |
|
|
7 |
|
|
6 |
|
Expected return on plan assets2 |
|
— |
|
|
— |
|
|
— |
|
|
|
(17 |
) |
|
(15 |
) |
|
(11 |
) |
Amortization/settlement of net actuarial gain2 |
|
(7 |
) |
|
(5 |
) |
|
(6 |
) |
|
|
(10 |
) |
|
(5 |
) |
|
(6 |
) |
Amortization/curtailment of prior service credit2 |
|
(2 |
) |
|
(1 |
) |
|
— |
|
|
|
(12 |
) |
|
(6 |
) |
|
(8 |
) |
Net periodic benefit (credit)/cost recognized in Earnings |
|
1 |
|
|
7 |
|
|
8 |
|
|
|
(28 |
) |
|
(16 |
) |
|
(18 |
) |
Amount recognized in OCI: |
|
|
|
|
|
|
|
|
|
|
|
|
|
Reclassification of actuarial gain from regulatory assets |
|
— |
|
|
— |
|
|
— |
|
|
|
(2 |
) |
|
— |
|
|
— |
|
Amortization/settlement of net actuarial gain |
|
7 |
|
|
5 |
|
|
6 |
|
|
|
10 |
|
|
5 |
|
|
6 |
|
Amortization/curtailment of prior service credit |
|
2 |
|
|
1 |
|
|
— |
|
|
|
12 |
|
|
6 |
|
|
8 |
|
Net actuarial (gain)/loss arising during the year |
|
(6 |
) |
|
(22 |
) |
|
13 |
|
|
|
(14 |
) |
|
(12 |
) |
|
— |
|
Prior service credit |
|
(12 |
) |
|
— |
|
|
— |
|
|
|
(5 |
) |
|
— |
|
|
— |
|
Total amount recognized in OCI |
|
(9 |
) |
|
(16 |
) |
|
19 |
|
|
|
1 |
|
|
(1 |
) |
|
14 |
|
Total amount recognized in Comprehensive income |
|
(8 |
) |
|
(9 |
) |
|
27 |
|
|
|
(27 |
) |
|
(17 |
) |
|
(4 |
) |
1Reported within Operating and administrative in the Consolidated Statements of Earnings.
2Reported within Other income/(expense) in the Consolidated Statements of Earnings.
The weighted average assumptions made in the measurement of the accumulated postretirement benefit obligation and net periodic benefit cost of our OPEB plans are as follows:
|
|
|
|
|
|
|
|
|
Canada |
|
US |
|
2025 |
2024 |
2023 |
|
2025 |
2024 |
2023 |
Accumulated postretirement benefit
obligation |
|
|
|
|
|
|
|
Discount rate |
4.9% |
4.7% |
4.6% |
|
5.1% |
5.3% |
4.7% |
Net periodic benefit cost |
|
|
|
|
|
|
|
Discount rate |
4.7% |
4.6% |
5.3% |
|
5.3% |
5.5% |
4.9% |
Rate of return on plan assets |
N/A |
N/A |
N/A |
|
6.6% |
6.7% |
5.9% |
Assumed Health Care Cost Trend Rates
The assumed rates for the next year used to measure the expected cost of benefits are as follows:
|
|
|
|
|
|
|
Canada |
|
US1 |
|
2025 |
2024 |
|
2025 |
2024 |
Health care cost trend rate assumed for next year |
4.0% |
4.0% |
|
4.9% |
3.2% |
Rate to which the cost trend is assumed to decline
(ultimate trend rate) |
4.0% |
4.0% |
|
4.4% |
3.7% |
Year that the rate reaches the ultimate trend rate |
N/A |
N/A |
|
2024-2048 |
2023 - 2046 |
1In addition, under the Enbridge Employee Services, Inc., Health Reimbursement Account Plan, health care costs will increase by 5.0% every three years.
PLAN ASSETS
We manage the investment risk of our pension funds by setting a long-term asset mix policy for each plan after consideration of: (i) the nature of pension plan liabilities; (ii) the investment horizon of the plan; (iii) the going concern and solvency funded status and cash flow requirements of the plan; (iv) our operating environment and financial situation and our ability to withstand fluctuations in pension contributions; and (v) the future economic and capital markets outlook with respect to investment returns, volatility of returns and correlation between assets.
The overall expected rate of return on plan assets is based on the asset allocation targets with estimates for returns based on long-term expectations.
The asset allocation targets and major categories of plan assets are as follows:
|
|
|
|
|
|
|
|
|
|
|
|
|
|
|
|
|
Canada |
|
|
US |
|
|
Target |
December 31, |
|
|
Target |
December 31, |
|
Asset Category |
Allocation |
|
2025 |
|
|
2024 |
|
|
Allocation |
|
2025 |
|
|
2024 |
|
Equity securities |
46.3% |
42.4% |
|
39.1% |
|
|
43.3% |
46.0% |
|
44.8% |
|
Fixed income securities |
22.9% |
29.6% |
|
31.6% |
|
|
23.3% |
31.0% |
|
33.0% |
|
Alternatives1 |
30.8% |
28.0% |
|
29.3% |
|
|
33.4% |
23.0% |
|
22.2% |
|
1Alternatives include investments in private debt, private equity, infrastructure and real estate funds. Fund values are based on the net asset value of the funds that invest directly in the aforementioned underlying investments. The values of the investments have been estimated using the capital accounts representing the plan's ownership interest in the funds.
Pension Plans
The following table summarizes the fair value of plan assets for our pension plans recorded at each fair value hierarchy level:
|
|
|
|
|
|
|
|
|
|
|
|
|
|
|
|
|
|
|
|
|
|
|
|
|
|
|
Canada |
|
|
US |
|
|
Level 11 |
|
Level 22 |
|
Level 33 |
|
Total |
|
|
Level 11 |
|
Level 22 |
|
Level 33 |
|
Total |
|
(millions of Canadian dollars) |
|
|
|
|
|
|
|
|
|
|
|
|
|
|
|
|
|
December 31, 2025 |
|
|
|
|
|
|
|
|
|
|
|
|
|
|
|
|
|
Cash and cash equivalents |
|
203 |
|
|
— |
|
|
— |
|
|
203 |
|
|
|
35 |
|
|
— |
|
|
— |
|
|
35 |
|
Equity securities4 |
|
|
|
|
|
|
|
|
|
|
|
|
|
|
|
|
|
Canada |
|
— |
|
|
59 |
|
|
— |
|
|
59 |
|
|
|
— |
|
|
— |
|
|
— |
|
|
— |
|
Global |
|
167 |
|
|
2,002 |
|
|
— |
|
|
2,169 |
|
|
|
27 |
|
|
990 |
|
|
— |
|
|
1,017 |
|
Fixed income securities4 |
|
|
|
|
|
|
|
|
|
|
|
|
|
|
|
|
|
Government |
|
— |
|
|
606 |
|
|
— |
|
|
606 |
|
|
|
— |
|
|
219 |
|
|
— |
|
|
219 |
|
Corporate |
|
— |
|
|
744 |
|
|
— |
|
|
744 |
|
|
|
— |
|
|
431 |
|
|
— |
|
|
431 |
|
Alternatives5 |
|
— |
|
|
— |
|
|
1,469 |
|
|
1,469 |
|
|
|
— |
|
|
— |
|
|
510 |
|
|
510 |
|
Total pension plan assets
at fair value |
|
370 |
|
|
3,411 |
|
|
1,469 |
|
|
5,250 |
|
|
|
62 |
|
|
1,640 |
|
|
510 |
|
|
2,212 |
|
December 31, 2024 |
|
|
|
|
|
|
|
|
|
|
|
|
|
|
|
|
|
Cash and cash equivalents |
|
201 |
|
|
— |
|
|
— |
|
|
201 |
|
|
|
57 |
|
|
— |
|
|
— |
|
|
57 |
|
Equity securities4 |
|
|
|
|
|
|
|
|
|
|
|
|
|
|
|
|
|
Canada |
|
— |
|
|
3 |
|
|
— |
|
|
3 |
|
|
|
— |
|
|
— |
|
|
— |
|
|
— |
|
Global |
|
134 |
|
|
1,817 |
|
|
— |
|
|
1,951 |
|
|
|
27 |
|
|
954 |
|
|
— |
|
|
981 |
|
Fixed income securities4 |
|
|
|
|
|
|
|
|
|
|
|
|
|
|
|
|
|
Government |
|
— |
|
|
543 |
|
|
— |
|
|
543 |
|
|
|
— |
|
|
194 |
|
|
— |
|
|
194 |
|
Corporate |
|
— |
|
|
838 |
|
|
— |
|
|
838 |
|
|
|
— |
|
|
474 |
|
|
— |
|
|
474 |
|
Alternatives5 |
|
— |
|
|
— |
|
|
1,464 |
|
|
1,464 |
|
|
|
— |
|
|
— |
|
|
488 |
|
|
488 |
|
Total pension plan assets
at fair value |
|
335 |
|
|
3,201 |
|
|
1,464 |
|
|
5,000 |
|
|
|
84 |
|
|
1,622 |
|
|
488 |
|
|
2,194 |
|
1Level 1 assets include assets with quoted prices in active markets for identical assets.
2Level 2 assets include assets with significant observable inputs.
3Level 3 assets include assets with significant unobservable inputs.
4Pension plan assets include $67 million (2024 - $77 million) of indirectly held related party equity and fixed income securities investments.
5Alternatives include investments in private debt, private equity, infrastructure and real estate funds.
Changes in the net fair value of pension plan assets classified as Level 3 in the fair value hierarchy were as follows:
|
|
|
|
|
|
|
|
|
|
|
|
|
|
|
Canada |
|
|
US |
|
December 31, |
|
2025 |
|
|
2024 |
|
|
|
2025 |
|
|
2024 |
|
(millions of Canadian dollars) |
|
|
|
|
|
|
|
|
|
Balance at beginning of year |
|
1,464 |
|
|
1,290 |
|
|
|
488 |
|
|
433 |
|
Unrealized and realized gains/(losses) |
|
(9 |
) |
|
104 |
|
|
|
7 |
|
|
63 |
|
Purchases and settlements, net |
|
14 |
|
|
70 |
|
|
|
15 |
|
|
(8 |
) |
Balance at end of year |
|
1,469 |
|
|
1,464 |
|
|
|
510 |
|
|
488 |
|
OPEB Plans
The following table summarizes the fair value of plan assets for our US funded OPEB plans recorded at each fair value hierarchy level:
|
|
|
|
|
|
|
|
|
|
|
|
|
|
Level 11 |
|
Level 22 |
|
Level 33 |
|
Total |
|
(millions of Canadian dollars) |
|
|
|
|
|
|
|
|
December 31, 2025 |
|
|
|
|
|
|
|
|
Cash and cash equivalents |
|
11 |
|
|
— |
|
|
— |
|
|
11 |
|
Equity securities |
|
|
|
|
|
|
|
|
US |
|
— |
|
|
56 |
|
|
— |
|
|
56 |
|
Global |
|
— |
|
|
102 |
|
|
— |
|
|
102 |
|
Fixed income securities |
|
|
|
|
|
|
|
|
Government |
|
65 |
|
|
7 |
|
|
— |
|
|
72 |
|
Corporate |
|
— |
|
|
16 |
|
|
— |
|
|
16 |
|
Alternatives4 |
|
— |
|
|
— |
|
|
32 |
|
|
32 |
|
Total OPEB plan assets at fair value |
|
76 |
|
|
181 |
|
|
32 |
|
|
289 |
|
December 31, 2024 |
|
|
|
|
|
|
|
|
Cash and cash equivalents |
|
4 |
|
|
— |
|
|
— |
|
|
4 |
|
Equity securities |
|
|
|
|
|
|
|
|
US |
|
— |
|
|
52 |
|
|
— |
|
|
52 |
|
Global |
|
— |
|
|
93 |
|
|
— |
|
|
93 |
|
Fixed income securities |
|
|
|
|
|
|
|
|
Government |
|
71 |
|
|
6 |
|
|
— |
|
|
77 |
|
Corporate |
|
— |
|
|
19 |
|
|
— |
|
|
19 |
|
Alternatives4 |
|
— |
|
|
— |
|
|
33 |
|
|
33 |
|
Total OPEB plan assets at fair value |
|
75 |
|
|
170 |
|
|
33 |
|
|
278 |
|
1Level 1 assets include assets with quoted prices in active markets for identical assets.
2Level 2 assets include assets with significant observable inputs.
3Level 3 assets include assets with significant unobservable inputs.
4Alternatives include investments in private debt, private equity, infrastructure and real estate funds.
Changes in the net fair value of US funded OPEB plan assets classified as Level 3 in the fair value hierarchy were as follows:
|
|
|
|
|
|
|
December 31, |
|
2025 |
|
|
2024 |
|
(millions of Canadian dollars) |
|
|
|
|
Balance at beginning of year |
|
33 |
|
|
29 |
|
Unrealized and realized gains/(losses) |
|
(1 |
) |
|
5 |
|
Purchases and settlements, net |
|
— |
|
|
(1 |
) |
Balance at end of year |
|
32 |
|
|
33 |
|
EXPECTED BENEFIT PAYMENTS
|
|
|
|
|
|
|
|
|
|
|
|
|
|
|
|
|
|
|
Year ending December 31, |
|
2026 |
|
|
2027 |
|
|
2028 |
|
|
2029 |
|
|
2030 |
|
2031-2035 |
|
(millions of Canadian dollars) |
|
Pension |
|
|
|
|
|
|
|
|
|
|
|
|
Canada |
|
223 |
|
|
228 |
|
|
234 |
|
|
240 |
|
|
246 |
|
|
1,316 |
|
US |
|
118 |
|
|
120 |
|
|
120 |
|
|
121 |
|
|
120 |
|
|
619 |
|
OPEB |
|
|
|
|
|
|
|
|
|
|
|
|
Canada |
|
12 |
|
|
12 |
|
|
12 |
|
|
12 |
|
|
12 |
|
|
64 |
|
US |
|
14 |
|
|
14 |
|
|
14 |
|
|
14 |
|
|
14 |
|
|
64 |
|
EXPECTED EMPLOYER CONTRIBUTIONS
In 2026, we expect to contribute approximately $15 million and $6 million to the Canadian and US pension plans, respectively, and $12 million and $6 million to the Canadian and US OPEB plans, respectively.
RETIREMENT SAVINGS PLANS
In addition to the pension and OPEB plans discussed above, we also have defined contribution employee savings plans available to US employees. Employees may receive a matching contribution where we match a certain percentage of before-tax employee contributions ranging up to 6.0% of eligible pay per pay period. For the year ended December 31, 2025, pre-tax employer matching contribution costs were $39 million ($35 million in 2024 and $33 million in 2023).
26. LEASES
LESSEE
We incur lease expenses related primarily to real estate, pipelines, storage and equipment. Our leases have remaining lease terms of one month to 40 years as at December 31, 2025.
Our lease expenses are as follows:
|
|
|
|
|
|
|
|
|
|
Year ended December 31, |
|
2025 |
|
|
2024 |
|
|
2023 |
|
(millions of Canadian dollars) |
|
|
|
|
|
|
Operating lease costs1 |
|
101 |
|
|
132 |
|
|
131 |
|
Finance lease costs: |
|
|
|
|
|
|
Amortization of ROU assets2 |
|
56 |
|
|
20 |
|
|
21 |
|
Interest on lease liabilities2 |
|
29 |
|
|
18 |
|
|
14 |
|
1Reported within Operating and administrative expense in the Consolidated Statements of Earnings.
2Amortization of ROU assets and interest on lease liabilities are reported within Depreciation and amortization and Interest expense, respectively, in the Consolidated Statements of Earnings.
Other supplementary lease information is as follows:
|
|
|
|
|
|
|
|
|
|
Year ended December 31, |
|
2025 |
|
|
2024 |
|
|
2023 |
|
(millions of Canadian dollars) |
|
|
|
|
|
|
Cash paid for amounts included in the measurement of lease liabilities |
|
|
|
|
|
|
Cash used in operating activities - operating leases |
|
102 |
|
|
128 |
|
|
129 |
|
Cash used in operating activities - finance leases |
|
25 |
|
|
13 |
|
|
2 |
|
Cash used in financing activities |
|
54 |
|
|
13 |
|
|
17 |
|
|
|
|
|
|
|
|
ROU assets obtained in exchange for lease liabilities |
|
|
|
|
|
|
Operating leases |
|
164 |
|
|
258 |
|
|
67 |
|
Finance leases |
|
148 |
|
|
2 |
|
|
250 |
|
Supplemental Statements of Financial Position Information
|
|
|
|
|
December 31, |
2025 |
|
2024 |
(millions of Canadian dollars, except lease term and discount rate) |
|
|
|
Operating leases1 |
|
|
|
Operating lease right-of-use assets, net2 |
|
597 |
|
785 |
|
|
|
|
Operating lease liabilities - current3 |
|
79 |
|
121 |
Operating lease liabilities - long-term3 |
|
587 |
|
738 |
Total operating lease liabilities |
|
666 |
|
859 |
|
|
|
|
Finance leases |
|
|
|
Finance lease right-of-use assets, net4 |
|
554 |
|
294 |
|
|
|
|
Finance lease liabilities - current5 |
|
46 |
|
16 |
Finance lease liabilities - long-term5 |
|
531 |
|
300 |
Total finance lease liabilities |
|
577 |
|
316 |
|
|
|
|
Weighted average remaining lease term |
|
|
|
Operating leases |
14 years |
|
14 years |
Finance leases |
28 years |
|
31 years |
|
|
|
|
Weighted average discount rate |
|
|
|
Operating leases |
4.8% |
|
4.8% |
Finance leases |
5.7% |
|
5.8% |
1Affiliate ROU assets, current lease liabilities and long-term lease liabilities as at December 31, 2025 were $35 million (December 31, 2024 - $42 million), $6 million (December 31, 2024 - $6 million) and $30 million (December 31, 2024 - $37 million), respectively.
2Operating lease ROU assets are reported under Deferred amounts and other assets in the Consolidated Statements of Financial
Position.
3Current operating lease liabilities and long-term operating lease liabilities are reported under Other current liabilities and Other
long-term liabilities, respectively, in the Consolidated Statements of Financial Position.
4Finance lease ROU assets are reported under Property, plant and equipment, net in the Consolidated Statements of Financial
Position.
5Current finance lease liabilities and long-term finance lease liabilities are reported under Current portion of long-term debt and
Long-term debt in the Consolidated Statements of Financial Position.
As at December 31, 2025, our operating and finance lease liabilities are expected to mature as follows:
|
|
|
|
|
|
|
|
Operating
leases |
|
Finance
leases |
|
(millions of Canadian dollars) |
|
|
|
|
2026 |
|
103 |
|
|
75 |
|
2027 |
|
96 |
|
|
62 |
|
2028 |
|
84 |
|
|
54 |
|
2029 |
|
67 |
|
|
44 |
|
2030 |
|
58 |
|
|
36 |
|
Thereafter |
|
535 |
|
|
991 |
|
Total undiscounted lease payments |
|
943 |
|
|
1,262 |
|
Less imputed interest |
|
(277 |
) |
|
(685 |
) |
Total |
|
666 |
|
|
577 |
|
LESSOR
We receive revenues from operating leases primarily related to natural gas and crude oil storage and processing facilities, and wind power generation assets. Our operating lease agreements have remaining lease terms of eight months to 26 years as at December 31, 2025.
|
|
|
|
|
|
|
|
|
|
Year ended December 31, |
|
2025 |
|
|
2024 |
|
|
2023 |
|
(millions of Canadian dollars) |
|
|
|
|
|
|
Operating lease income |
|
235 |
|
|
229 |
|
|
241 |
|
Variable lease income |
|
336 |
|
|
321 |
|
|
299 |
|
Total lease income1 |
|
571 |
|
|
550 |
|
|
540 |
|
1.Lease income is recorded within Transportation and other services revenues in the Consolidated Statements of Earnings.
As at December 31, 2025, our future lease payments to be received under operating lease and sales-type lease contracts where we are the lessor are as follows:
|
|
|
|
|
|
|
|
Operating
leases |
|
Sales-type
leases |
|
(millions of Canadian dollars) |
|
|
|
|
2026 |
|
211 |
|
|
117 |
|
2027 |
|
194 |
|
|
4 |
|
2028 |
|
190 |
|
|
5 |
|
2029 |
|
190 |
|
|
5 |
|
2030 |
|
175 |
|
|
5 |
|
Thereafter |
|
1,221 |
|
|
187 |
|
Future lease payments |
|
2,181 |
|
|
323 |
|
27. OTHER INCOME/(EXPENSE)
|
|
|
|
|
|
|
|
|
|
Year ended December 31, |
2025 |
|
2024 |
|
2023 |
|
(millions of Canadian dollars) |
|
|
|
|
|
|
Realized foreign currency gain/(loss) |
|
(428 |
) |
|
121 |
|
|
(129 |
) |
Unrealized foreign currency gain/(loss) |
|
1,136 |
|
|
(2,199 |
) |
|
821 |
|
Net defined pension and OPEB credit |
|
293 |
|
|
188 |
|
|
135 |
|
Other |
|
633 |
|
|
564 |
|
|
397 |
|
|
|
1,634 |
|
|
(1,326 |
) |
|
1,224 |
|
28. CHANGES IN OPERATING ASSETS AND LIABILITIES
|
|
|
|
|
|
|
|
|
|
Year ended December 31, |
2025 |
|
2024 |
|
|
2023 |
|
(millions of Canadian dollars) |
|
|
|
|
|
|
Trade receivables and unbilled revenues |
|
(516 |
) |
|
(1,638 |
) |
|
1,125 |
|
Accounts receivable from affiliates |
|
(3 |
) |
|
(23 |
) |
|
18 |
|
Inventory |
|
(166 |
) |
|
177 |
|
|
763 |
|
Other current and non-current assets |
|
(89 |
) |
|
(426 |
) |
|
1,301 |
|
Trade payables and accrued liabilities |
|
361 |
|
|
1,383 |
|
|
(1,542 |
) |
Accounts payable to affiliates |
|
22 |
|
|
(8 |
) |
|
(66 |
) |
Interest payable |
|
(54 |
) |
|
157 |
|
|
199 |
|
Other current and non-current liabilities |
|
(960 |
) |
|
245 |
|
|
513 |
|
|
|
(1,405 |
) |
|
(133 |
) |
|
2,311 |
|
29. RELATED PARTY TRANSACTIONS
Related party transactions are conducted in the normal course of business and, unless otherwise noted, are measured at the exchange amount, which is the amount of consideration established and agreed to by the related parties.
We provide transportation services to several significantly influenced investees which we record as transportation and other services revenue. We also purchase natural gas and crude oil with several of our significantly influenced investees which we record as commodity costs. We contract for firm transportation services to meet our annual natural gas supply requirements which we record as gas distribution costs.
Our transactions with significantly influenced investees are as follows:
|
|
|
|
|
|
|
|
|
|
Year ended December 31, |
2025 |
|
2024 |
|
2023 |
|
(millions of Canadian dollars) |
|
|
|
|
|
|
Transportation and other revenues |
|
197 |
|
|
181 |
|
|
169 |
|
Operating and administrative1 |
|
615 |
|
|
637 |
|
|
625 |
|
Commodity costs |
|
38 |
|
|
22 |
|
|
63 |
|
Gas distribution costs |
|
149 |
|
|
147 |
|
|
140 |
|
1.During the years ended December 31, 2025, 2024 and 2023, we had Operating and administrative costs from the Seaway Crude Pipeline System of $621 million, $650 million and $632 million, respectively. These costs are a result of an operational contract where we utilize capacity on Seaway Crude Pipeline System assets for use in our Liquids Pipelines business.
For details on guarantee arrangements entered with related parties, refer to Note 12 - Variable Interest Entities and Note 31 - Guarantees.
AFFILIATE LOAN
The following loan from affiliate is evidenced by formal loan agreements:
|
|
|
|
|
|
|
December 31, |
|
2025 |
|
|
2024 |
|
(millions of Canadian dollars) |
|
|
|
|
EIH S.à r.l.1 |
|
228 |
|
|
172 |
|
1The loan is denominated in Euros. As at December 31, 2025, the outstanding balance of the demand loan is €141 million (2024 - €116 million). During the year ended December 31, 2025, we borrowed on the demand loan of €25 million. The demand loan bears an interest rate of 3.10%. The amounts are included in Other current liabilities in the Consolidated Statements of Financial Position.
30. COMMITMENTS AND CONTINGENCIES
COMMITMENTS
As at December 31, 2025, we have commitments as detailed below:
|
|
|
|
|
|
|
|
|
Total |
Less than 1 year |
2 years |
3 years |
4 years |
5 years |
Thereafter |
(millions of Canadian dollars) |
|
|
|
|
|
|
|
Purchase of services, pipe and other
materials, including transportation1 |
16,968 |
6,939 |
2,524 |
2,163 |
1,525 |
875 |
2,942 |
Maintenance agreements2 |
414 |
53 |
54 |
35 |
36 |
35 |
201 |
Right-of-way commitments3 |
902 |
44 |
45 |
49 |
45 |
45 |
674 |
Total |
18,284 |
7,036 |
2,623 |
2,247 |
1,606 |
955 |
3,817 |
1Includes capital and operating commitments. Consists primarily of firm capacity payments that provide us with uninterrupted firm access to natural gas and crude oil transportation and storage contracts; contractual obligations to purchase physical quantities of natural gas; and power commitments.
2Consists primarily of maintenance service contracts for our wind and solar assets.
3Our right-of-way obligations primarily consist of non-lease agreements that existed at the time of adopting Topic 842 Leases, at which time we elected a practical expedient that allowed us to continue our historical treatment.
ENVIRONMENTAL
We are subject to various Canadian and US federal, provincial/state and local laws relating to the protection of the environment. These laws and regulations can change from time to time, imposing new obligations on us.
Environmental risk is inherent to liquid hydrocarbon and natural gas pipeline operations, and Enbridge and its affiliates are, at times, subject to environmental remediation obligations at various sites where we operate. We manage this environmental risk through appropriate environmental policies, programs and practices to minimize any impact our operations may have on the environment. To the extent that we are unable to recover payment for environmental liabilities from insurance or other potentially responsible parties, we will be responsible for payment of costs arising from environmental incidents associated with our operating activities.
OTHER LITIGATION
We and our subsidiaries are subject to various other legal and regulatory actions and proceedings which arise in the normal course of business, including interventions in regulatory proceedings and challenges to regulatory approvals and permits. While the final outcome of such actions and proceedings cannot be predicted with certainty, management believes that the resolution of such actions and proceedings will not have a material impact on our consolidated financial position or results of operations.
INSURANCE
We maintain an insurance program for us, our subsidiaries and certain of our affiliates to mitigate a certain portion of our risks. However, not all risks are insurable, or are insured by us. We self-insure a significant portion of certain risks through our wholly-owned captive insurance subsidiary, which requires certain assumptions and management judgment regarding the frequency and severity of claims, claim development and settlement practices and the selection of estimated loss among estimates derived using different methods. Our insurance coverage is also subject to terms and conditions, exclusions and large deductibles or self-insured retentions which may reduce or eliminate coverage in certain circumstances.
Our insurance policies are generally renewed annually and premiums, terms, policy limits and/or deductibles can vary substantially based on factors like market conditions. We can give no assurance that we will be able to maintain adequate insurance in the future at rates or on other terms we consider commercially reasonable. In such case, we may decide to self-insure additional risks.
In the unlikely event multiple insurable incidents occur which exceed coverage limits within the same insurance period, the total insurance coverage will be allocated among entities on an equitable basis based on an insurance allocation agreement we have entered into with us and other subsidiaries.
31. GUARANTEES
In the normal course of conducting business, we may enter into agreements which indemnify third parties and affiliates. We may also be a party to agreements with subsidiaries, jointly owned entities, unconsolidated entities such as equity method investees, or entities with other ownership arrangements that require us to provide financial and performance guarantees. Financial guarantees include stand-by letters of credit, debt guarantees, surety bonds and indemnifications. To varying degrees, these guarantees involve elements of performance and credit risk, which are not included in our Consolidated Statements of Financial Position. Performance guarantees require us to make payments to a third party if the guaranteed entity does not perform on its contractual obligations, such as debt agreements, purchase or sale agreements, and construction contracts and leases.
We typically enter into these arrangements to facilitate commercial transactions with third parties. Examples include indemnifying counterparties pursuant to sale agreements for assets or businesses in matters such as breaches of representations, warranties or covenants, loss or damages to property, environmental liabilities, and litigation and contingent liabilities. We may indemnify third parties for certain liabilities relating to environmental matters arising from operations prior to the purchase or transfer of certain assets and interests. Similarly, we may indemnify the purchaser of assets for certain tax liabilities incurred while we owned the assets, a misrepresentation related to taxes that result in a loss to the purchaser or other certain tax liabilities related to those assets.
The likelihood of having to perform under these guarantees and indemnifications is largely dependent upon future operations of various subsidiaries, investees and other third parties, or the occurrence of certain future events. We cannot reasonably estimate the total maximum potential amounts that could become payable to third parties and affiliates under such agreements described above; however, historically, we have not made any significant payments under guarantee or indemnification provisions. While these agreements may specify a maximum potential exposure, or a specified duration to the guarantee or indemnification obligation, there are circumstances where the amount and duration are unlimited. As at December 31, 2025, guarantees and indemnifications have not had, and are not reasonably likely to have, a material effect on our financial condition, changes in financial condition, earnings, liquidity, capital expenditures or capital resources.
For details on guarantee arrangements entered with related parties, refer to note Note 12 - Variable Interest Entities and Note 29 - Related Party Transactions.
32. QUARTERLY FINANCIAL DATA (UNAUDITED)
|
|
|
|
|
|
|
Q1 |
Q2 |
Q3 |
Q4 |
Total |
(unaudited; millions of Canadian dollars, except per share amounts) |
|
|
|
|
|
2025 |
|
|
|
|
|
Operating revenues |
18,502 |
14,876 |
14,639 |
17,177 |
65,194 |
Operating income |
3,672 |
2,289 |
2,271 |
2,726 |
10,958 |
Earnings |
2,490 |
2,321 |
847 |
2,131 |
7,789 |
Earnings attributable to controlling interests |
2,364 |
2,279 |
788 |
2,060 |
7,491 |
Earnings attributable to common shareholders |
2,261 |
2,177 |
682 |
1,952 |
7,072 |
Earnings per common share |
|
|
|
|
|
Basic |
1.04 |
1.00 |
0.30 |
0.89 |
3.23 |
Diluted |
1.03 |
1.00 |
0.30 |
0.89 |
3.22 |
2024 |
|
|
|
|
|
Operating revenues |
11,038 |
11,336 |
14,882 |
16,217 |
53,473 |
Operating income |
2,711 |
2,273 |
2,218 |
2,447 |
9,649 |
Earnings |
1,565 |
2,001 |
1,447 |
618 |
5,631 |
Earnings attributable to controlling interests |
1,512 |
1,943 |
1,391 |
595 |
5,441 |
Earnings attributable to common shareholders |
1,419 |
1,848 |
1,293 |
493 |
5,053 |
Earnings per common share |
|
|
|
|
|
Basic |
0.67 |
0.86 |
0.59 |
0.23 |
2.34 |
Diluted |
0.67 |
0.86 |
0.59 |
0.23 |
2.34 |
ITEM 9. CHANGES IN AND DISAGREEMENTS WITH ACCOUNTANTS ON ACCOUNTING AND FINANCIAL DISCLOSURE
None.
ITEM 9A. CONTROLS AND PROCEDURES
DISCLOSURE CONTROLS AND PROCEDURES
Disclosure controls and procedures are designed to provide reasonable assurance that information required to be disclosed in reports filed with, or submitted to, securities regulatory authorities is recorded, processed, summarized and reported within the time periods specified under Canadian and US securities law. As at December 31, 2025, an evaluation was carried out under the supervision of and with the participation of our management, including the Chief Executive Officer and Chief Financial Officer, of the effectiveness of the design and operations of our disclosure controls and procedures (as defined in Rule 13a-15(e) and 15d-15(e) under the Exchange Act). Based on that evaluation, the Chief Executive Officer and Chief Financial Officer concluded that the design and operation of these disclosure controls and procedures were effective in ensuring that information required to be disclosed by us in reports that we file with or submit to the SEC and the Canadian Securities Administrators is recorded, processed, summarized and reported within the time periods required.
INTERNAL CONTROL OVER FINANCIAL REPORTING
Management's Annual Report on Internal Control over Financial Reporting
Our management is responsible for establishing and maintaining adequate internal control over financial reporting as such term is defined in the rules of the SEC and the Canadian Securities Administrators. Our internal control over financial reporting is a process designed under the supervision and with the participation of executive and financial officers to provide reasonable assurance regarding the reliability of financial reporting and the preparation of our financial statements for external reporting purposes in accordance with US GAAP.
Our internal control over financial reporting includes policies and procedures that:
•pertain to the maintenance of records that, in reasonable detail, accurately and fairly reflect transactions and dispositions of our assets;
•provide reasonable assurance that transactions are recorded as necessary to permit preparation of financial statements in accordance with US GAAP; and
•provide reasonable assurance regarding prevention or timely detection of unauthorized acquisition, use or disposition of our assets that could have a material effect on the financial statements.
Our internal control over financial reporting may not prevent or detect all misstatements because of inherent limitations. Additionally, projections of any evaluation of effectiveness to future periods are subject to the risk that controls may become inadequate because of changes in conditions or deterioration in the degree of compliance with our policies and procedures.
Our management assessed the effectiveness of our internal control over financial reporting as at December 31, 2025, based on the framework established in Internal Control – Integrated Framework (2013) issued by the Committee of Sponsoring Organizations of the Treadway Commission. Based on this assessment, our management concluded that we maintained effective internal control over financial reporting as at December 31, 2025.
The effectiveness of our internal control over financial reporting as at December 31, 2025 has been audited by PricewaterhouseCoopers LLP, Independent Registered Public Accounting Firm appointed by our shareholders. As stated in their Report of Independent Registered Public Accounting Firm which appears in Item 8. Financial Statements and Supplementary Data, they expressed an unqualified opinion on the effectiveness of our internal control over financial reporting as at December 31, 2025.
Changes in Internal Control Over Financial Reporting
During the three months ended December 31, 2025, there has been no material change in our internal control over financial reporting.
ITEM 9B. OTHER INFORMATION
OFFICERS AND DIRECTORS TRADING ARRANGEMENTS
Certain of our officers and directors have made elections to participate in, and are participating in, our compensation and benefit plans involving Enbridge stock, such as our 401(k) plan and directors’ compensation plan, and may from time to time make elections which may be designed to satisfy the affirmative defense conditions of Rule 10b5-1 under the Exchange Act or may constitute non-Rule 10b5-1 trading arrangements (as defined in Item 408(c) of Regulation S-K). During the fourth quarter of 2025, none of our directors or officers adopted or terminated a trading plan intended to satisfy Rule 10b5-1 or any non-Rule 10b5-1 trading arrangement, as defined in Item 408 of Regulation S-K.
ITEM 9C. DISCLOSURE REGARDING FOREIGN JURISDICTIONS THAT PREVENT INSPECTIONS
Not applicable.
PART III
ITEM 10. DIRECTORS, EXECUTIVE OFFICERS AND CORPORATE GOVERNANCE
Directors of Registrant
The information required by this Item will be disclosed in our Form 10-K/A, which will be filed no later than 120 days after December 31, 2025. This information will also be disclosed in the management information circular that we prepare in accordance with Canadian corporate and securities law requirements.
Executive Officers of Registrant
The information regarding executive officers is included in Part I Item 1. Business - Executive Officers.
Code of Ethics for Chief Executive Officer and Senior Financial Officers
The information required by this Item will be disclosed in our Form 10-K/A, which will be filed no later than 120 days after December 31, 2025. This information will also be disclosed in the management information circular that we prepare in accordance with Canadian corporate and securities law requirements.
Insider Trading Policies and Procedures
The information required by this Item will be disclosed in our Form 10-K/A, which will be filed no later than 120 days after December 31, 2025. This information will also be disclosed in the management information circular that we prepare in accordance with Canadian corporate and securities law requirements.
ITEM 11. EXECUTIVE COMPENSATION
The information required by this Item will be disclosed in our Form 10-K/A, which will be filed no later than 120 days after December 31, 2025. This information will also be disclosed in the management information circular that we prepare in accordance with Canadian corporate and securities law requirements.
ITEM 12. SECURITY OWNERSHIP OF CERTAIN BENEFICIAL OWNERS AND MANAGEMENT AND RELATED STOCKHOLDER MATTERS
The information required by this Item will be disclosed in our Form 10-K/A, which will be filed no later than 120 days after December 31, 2025. This information will also be disclosed in the management information circular that we prepare in accordance with Canadian corporate and securities law requirements.
ITEM 13. CERTAIN RELATIONSHIPS AND RELATED TRANSACTIONS, AND DIRECTOR INDEPENDENCE
The information required by this Item will be disclosed in our Form 10-K/A, which will be filed no later than 120 days after December 31, 2025. This information will also be disclosed in the management information circular that we prepare in accordance with Canadian corporate and securities law requirements.
ITEM 14. PRINCIPAL ACCOUNTANT FEES AND SERVICES
The information required by this Item will be disclosed in our Form 10-K/A, which will be filed no later than 120 days after December 31, 2025. This information will also be disclosed in the management information circular that we prepare in accordance with Canadian corporate and securities law requirements.
PART IV
ITEM 15. EXHIBIT AND FINANCIAL STATEMENT SCHEDULES
(a) Consolidated Financial Statements, Supplemental Financial Data and Supplemental Schedules included in Part II of this annual report are as follows:
Enbridge Inc.:
Report of Independent Registered Public Accounting Firm (PCAOB ID 271)
Consolidated Statements of Earnings
Consolidated Statements of Comprehensive Income
Consolidated Statements of Changes in Equity
Consolidated Statements of Cash Flows
Consolidated Statements of Financial Position
Notes to the Consolidated Financial Statements
All schedules are omitted because they are not required or because the required information is included in the Consolidated Financial Statements or Notes.
(b) Exhibits:
Reference is made to the “Index of Exhibits” following Item 16. Form 10-K Summary, which is hereby incorporated into this Item.
ITEM 16. FORM 10-K SUMMARY
Not applicable.
INDEX OF EXHIBITS
Each exhibit identified below is included as a part of this annual report. Exhibits included in this filing are designated by an asterisk (“*”); all exhibits not so designated are incorporated by reference to a prior filing as indicated. Exhibits designated with a “+” constitute a management contract or compensatory plan arrangement.
|
|
|
Exhibit No. |
|
Name of Exhibit |
|
|
|
2.1 |
|
Purchase and Sale Agreement, dated as of September 5, 2023, by and between Dominion Energy, Inc. and Enbridge Elephant Holdings, LLC (incorporated by reference to Exhibit 2.1 to Enbridge’s Form 10-Q filed November 3, 2023) |
2.2 |
|
Purchase and Sale Agreement, dated as of September 5, 2023, by and between Dominion Energy, Inc. and Enbridge Parrot Holdings, LLC (incorporated by reference to Exhibit 2.2 to Enbridge’s Form 10-Q filed November 3, 2023) |
2.3 |
|
Purchase and Sale Agreement, dated as of September 5, 2023, by and between Dominion Energy, Inc. and Enbridge Quail Holdings, LLC (incorporated by reference to Exhibit 2.3 to Enbridge’s Form 10-Q filed November 3, 2023) |
3.1 |
|
Articles of Continuance of the Corporation, dated December 15, 1987 (incorporated by reference to Exhibit 2.1(a) to Enbridge’s Registration Statement on Form S-8 filed May 7, 2001) |
3.2 |
|
Certificate of Amendment, dated August 2, 1989, to the Articles of the Corporation (incorporated by reference to Exhibit 2.1(b) to Enbridge’s Registration Statement on Form S-8 filed May 7, 2001) |
3.3 |
|
Articles of Amendment of the Corporation, dated April 30, 1992 (incorporated by reference to Exhibit 2.1(c) to Enbridge’s Registration Statement on Form S-8 filed May 7, 2001) |
3.4 |
|
Articles of Amendment of the Corporation, dated July 2, 1992 (incorporated by reference to Exhibit 2.1(d) to Enbridge’s Registration Statement on Form S-8 filed May 7, 2001) |
3.5 |
|
Articles of Amendment of the Corporation, dated August 6, 1992 (incorporated by reference to Exhibit 2.1(e) to Enbridge’s Registration Statement on Form S-8 filed May 7, 2001) |
3.6 |
|
Articles of Arrangement of the Corporation dated December 18, 1992, attaching the Arrangement Agreement, dated December 15, 1992 (incorporated by reference to Exhibit 2.1(f) to Enbridge’s Registration Statement on Form S-8 filed May 7, 2001) |
3.7 |
|
Certificate of Amendment of the Corporation (notarial certified copy), dated December 18, 1992 (incorporated by reference to Exhibit 2.1(g) to Enbridge’s Registration Statement on Form S-8 filed May 7, 2001) |
3.8 |
|
Articles of Amendment of the Corporation, dated May 5, 1994 (incorporated by reference to Exhibit 2.1(h) to Enbridge’s Registration Statement on Form S-8 filed May 7, 2001) |
3.9 |
|
Certificate of Amendment, dated October 7, 1998 (incorporated by reference to Exhibit 2.1(i) to Enbridge’s Registration Statement on Form S-8 filed May 7, 2001) |
3.10 |
|
Certificate of Amendment, dated November 24, 1998 (incorporated by reference to Exhibit 2.1(j) to Enbridge’s Registration Statement on Form S-8 filed May 7, 2001) |
3.11 |
|
Certificate of Amendment, dated April 29, 1999 (incorporated by reference to Exhibit 2.1(k) to Enbridge’s Registration Statement on Form S-8 filed May 7, 2001) |
|
|
|
3.12 |
|
Certificate of Amendment, dated May 5, 2005 (incorporated by reference to Exhibit 2.1(l) to Enbridge’s Registration Statement on Form S-8 filed August 5, 2005) |
3.13 |
|
Certificate of Amendment, dated May 11, 2011 (incorporated by reference to Exhibit 3.13 to Enbridge’s Registration Statement on Form F-4 filed September 23, 2017) |
3.14 |
|
Certificate of Amendment, dated September 28, 2011 (incorporated by reference to Exhibit 3.14 to Enbridge’s Registration Statement on Form F-4 filed September 23, 2017) |
3.15 |
|
Certificate of Amendment, dated November 21, 2011 (incorporated by reference to Exhibit 3.15 to Enbridge’s Registration Statement on Form F-4 filed September 23, 2017) |
3.16 |
|
Certificate of Amendment, dated January 16, 2012 (incorporated by reference to Exhibit 3.16 to Enbridge’s Registration Statement on Form F-4 filed September 23, 2017) |
3.17 |
|
Certificate of Amendment, dated March 27, 2012 (incorporated by reference to Exhibit 3.17 to Enbridge’s Registration Statement on Form F-4 filed September 23, 2017) |
3.18 |
|
Certificate of Amendment, dated April 16, 2012 (incorporated by reference to Exhibit 3.18 to Enbridge’s Registration Statement on Form F-4 filed September 23, 2017) |
3.19 |
|
Certificate of Amendment, dated May 17, 2012 (incorporated by reference to Exhibit 3.19 to Enbridge’s Registration Statement on Form F-4 filed September 23, 2017) |
3.20 |
|
Certificate of Amendment, dated July 12, 2012 (incorporated by reference to Exhibit 3.20 to Enbridge’s Registration Statement on Form F-4 filed September 23, 2017) |
3.21 |
|
Certificate of Amendment, dated September 11, 2012 (incorporated by reference to Exhibit 3.21 to Enbridge’s Registration Statement on Form F-4 filed September 23, 2017) |
3.22 |
|
Certificate of Amendment, dated December 3, 2012 (incorporated by reference to Exhibit 3.22 to Enbridge’s Registration Statement on Form F-4 filed September 23, 2017) |
3.23 |
|
Certificate of Amendment, dated March 25, 2013 (incorporated by reference to Exhibit 3.23 to Enbridge’s Registration Statement on Form F-4 filed September 23, 2017) |
3.24 |
|
Certificate of Amendment, dated June 4, 2013 (incorporated by reference to Exhibit 3.24 to Enbridge’s Registration Statement on Form F-4 filed September 23, 2017) |
3.25 |
|
Certificate of Amendment, dated September 25, 2013 (incorporated by reference to Exhibit 3.25 to Enbridge’s Registration Statement on Form F-4 filed September 23, 2017) |
3.26 |
|
Certificate of Amendment, dated December 10, 2013 (incorporated by reference to Exhibit 3.26 to Enbridge’s Registration Statement on Form F-4 filed September 23, 2017) |
3.27 |
|
Certificate of Amendment, dated March 10, 2014 (incorporated by reference to Exhibit 3.27 to Enbridge’s Registration Statement on Form F-4 filed September 23, 2017) |
3.28 |
|
Certificate of Amendment, dated May 20, 2014 (incorporated by reference to Exhibit 3.28 to Enbridge’s Registration Statement on Form F-4 filed September 23, 2017) |
3.29 |
|
Certificate of Amendment, dated July 15, 2014 (incorporated by reference to Exhibit 3.29 to Enbridge’s Registration Statement on Form F-4 filed September 23, 2017) |
3.30 |
|
Certificate of Amendment, dated September 19, 2014 (incorporated by reference to Exhibit 3.30 to Enbridge’s Registration Statement on Form F-4 filed September 23, 2017) |
3.31 |
|
Certificate of Amendment, dated November 22, 2016 (incorporated by reference to Enbridge’s Report of Foreign Issuer on Form 6-K filed December 1, 2016) |
|
|
|
3.32 |
|
Certificate of Amendment, dated December 15, 2016 (incorporated by reference to Enbridge’s Report of Foreign Issuer on Form 6-K filed December 16, 2016) |
3.33 |
|
Certificate of Amendment, dated July 13, 2017 (incorporated by reference to Enbridge’s Report of Foreign Issuer on Form 6-K filed July 13, 2017) |
3.34 |
|
Certificate of Amendment, dated September 25, 2017 (incorporated by reference to Exhibit 3.34 to Enbridge’s Annual Report on Form 10-K filed February 16, 2018) |
3.35 |
|
Certificate of Amendment, dated December 7, 2017 (incorporated by reference to Exhibit 3.35 to Enbridge’s Annual Report on Form 10-K filed February 16, 2018) |
3.36 |
|
Certificate of Amendment, dated February 27, 2018 (incorporated by reference to Exhibit 3.1 to Enbridge’s Current Report on Form 8-K filed March 1, 2018) |
3.37 |
|
Certificate of Amendment, dated April 9, 2018 (incorporated by reference to Exhibit 3.1 to Enbridge’s Current Report on Form 8-K filed April 12, 2018) |
3.38 |
|
Certificate of Amendment, dated April 10, 2018 (incorporated by reference to Exhibit 3.1 to Enbridge’s Current Report on Form 8-K filed April 12, 2018) |
3.39 |
|
Certificate and Articles of Amendment, dated July 6, 2020 (incorporated by reference to Exhibit 3.1 to Enbridge’s Current Report on Form 8-K filed July 8, 2020) |
3.40 |
|
Certificate of Amendment, dated January 17, 2022 (incorporated by reference to Exhibit 3.1 to Enbridge’s Current Report on Form 8-K filed January 20, 2022) |
3.41 |
|
Certificate of Amendment, dated September 15, 2022 (incorporated by reference to Exhibit 3.1 to Enbridge’s Current Report on Form 8-K filed September 20, 2022) |
3.42 |
|
Certificate of Amendment, dated September 15, 2022 (incorporated by reference to Exhibit 3.2 to Enbridge’s Current Report on Form 8-K filed September 20, 2022) |
3.43 |
|
Certificate and Articles of Amendment dated September 21, 2023, relating to the Series 2023-A Preference Shares (incorporated by reference to Exhibit 3.1 to Enbridge’s Current Report on Form 8-K filed September 25, 2023) |
3.44 |
|
Certificate and Articles of Amendment dated September 21, 2023, relating to the Series 2023-B Preference Shares (incorporated by reference to Exhibit 3.2 to Enbridge’s Current Report on Form 8-K filed September 25, 2023) |
3.45 |
|
Certificate and Articles of Amendment dated September 28, 2023, relating to the Series 2023-C Conversion Preference Shares (incorporated by reference to Exhibit 3.1 to Enbridge’s Current Report on Form 8-K filed October 2, 2023) |
3.46 |
|
Certificate and Articles of Amendment dated September 28, 2023, relating to the Series 2023-D Conversion Preference Shares (incorporated by reference to Exhibit 3.2 to Enbridge’s Current Report on Form 8-K filed October 2, 2023) |
3.47 |
|
General By-Law No. 1 of Enbridge Inc. (incorporated by reference to Exhibit 3.40 to Enbridge’s Form 10-K filed February 11, 2022) |
3.48 |
|
By-Law No. 2 of Enbridge Inc. (incorporated by reference to Enbridge’s Current Report on Form 6-K filed December 5, 2014) |
4.1 |
|
Form of Indenture between Enbridge Inc. and Deutsche Bank Trust Company Americas to be dated February 25, 2005 (incorporated by reference to Exhibit 7.1 to Enbridge’s Registration Statement on Form F-10 filed February 4, 2005) |
4.2 |
|
First Supplemental Indenture between Enbridge Inc. and Deutsche Bank Trust Company Americas, dated March 1, 2012 (incorporated by reference to Exhibit 7.3 to Enbridge’s Registration Statement on Form F-10 filed May 11, 2012) |
4.3 |
|
Second Supplemental Indenture between Enbridge Inc. and Deutsche Bank Trust Company Americas, dated December 19, 2016 (incorporated by reference to Enbridge’s Report of Foreign Issuer on Form 6-K filed December 20, 2016) |
|
|
|
4.4 |
|
Third Supplemental Indenture between Enbridge Inc. and Deutsche Bank Trust Company Americas, dated July 14, 2017 (incorporated by reference to Enbridge’s Report of Foreign Issuer on Form 6-K filed July 14, 2017) |
4.5 |
|
Fourth Supplemental Indenture between Enbridge Inc. and Deutsche Bank Trust Company Americas, dated March 1, 2018 (incorporated by reference to Enbridge’s Current Report on Form 8-K filed March 1, 2018) |
4.6 |
|
Sixth Supplemental Indenture between Enbridge Inc., Spectra Energy Partners, LP (as guarantor), Enbridge Energy Partners, L.P. (as guarantor) and Deutsche Bank Trust Company Americas, dated May 13, 2019 (incorporated by reference to Enbridge’s Registration Statement on Form S-3 filed May 17, 2019) |
4.7 |
|
Seventh Supplemental Indenture to the Indenture between Enbridge Inc. and Deutsche Bank Trust Company Americas, dated July 8, 2020 (incorporated by reference to Exhibit 4.1 to Enbridge’s Current Report on Form 8-K filed July 8, 2020) |
4.8 |
|
Eighth Supplemental Indenture to the Indenture between Enbridge Inc. and Deutsche Bank Trust Company Americas, dated June 28, 2021 (incorporated by reference to Exhibit 4.4 to Enbridge’s Current Report on Form 8-K filed June 28, 2021) |
4.9 |
|
Ninth Supplemental Indenture to the Indenture between Enbridge Inc. and Deutsche Bank Trust Company Americas, dated September 20, 2022 (incorporated by reference to Exhibit 4.1 to Enbridge’s Current Report on Form 8-K filed September 20, 2022) |
4.10 |
|
Tenth Supplemental Indenture to the Indenture between Enbridge Inc. and Deutsche Bank Trust Company Americas, dated September 20, 2022 (incorporated by reference to Exhibit 4.2 to Enbridge’s Current Report on Form 8-K filed September 20, 2022) |
4.11 |
|
Eleventh Supplemental Indenture between Enbridge Inc. and Deutsche Bank Trust Company Americas, dated September 25, 2023 (incorporated by reference to Exhibit 4.1 to Enbridge’s current Report on Form 8-K Filed September 25, 2023) |
4.12 |
|
Twelfth Supplemental Indenture between Enbridge Inc. and Deutsche Bank Trust Company Americas, dated September 25, 2023 (incorporated by reference to Exhibit 4.2 to Enbridge’s current Report on Form 8-K Filed September 25, 2023) |
4.13 |
|
Thirteenth Supplemental Indenture between Enbridge Inc. and Deutsche Bank Trust Company Americas, dated as of June 27, 2024 (incorporated by reference to Exhibit 4.1 to Enbridge’s current Report on Form 8-K filed June 27, 2024) |
4.14 |
|
Fourteenth Supplemental Indenture between Enbridge Inc. and Deutsche Bank Trust Company Americas, dated June 27, 2024 (incorporated by reference to Exhibit 4.2 to Enbridge’s current Report on Form 8-K filed June 27, 2024) |
4.15 |
|
Shareholder Rights Plan Agreement between Enbridge Inc. and Computershare Trust Company of Canada dated as of November 9, 1995 and Amended and Restated as of May 3, 2023 (incorporated by reference to Exhibit 4.1 to Enbridge’s Current Report on Form 8-K filed May 4, 2023) |
4.16 |
* |
Description of Securities Registered Under Section 12 of the Securities Exchange Act, as amended |
|
|
Certain instruments defining the rights of holders of long-term debt securities of the Registrant and its subsidiaries are omitted pursuant to Item 601(b)(4)(iii) of Regulation S-K. The Registrant hereby undertakes to furnish to the SEC, upon request, copies of any such instruments. |
10.1 |
|
Enbridge Pipelines Inc. Mainline Tolling Settlement dated December 15, 2023 (incorporated by reference to Exhibit 10.1 to Enbridge’s current Report on Form 8-K filed March 8, 2024) |
|
|
|
10.2 |
|
Sixteenth Supplemental Indenture dated as of January 22, 2019 between Enbridge Energy Partners, L.P. and US Bank National Association, as trustee (incorporated by reference as Exhibit 4.1 to Enbridge’s Current Report on Form 8-K filed January 24, 2019) |
10.3 |
|
Seventeenth Supplemental Indenture dated as of January 22, 2019 between Enbridge Energy Partners, L.P., Enbridge Inc. and US Bank National Association, as trustee (incorporated by reference as Exhibit 4.2 to Enbridge’s Current Report on Form 8-K filed January 24, 2019) |
10.4 |
|
Seventh Supplemental Indenture dated as of January 22, 2019 between Spectra Energy Partners, LP, Enbridge Inc. and Wells Fargo Bank, National Association, as trustee (incorporated by reference as Exhibit 4.3 to Enbridge’s Current Report on Form 8-K filed January 24, 2019) |
10.5 |
|
Eighth Supplemental Indenture dated as of January 22, 2019 between Spectra Energy Partners, LP, Enbridge Inc. and Wells Fargo Bank, National Association, as trustee (incorporated by reference as Exhibit 4.4 to Enbridge’s Current Report on Form 8-K filed January 24, 2019) |
10.6 |
|
Subsidiary Guarantee Agreement dated as of January 22, 2019 between Spectra Energy Partners, LP and Enbridge Energy Partners, L.P. (incorporated by reference as Exhibit 4.5 to Enbridge’s Current Report on Form 8-K filed January 24, 2019) |
10.7 |
+ |
Form of Executive Employment Agreement (2017) (incorporated by reference to Exhibit 10.4 to Enbridge’s Annual Report on Form 10-K filed February 16, 2018) |
10.8 |
+ |
Form of Executive Employment Agreement (2022) with Enbridge Employee Services, Inc. (incorporated by reference to Exhibit 10.1 to Enbridge’s Form 10-Q filed on July 29, 2022) |
10.9 |
+ |
Form of Executive Employment Agreement (2023) with Enbridge Employee Services, Inc. (incorporated by reference to Exhibit 10.1 of Enbridge’s Current Report on Form 8-K Amendment No. 2 filed March 20, 2023) |
10.10 |
+ |
Amendment to Executive Employment Agreement between Enbridge Employee Services, Inc. and Cynthia Hanson, dated September 29, 2025 (incorporated by reference to Exhibit 10.1 to Enbridge’s Form 10-Q filed November 7, 2025) |
10.11 |
+ |
Form of Indemnification Agreement (2015) (director or officer) (incorporated by reference to Exhibit 10.11 to Enbridge’s Annual Report on Form 10-K filed February 15, 2019) |
10.12 |
+ |
Enbridge Inc. 2019 Long Term Incentive Plan (incorporated by reference to Appendix A to Enbridge’s Proxy Statement on Schedule 14A for Enbridge’s Annual Meeting of Shareholders (File No. 001-15254) filed March 27, 2019) |
10.13 |
+ |
Form of Enbridge Inc. 2019 Long Term Incentive Plan Stock Option Grant Notice and Stock Option Award Agreement (2025) (incorporated by reference to Exhibit 10.1 to Enbridge’s Form 10-Q filed May 9, 2025) |
10.14 |
+ |
Form of Enbridge Inc. 2019 Long Term Incentive Plan Performance Stock Unit Grant Notice and Performance Stock Unit Award Agreement (2025) (incorporated by reference to Exhibit 10.2 to Enbridge’s Form 10-Q filed May 9, 2025) |
10.15 |
+ |
Form of Enbridge Inc. 2019 Long Term Incentive Plan Restricted Stock Unit Grant Notice and Restricted Stock Unit Award Agreement (2025) (incorporated by reference to Exhibit 10.3 to Enbridge’s Form 10-Q filed May 9, 2025) |
10.16 |
+ |
Form of Enbridge Inc. 2019 Long Term Incentive Plan Stock Option Grant Notice and Stock Option Award Agreement (2021) (incorporated by reference to Exhibit 10.1 to Enbridge’s Form 10-Q filed May 7, 2021) |
|
|
|
10.17 |
+ |
Form of Enbridge Inc. 2019 Long Term Incentive Plan Stock Option Grant Notice and Stock Option Award Agreement (2020) (incorporated by reference to Exhibit 10.1 to Enbridge’s Form 10-Q filed May 7, 2020) |
10.18 |
+ |
Form of Enbridge Inc. 2019 Long Term Incentive Plan Stock Option Grant Notice and Stock Option Award Agreement (incorporated by reference to Exhibit 10.4 to Enbridge’s Form 10-Q filed May 10, 2019) |
10.19 |
+ |
Enbridge Inc. Incentive Stock Option Plan (2007), as amended and restated (2011) (incorporated by reference to Exhibit 10.13 to Enbridge’s Annual Report on Form 10-K filed February 16, 2018) |
10.20 |
+ |
Enbridge Inc. Incentive Stock Option Plan (2007), as amended and restated (2011 and 2014) (incorporated by reference to Exhibit 10.14 to Enbridge’s Annual Report on Form 10-K filed February 16, 2018) |
10.21 |
+ |
Enbridge Inc. Incentive Stock Option Plan (2007), as revised (incorporated by reference to Exhibit 10.15 to Enbridge’s Annual Report on Form 10-K filed February 16, 2018) |
10.22 |
+ |
Enbridge Inc. Directors’ Compensation Plan dated February 12, 2025, effective January 1, 2025 (incorporated by reference to Exhibit 10.4 to Enbridge’s Form 10-Q filed May 9, 2025) |
10.23 |
+ |
Enbridge Inc. Directors’ Compensation Plan dated February 8, 2023, effective January 1, 2023 (incorporated by reference to Exhibit 10.1 to Enbridge’s Form 10-Q filed May 5, 2023) |
10.24 |
+ |
Enbridge Inc. Directors’ Compensation Plan dated February 9, 2021, effective April 1, 2021 (incorporated by reference to Exhibit 10.6 to Enbridge’s Form 10-Q filed May 7, 2021) |
10.25 |
+ |
Enbridge Inc. Directors’ Compensation Plan dated February 11, 2020, effective January 1, 2020 (incorporated by reference to Exhibit 10.1 to Enbridge’s Form 10-Q filed July 29, 2020) |
10.26 |
+ |
Enbridge Inc. Directors’ Compensation Plan dated February 14, 2018 Amended Effective February 12, 2019 (incorporated by reference to Exhibit 10.2 to Enbridge’s Form 10-Q filed May 10, 2019) |
10.27 |
+ |
Enbridge Inc. Directors’ Compensation Plan dated February 14, 2018, effective January 1, 2018 (incorporated by reference as Exhibit 10.3 to Enbridge’s Form 10-Q filed May 10, 2018) |
10.28 |
+ |
Enbridge Inc. Directors’ Compensation Plan, dated November 3, 2015, effective January 1, 2016 (incorporated by reference as Exhibit 10.16 to Enbridge’s Form 10-K filed February 16, 2018) |
10.29 |
+ |
Enbridge Inc. Short Term Incentive Plan (As Amended and Restated Effective January 1, 2023) (incorporated by reference to Exhibit 10.39 to Enbridge’s Form 10-K filed February 9, 2024) |
10.30 |
*+ |
Enbridge Inc. Senior Executives’ Deferred Stock Unit Plan dated November 1, 2025 |
10.31 |
*+ |
Enbridge Employee Services, Inc. Senior Executives’ Nonqualified Deferred Compensation Plan dated November 1, 2025 |
10.32 |
+ |
Enbridge Supplemental Pension Plan (As Amended and Restated Effective January 1, 2018) (incorporated by reference as Exhibit 10.1 to Enbridge’s Quarterly Report on Form 10-Q filed May 10, 2018) |
10.33 |
+ |
Amendment 1 to Enbridge Supplemental Pension Plan (As Amended and Restated Effective January 1, 2018) (incorporated by reference to Exhibit 10.43 to Enbridge’s Annual Report on Form 10-K filed February 14, 2025) |
|
|
|
10.34 |
+ |
Enbridge Supplemental Pension Plan for United States Employees (As Amended and Restated Effective January 1, 2005) (incorporated by reference to Exhibit 10.20 to Enbridge’s Annual Report on Form 10-K filed February 16, 2018) |
10.35 |
+ |
Amendment 1 and Amendment 2 to the Enbridge Supplemental Pension Plan for United States Employees (As Amended and Restated Effective January 1, 2005) (incorporated by reference to Exhibit 10.21 to Enbridge’s Annual Report on Form 10-K filed February 16, 2018) |
10.36 |
+ |
Third Amendment to The Enbridge Supplemental Pension Plan for United States Employees (As Amended and Restated Effective January 1, 2005) (incorporated by reference to Exhibit 10.2 to Enbridge’s Quarterly Report on Form 10-Q filed May 10, 2018) |
10.37 |
+ |
Fourth Amendment to The Enbridge Supplemental Pension Plan for United States Employees (As Amended and Restated Effective January 1, 2005) (incorporated by reference to Exhibit 10.42 to Enbridge’s Annual Report on Form 10-K filed February 10, 2023) |
10.38 |
+ |
Fifth Amendment to The Enbridge Supplemental Pension Plan for United States Employees (As Amended and Restated Effective January 1, 2005) (incorporated by reference to Exhibit 10.43 to Enbridge’s Annual Report on Form 10-K filed February 10, 2023) |
10.39 |
+ |
Spectra Energy Corp Directors’ Savings Plan, as amended and restated (incorporated by reference to Exhibit 10.22 to Enbridge’s Annual Report on Form 10-K filed February 16, 2018) |
10.40 |
+ |
Spectra Energy Corp Executive Savings Plan, as amended and restated (incorporated by reference to Exhibit 10.23 to Enbridge’s Annual Report on Form 10-K filed February 16, 2018) |
10.41 |
+ |
Spectra Energy Executive Cash Balance Plan, as amended and restated (incorporated by reference to Exhibit 10.24 to Enbridge’s Annual Report on Form 10-K filed February 16, 2018) |
10.42 |
+ |
Omnibus Amendment, dated June 20, 2014, to Spectra Energy Corp Executive Savings Plan, Spectra Energy Corp Executive Cash Balance Plan and Spectra Energy Corp 2007 Long-Term Incentive Plan (incorporated by reference to Exhibit 10.25 to Enbridge’s Annual Report on Form 10-K filed February 16, 2018) |
10.43 |
+ |
Form of Spectra Energy Corp Stock Option Agreement (Nonqualified Stock Options) (2016) pursuant to the Spectra Energy Corp 2007 Long-Term Incentive Plan (incorporated by reference to Exhibit 10.28 to Enbridge’s Annual Report on Form 10-K filed February 16, 2018) |
10.44 |
+ |
Spectra Energy Corp 2007 Long-Term Incentive Plan (as amended and restated) (incorporated by reference to Exhibit 10.32 to Enbridge’s Annual Report on Form 10-K filed February 16, 2018) |
10.45 |
+ |
Second Amendment to the Spectra Energy Corp Executive Savings Plan (As Amended and Restated Effective May 1, 2012) (incorporated by reference to Exhibit 10.36 to Enbridge’s Annual Report on Form 10-K filed February 16, 2018) |
10.46 |
+ |
Second Amendment to the Spectra Energy Corp Executive Cash Balance Plan (As Amended and Restated Effective May 1, 2012) (incorporated by reference to Exhibit 10.37 to Enbridge’s Annual Report on Form 10-K filed February 16, 2018) |
19.1 |
|
Enbridge Inc. Insider Trading Guidelines (incorporated by reference to Exhibit 19.1 to Enbridge’s Annual Report on Form 10-K filed February 14, 2025) |
21.1 |
* |
Subsidiaries of the Registrant |
22.1 |
* |
Subsidiary Guarantors |
SIGNATURES
POWER OF ATTORNEY
Each person whose signature appears below appoints Reginald D. Hedgebeth, Patrick R. Murray and David Taniguchi, and each of them, any of whom may act without the joinder of the other, as their true and lawful attorneys-in-fact and agents, with full power of substitution, for him or her and in his or her name, place and stead, in any and all capacities, to sign any and all amendments to this Annual Report of Enbridge on Form 10-K, and to file the same, with all exhibits thereto, and all other documents in connection therewith, with the Securities and Exchange Commission, granting unto said attorneys-in-fact and agents, and each of them, full power and authority to do and perform each and every act and thing requisite and necessary to be done, as fully to all intents and purposes as he or she might or would do in person, hereby ratifying and confirming all that said attorneys-in-fact and agents or any of them or their or his or her substitute and substitutes, may lawfully do or cause to be done by virtue hereof.
Pursuant to the requirements of Section 13 or 15(d) of the Securities Exchange Act of 1934, the registrant has duly caused this report to be signed on its behalf by the undersigned, thereunto duly authorized.
|
|
|
|
|
|
|
|
|
|
|
ENBRIDGE INC. |
|
|
|
|
(Registrant) |
|
|
|
|
|
|
|
Date: |
|
February 13, 2026 |
|
By: |
|
/s/ Gregory L. Ebel |
|
|
|
|
|
|
Gregory L. Ebel |
|
|
|
|
|
|
President and Chief Executive Officer |
Pursuant to the requirements of the Securities Exchange Act of 1934, this report has been signed below on February 13, 2026 by the following persons on behalf of the registrant and in the capacities indicated.
|
|
|
/s/ Gregory L. Ebel |
|
/s/ Patrick R. Murray |
Gregory L. Ebel |
|
Patrick R. Murray |
President and Chief Executive Officer |
|
Executive Vice President and Chief Financial Officer |
(Principal Executive Officer) |
|
(Principal Financial Officer) |
|
|
|
/s/ Melissa M. LaForge |
|
/s/ Steven W. Williams |
Melissa M. LaForge |
|
Steven W. Williams |
Senior Vice President and Chief Accounting Officer |
|
Chair of the Board of Directors |
(Principal Accounting Officer) |
|
|
|
|
|
/s/ Mayank (Mike) M. Ashar |
|
/s/ Gaurdie E. Banister |
Mayank (Mike) M. Ashar |
|
Gaurdie E. Banister |
Director |
|
Director |
|
|
|
/s/ Susan M. Cunningham |
|
/s/ Jason B. Few |
Susan M. Cunningham |
|
Jason B. Few |
Director |
|
Director |
|
|
|
/s/ Douglas L. Foshee |
|
/s/ Theresa B.Y. Jang |
Douglas L. Foshee |
|
Theresa B.Y. Jang |
Director |
|
Director |
|
|
|
/s/ Teresa S. Madden |
|
/s/ Manjit Minhas |
Teresa S. Madden |
|
Manjit Minhas |
Director |
|
Director |
|
|
|
/s/ Stephen S. Poloz |
|
/s/ S. Jane Rowe |
Stephen S. Poloz |
|
S. Jane Rowe |
Director |
|
Director |