


Strategy and Scenarios
In this section, we take a closer look at the climate dimension of the energy that we deliver as informed by IEA scenarios.
Climate Resiliency across Enbridge Business Segments
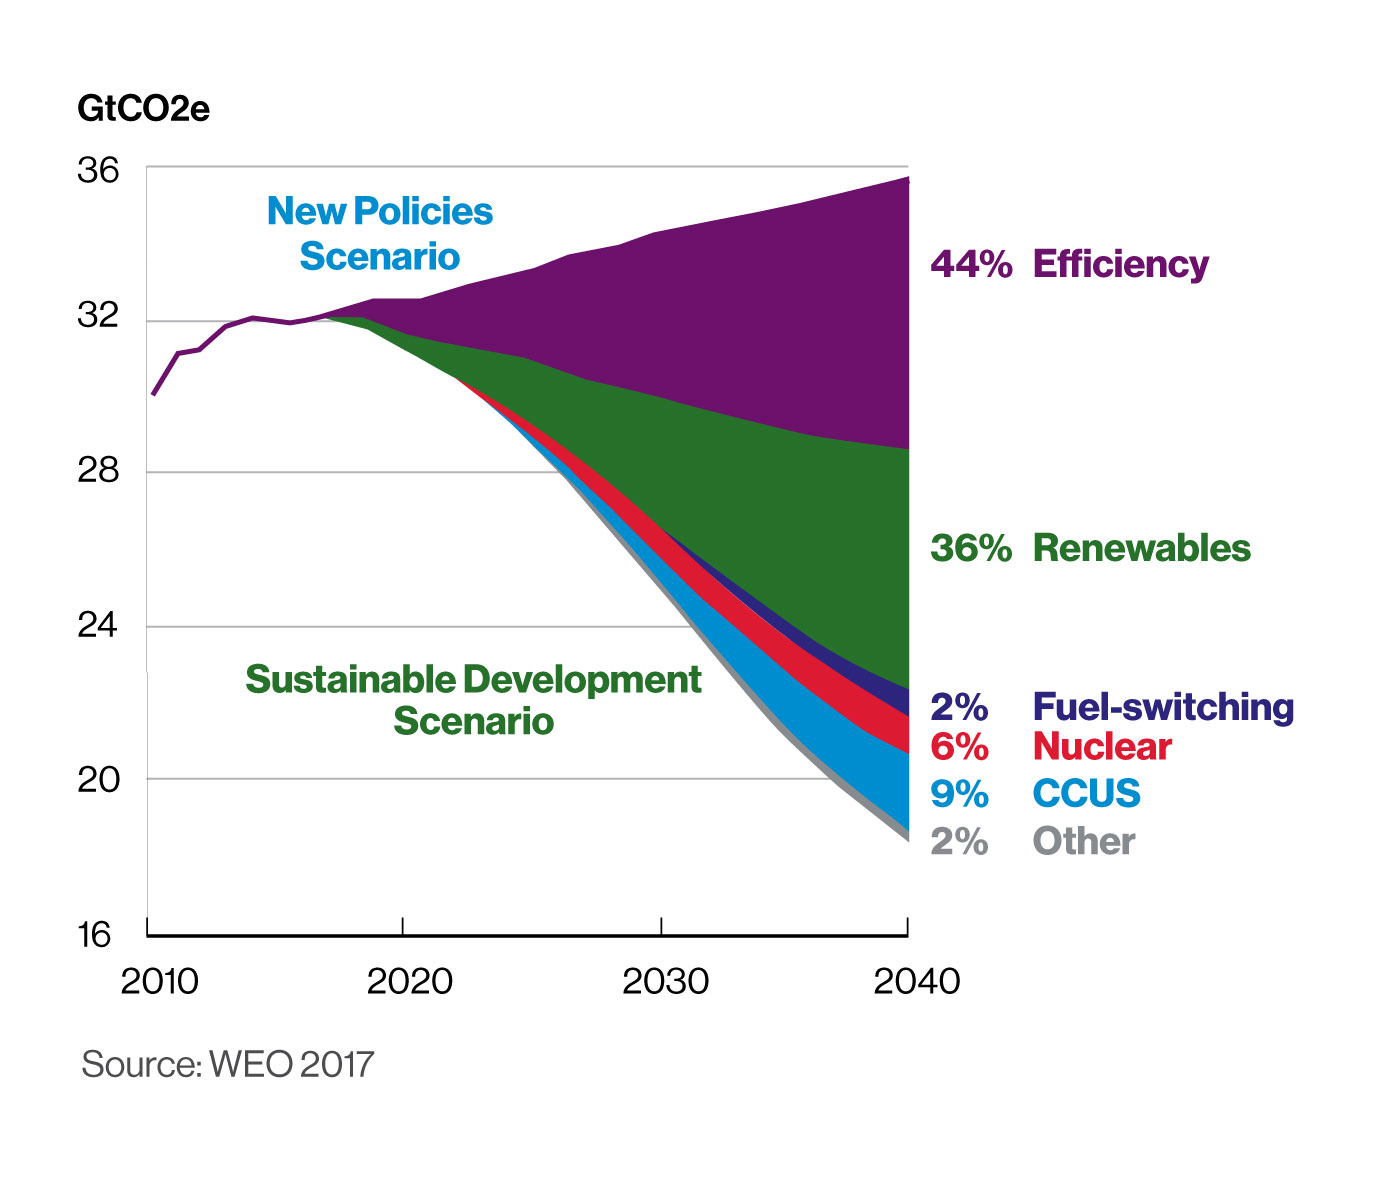
Global CO2 Emission Reductions in the NPS and SDS
Climate change impacts each of our business units differently. This section takes a closer look at each of our business units—LP, GTM, and GDS—through the lens of the IEA’s NPS and SDS.
We chose the IEA scenarios to develop our assumptions because—while they are not perfect—they are widely recognized, transparent and comparable across our sector. We find the scenarios to be useful tools for exploring different futures arising across complex energy systems.
At Enbridge, we use the NPS and SDS in our strategic planning process. Our base case is grounded in the NPS and we use the SDS to stress test our assets against a lower-probability, higher-consequence set of assumptions which would give rise to a more rapid transition to a lower-emission energy base while also accelerating a transition in our business mix.
The SDS is fully aligned with the Paris Agreement's goal of holding the increase in global average temperature to well below 2°C above pre-industrial levels and pursuing efforts to limit the temperature increase to 1.5°C.
In the NPS, total energy-related emissions rise 10% to almost 36 gigatonnes of carbon dioxide equivalent (GtCO2e) in 2040. In the SDS, total energy-related emissions are reduced by more than 45% to 17.6 GtCO2e by 2040. The chart above shows that the biggest differences between the two scenarios relate to the pace of adoption of energy efficiency, renewable energy and carbon capture, utilization and sequestration (CCUS) technologies.
Liquids Pipelines (LP)
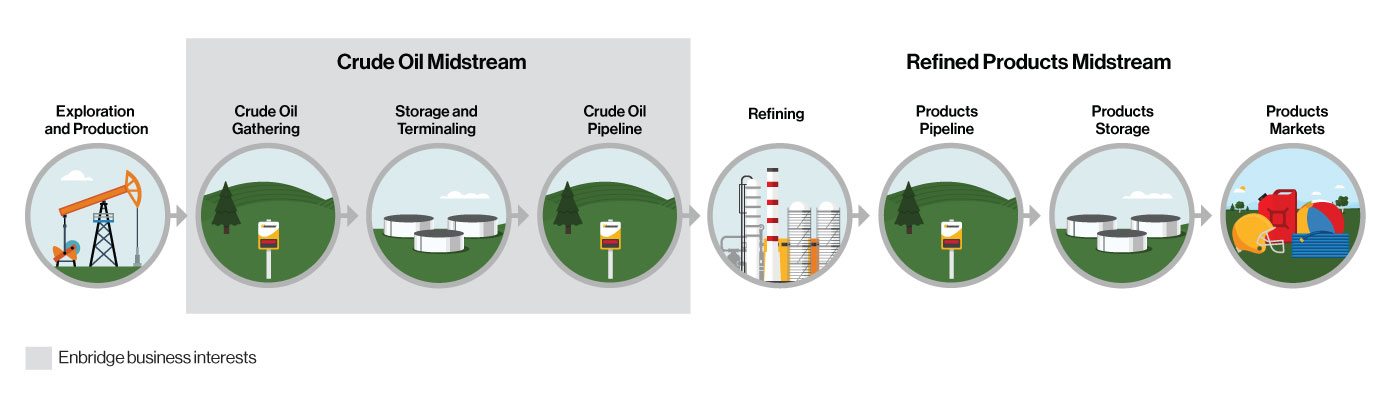
Enbridge operates the world’s longest and most complex crude oil and liquids transportation system. We move approximately 25% of North American crude oil supply. Our Mainline System alone has an operating capacity of 2.785 million barrels per day (MMb/d), including small amounts of NGL and refined product.
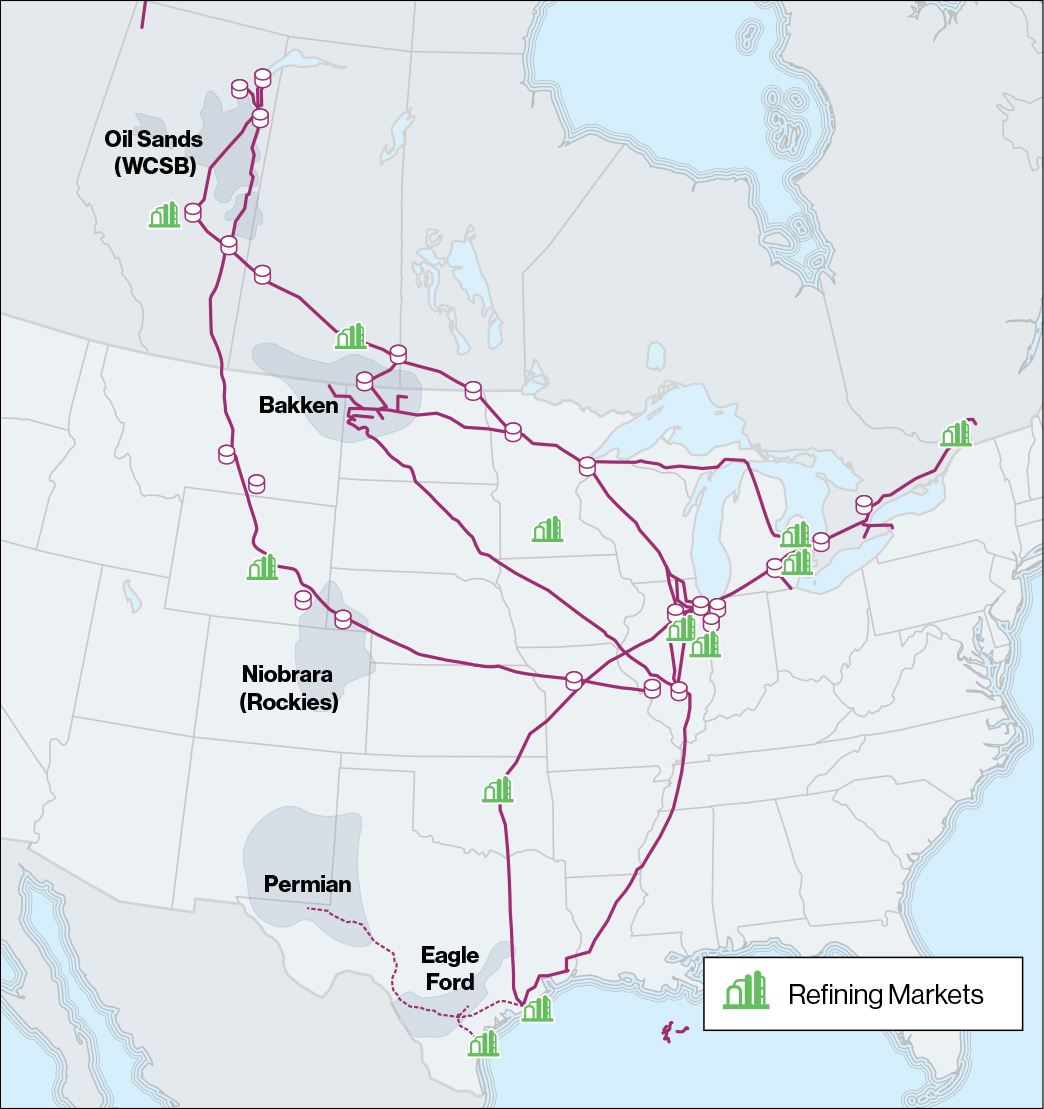
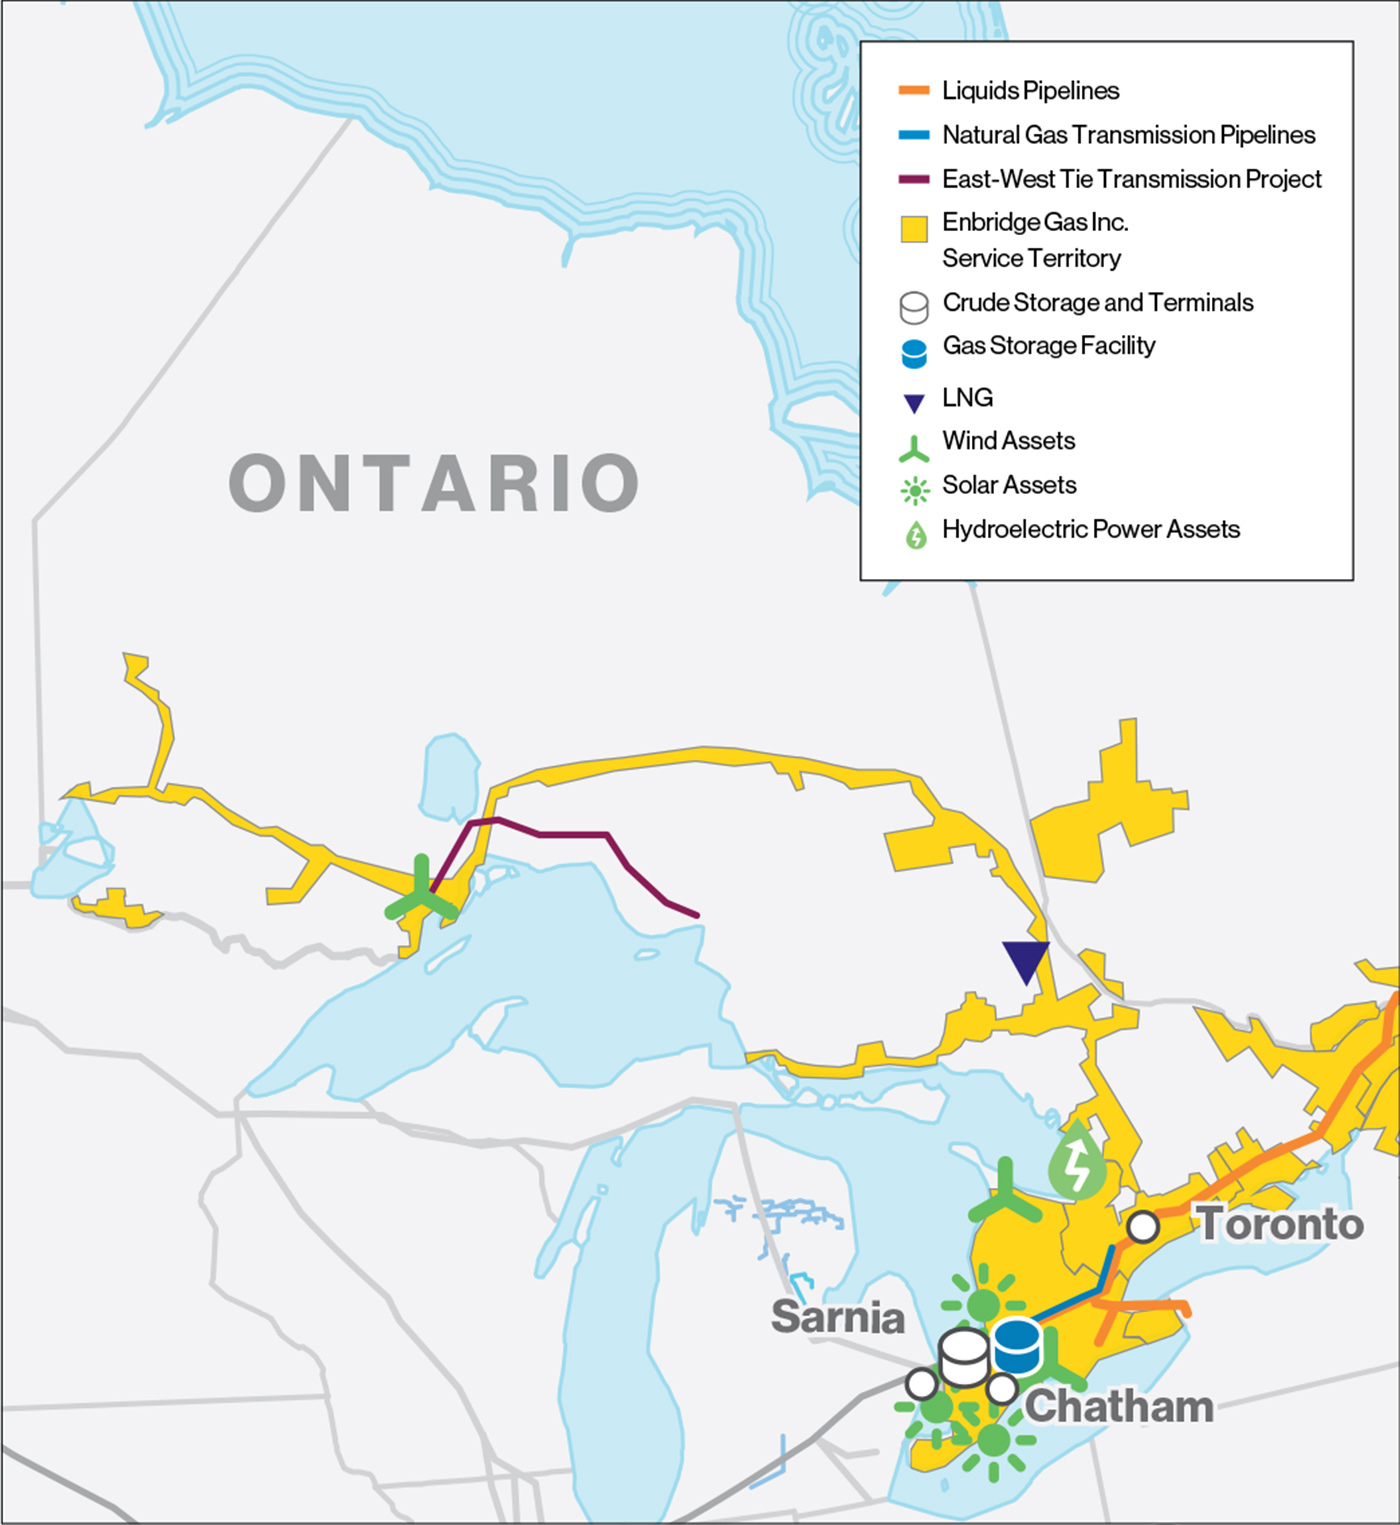
Enbridge liquids pipeline assets primarily transport crude oil from supply sources to oil refineries for conversion into valuable products including gasoline, diesel and aviation fuel. LP assets are connected to the Western Canadian Sedimentary Basin (WCSB), the Bakken formation (Bakken), the Permian and Eagle Ford Basins, and other producing regions. Our LP assets deliver crude oil to refineries in Western Canada, Eastern Canada, PADD IV (Rocky Mountains), PADD II (U.S. Midwest), and PADD III (U.S. Gulf Coast or USGC), and to the increasingly important export market. The following map provides a snapshot of our LP assets, and illustrates the scale and connectivity that underpin the long-term competitiveness of our asset base.
Scenario Analysis
The NPS and the SDS both show oil’s share of global energy demand falling by 2040. The NPS shows the percentage of oil in the global energy mix falling from 32% to 28% between 2017 and 2040. Yet, the aggregate demand for oil increases under the NPS by 12% or approximately 11.5 MMb/d between 2017 and 2040. The SDS has oil's share of global energy falling from 32% to 23% over the same time period. Similarly, the NPS has oil's share of North American demand falling from 37% to 32% between 2017 and 2040, while the SDS has it falling to as low as 25%.
Global Oil-Based Transportation Fuel Demand
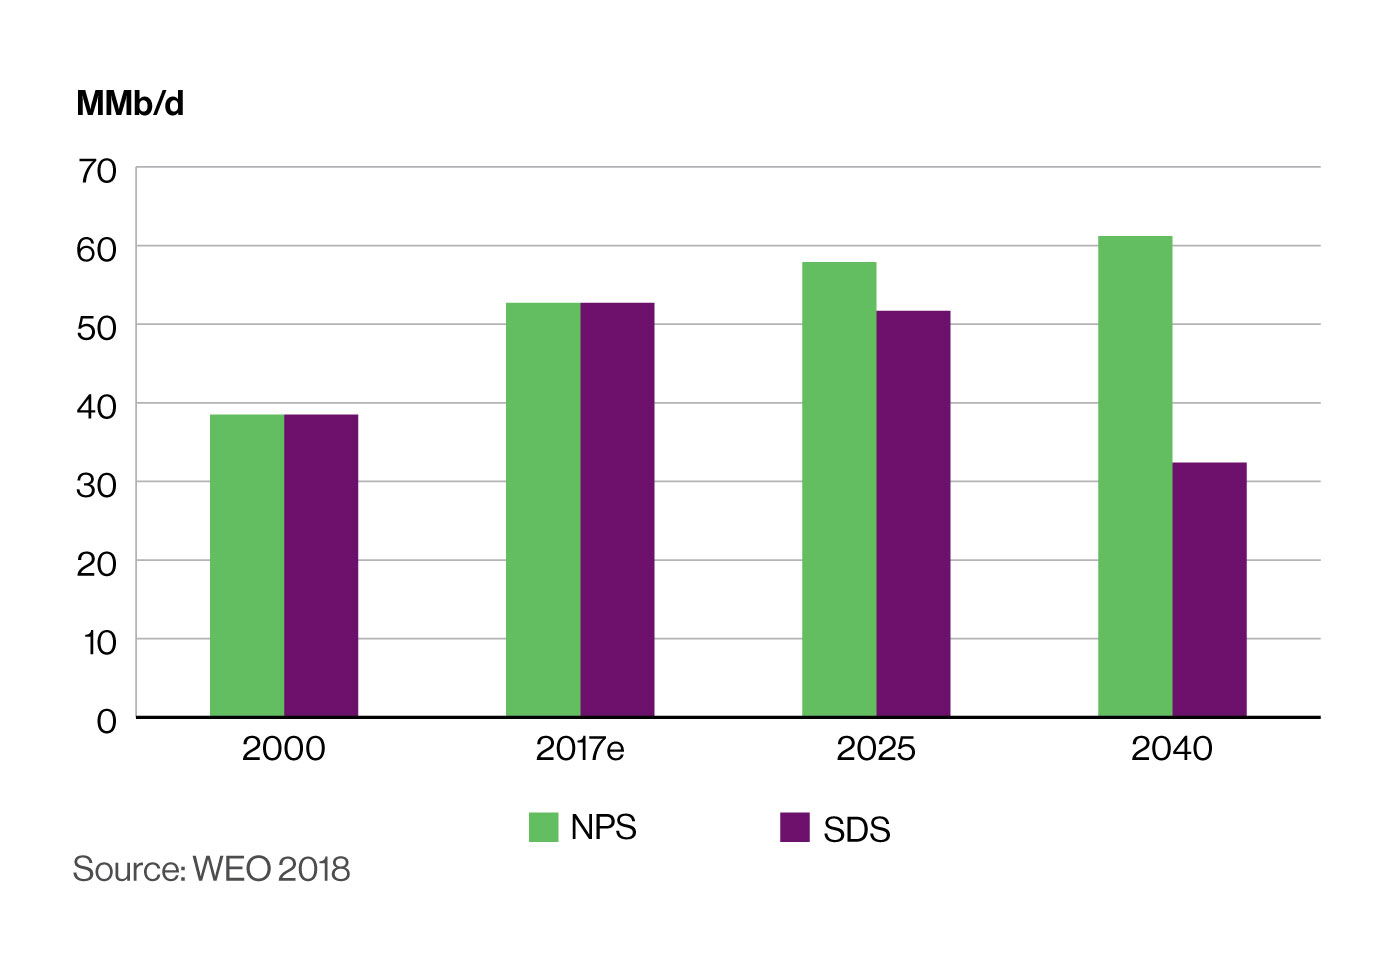
While global oil demand projections are relevant to set a broader context, the most important energy market projections for our LP business relate specifically to transportation fuel (gasoline, diesel and jet fuel), which represents approximately 70% of a barrel of crude oil in North America and more than 85% globally. IEA scenarios suggest that fuel efficiency, electrification of the passenger vehicle fleet, enforcement of policies restricting fossil fuel consumption and penetration of alternative fuels in long-haul trucking will determine future demand for transportation fuels.
While the NPS forecasts growth in oil-based transportation fuel demand—growing from 50 MMb/d to 60 MMb/d by 2040—the SDS forecasts that transportation fuel demand declines to just over 30 MMb/d by 2040.
Given that oil-based transportation fuel demand grows under the NPS, most North American refineries are not under significant pressure under this scenario. Yet, as demand declines under the SDS, less oil supply is required and more refining capacity becomes underutilized or uncompetitive. The relevant question is whether Enbridge’s assets remain resilient under the SDS.
Oil market participants are diverse and take a wide array of positions when making decisions about their assets, basin-level competiveness and refinery competitiveness. Enbridge employs a cost curve competitiveness analysis as a proxy to assess its assets, customers’ businesses and overall business model for both crude oil supply (basin level competitiveness) and refinery demand (refinery cost to manufacture products) under the SDS.
Crude Oil Supply
The oil market is a global market. Generally speaking, in a highly competitive environment such as that described in the IEA SDS, low-cost producers are the most competitive, profitable and sustainable. In terms of crude oil supply, Saudi Arabia and other Organization of the Petroleum Exporting Countries (OPEC) members tend to have the lowest cost to produce crude oil. Among non-OPEC producers, U.S. tight oil and Canadian oil sands have emerged as important sources of global oil supply. However, both are higher-cost, marginal sources of supply and are therefore at risk of lower production. This leaves pipelines that are connected to these basins potentially exposed to elevated volume risk in a scenario where absolute demand is falling.
Enbridge is among the largest pipeline companies serving the Canadian oil sands and is a major player serving Bakken producers. We also have a growing presence serving the Permian Basin in Texas. While lower global oil demand presents risk to supply from these basins, it is important to note that these basins have some key advantages.
Crude Oil Supply by Type
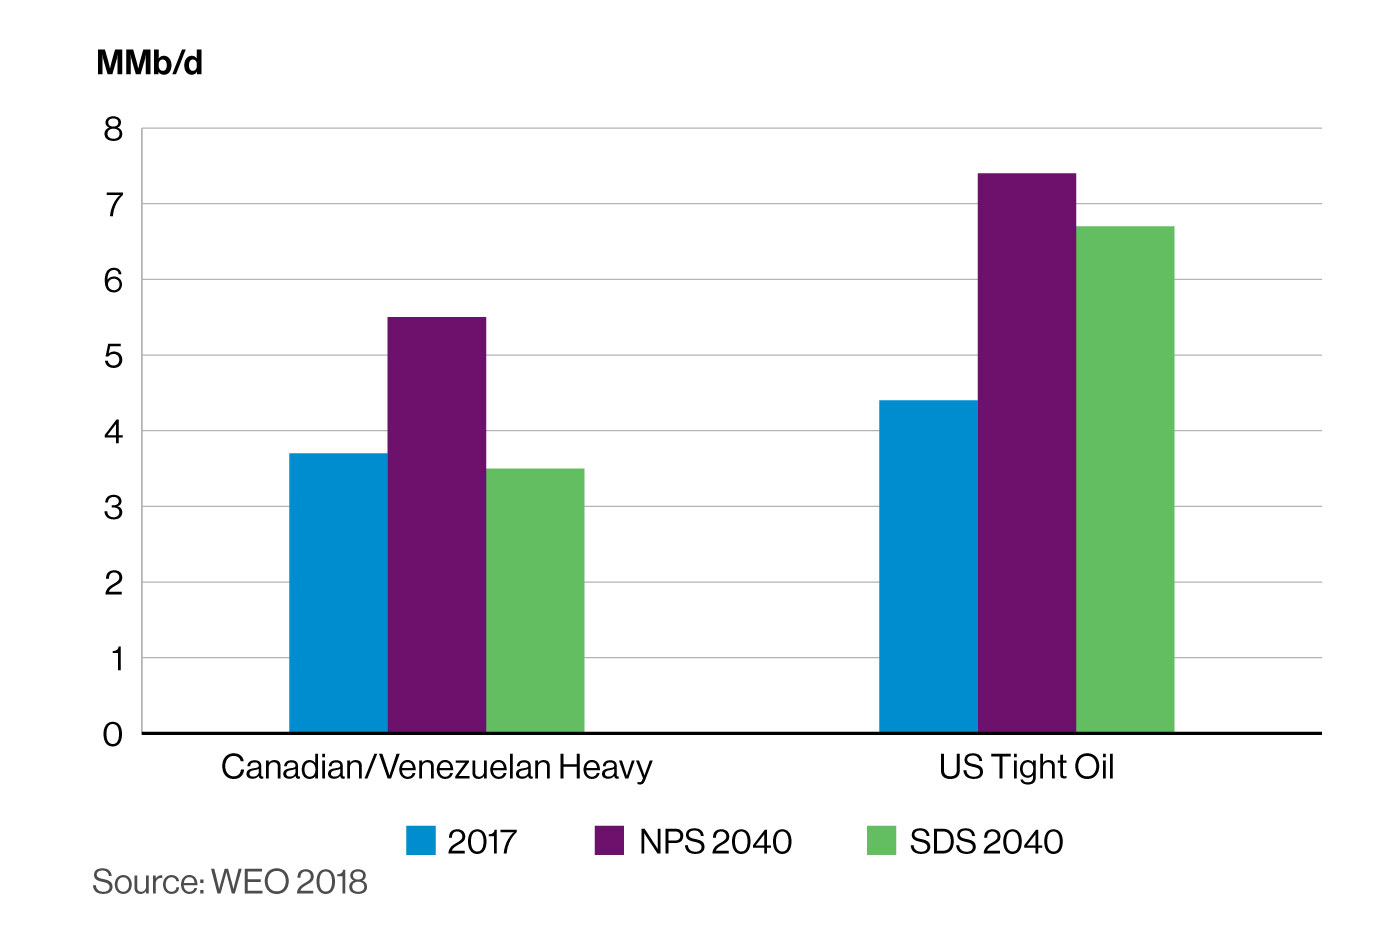
Oil sands production tends to be long-lived in nature with very little decline (unlike conventional basins that naturally decline approximately 20% per year absent investment).1 Oil sands projects offer security of supply. They are also very resilient once they are built, as oil prices would have to fall below the combined cost of sustaining capital and operating costs to shut in existing oil sands production. In 2017, for example, IHS Markit estimates that most oil sands (both mining and in situ) operations needed a WTI oil price of $30 to $40/bbl to cover the cost of operating, sustaining and marketing the bitumen produced.2 The IEA’s 2040 oil price is projected to be $64/bbl for Brent crude—a price that supports the view that existing and under-construction oil sands production should continue into the future. Moreover, oil sands production is also expected to remain relevant into the future because USGC refineries—the most complex and lowest-cost refineries in the world—are configured to take heavy oil.
U.S. tight oil will continue to play an important role in meeting global oil demand even under the SDS, as can be seen in the chart above. U.S. tight oil is expected to grow and then dip just below 7 MMb/d under the SDS scenario. Permian, Bakken and other tight oil basins will continue to attract investment given competitive economics and the short-cycle nature of production.
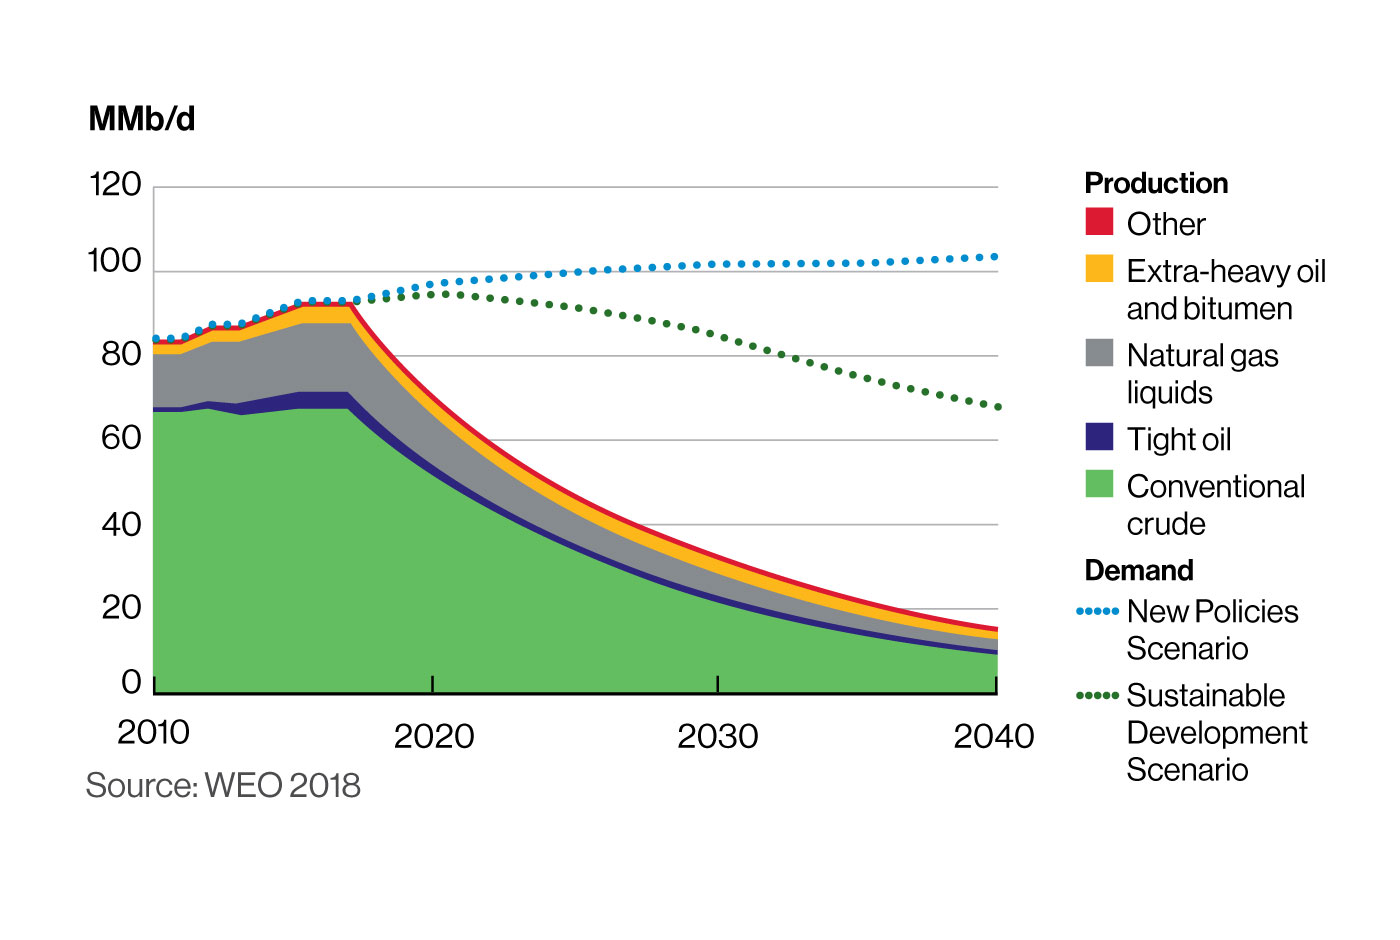
The SDS forecasts flat production of extra-heavy oil and bitumen (Canadian Oil Sands and Venezuelan Orinoco), declining conventional oil and growth in tight oil. Extra-heavy oil and bitumen and tight oil remain important sources of supply in the SDS by 2040 suggesting oil sands and tight oil basins remain productive and reserves are developed.
Oil Production with No New Investment from 2018
Geo-political risk can and will continue to impact the demand for Canadian oil—this is exemplified by the impact of political turmoil in Venezuela on oil markets in 2019. The implication is that oil sands product will meet a larger share of heavy oil demand as Venezuelan and OPEC investment in heavy oil continues to diminish. This should provide Enbridge with a fairly stable source of supply, particularly under the SDS. That said, with less oil supply needed to meet demand, it’s possible that volume risk to Enbridge assets may increase and our cash flow may be impacted in the longer term. Much of this risk is mitigated through our direct connection to the most competitive refineries, our low per-barrel transportation cost and effective commercial agreements.
1 http://www.oilsandsmagazine.com/technical/properties
2 IHS Markit, Scenarios of Future Growth (December 2017).
Crude Oil Demand
As part of Enbridge’s annual strategic planning process, we regularly examine oil market fundamentals and identify changing trends in global energy markets. Enbridge is actively pursuing growth and diversification opportunities among the most resilient demand pull markets while maintaining superior service to current customers in existing basins and markets. We believe that North American crude oil and refined products will continue to be cost competitive and exported from the USGC region to global markets over the long term and in growing quantities.
Enbridge connects low-cost Western Canadian heavy crude to some of the most complex, competitive and profitable refineries in the Midwest and USGC. In turn, these refineries make refined products that are consumed both continentally and globally. Access to low-cost inputs of both crude oil and natural gas allows these refineries to compete effectively both at home and abroad. The cost competitiveness of North American resources ensures that tight oil and oil sands continue to be produced in larger quantities. It also ensures that U.S. refineries in Enbridge’s core and extended markets will continue to run and produce refined products while enjoying a feedstock cost advantage versus other global refineries.
We expect North American refineries to remain well-positioned to compete globally as long as the North American feedstock cost advantage persists. There is further advantage in the fact that many refineries in Enbridge’s core markets possess coking capacity to convert heavier portions of the barrel into highervalue light products. Refineries in the PADD IV (Rocky Mountains), Eastern PADD II (Midwest) and Eastern Canada are also able to convert heavy portions of the barrel into high-value products. All of this sustains Enbridge’s value proposition into the future as our LP infrastructure is expected to be both used and useful.
The export market has supported high refinery runs for USGC refineries and Enbridge expects that to continue. Depending on the decline in gasoline demand as a result of electric vehicles (EVs) and fuel efficiency gains, however, Enbridge anticipates some pressure on North American refinery capacity. The pressure would be most evident in PADD I (East Coast) and PADD V (West Coast) where crude feedstock costs are high and refinery complexity is low compared with Enbridge core market refineries (including PADD II and PADD III). If some refining capacity is eliminated, as the SDS anticipates, it would likely be capacity in PADD I and PADD V.
Some refinery capacity in Enbridge’s core market may be at risk but it would be smaller-scale, light cracking refineries that would be most exposed given competition with coking refineries. Even if refinery capacity in Enbridge’s core market were to close, crude oil that would have been destined for those facilities could be redirected further south to USGC refineries on the Enbridge system, resulting in a longer-haul movement on our pipelines and increased opportunities for investment in Texas and other Gulf Coast states.
Enbridge has an established and successful history as the largest transporter of crude oil to the U.S.—the world's largest crude oil market. This, along with our enhanced capability to export North American crude to global markets, significantly mitigates volume risk on our crude oil pipes. As a regulated pipeline that does not own the commodity being shipped, risk is mitigated. Moreover, most of Enbridge's customers are large, financially strong entities. Customers can help to mitigate risk—for themselves and for midstream companies—by further reducing costs, managing climate risks appropriately and effectively reducing emissions.
Meanwhile, the strength of North American tight oil production increasingly results in surplus light oil supplies, which are being exported to meet global demand. While oil markets are tightening in developed economies like North America and Europe, oil demand is growing rapidly in other parts of the world. For example, oil demand in India is expected to almost double by 2040 under the NPS, while it would also grow under the SDS. Despite shifting supply and demand dynamics, it remains important to connect abundant, low-cost supply with growing global markets. Enbridge’s core assets are strategically located to do so.
Natural Gas Trasmission and Midstream (GTM)
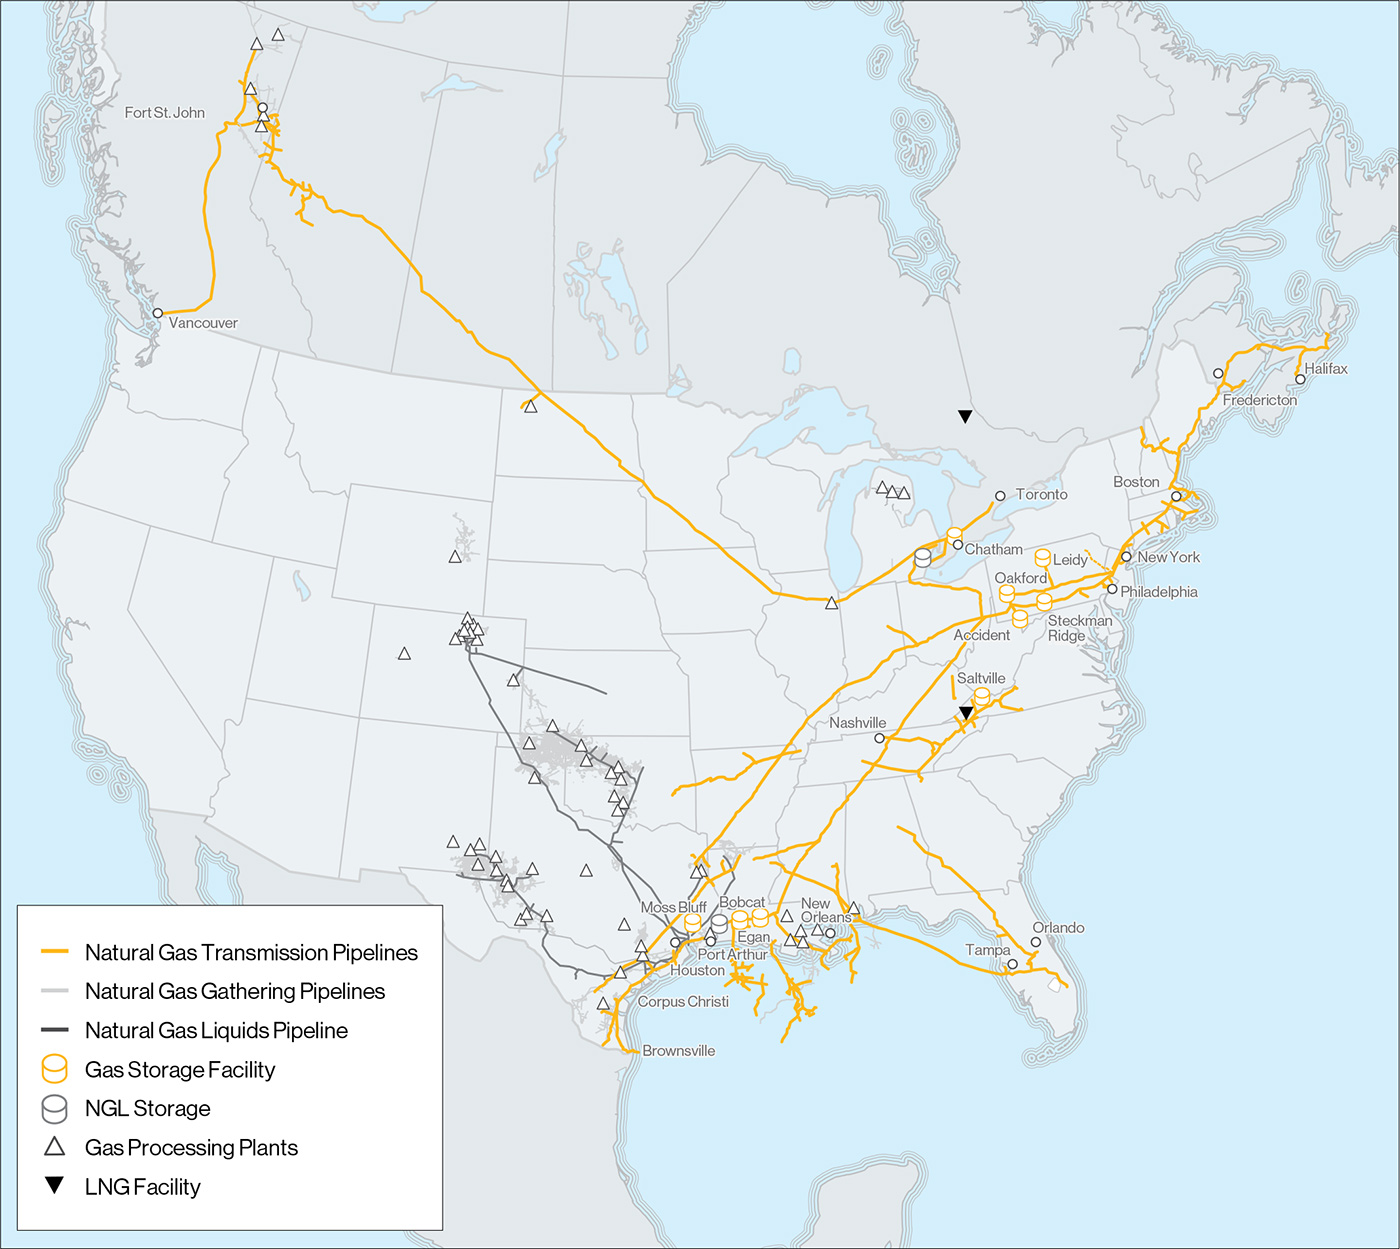
Enbridge transports about 20% of all natural gas consumed in the United States. Our GTM assets move approximately 19.4 billion cubic feet (Bcf) of natural gas each day and we have interests in approximately 160 Bcf of working natural gas storage. We connect North America’s most prolific supply basins to major demand centers.
Value Chain
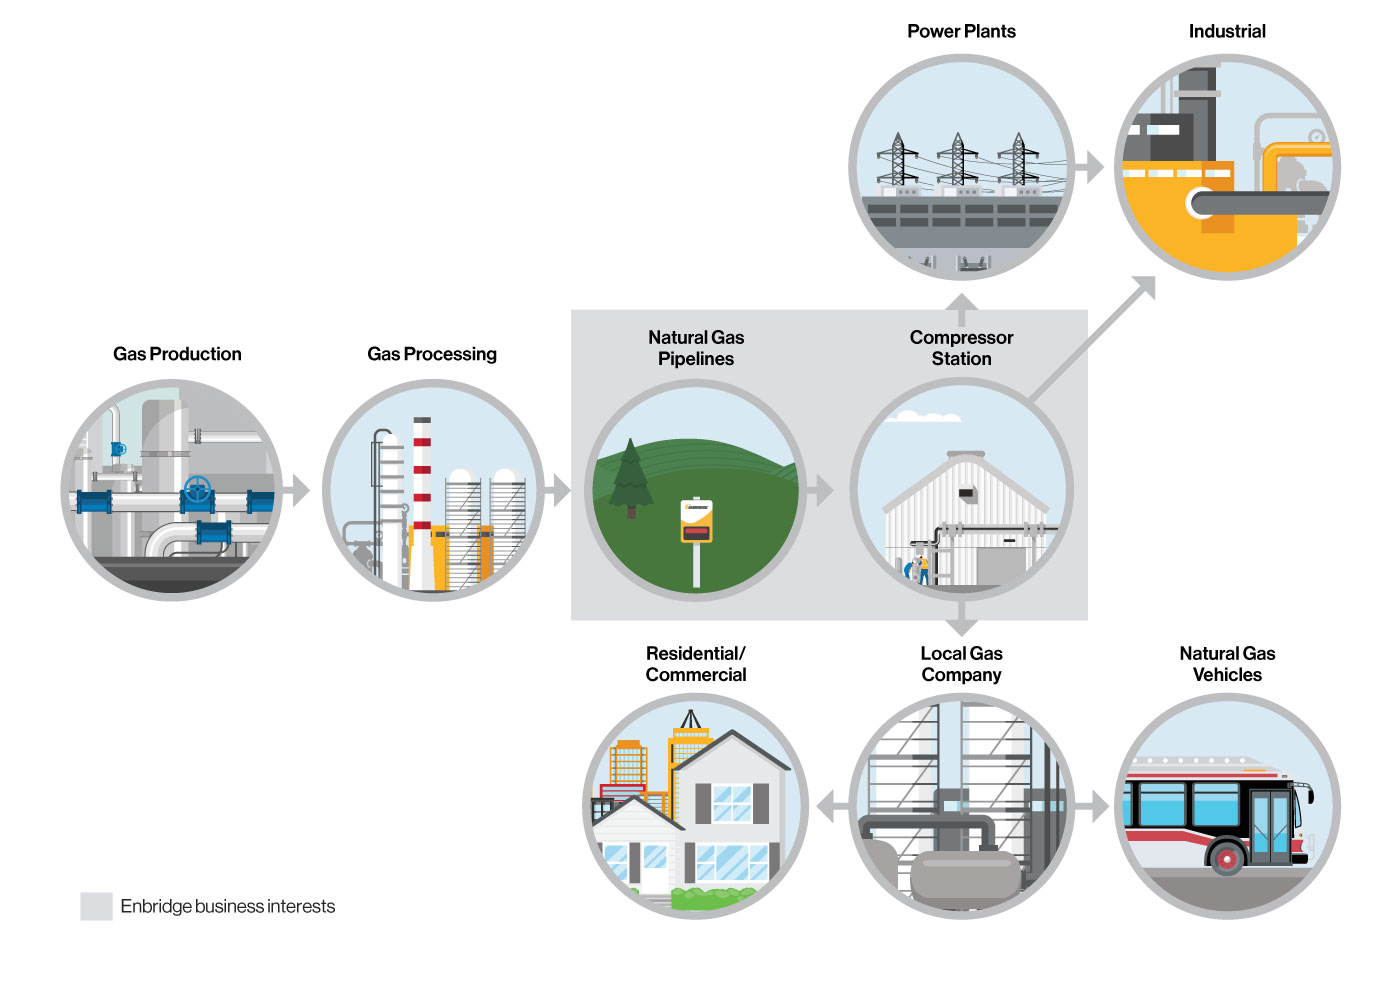
In February 2017, we repositioned our Company for a lower carbon economy with the $37-billion acquisition of Spectra Energy. As described on Page 16, this acquisition dramatically increased the proportion of our portfolio focused on natural gas—from 27% to 54% of net assets—which reduced the liquids share of our portfolio from about 66% to 43%.
Our GTM assets cover approximately 26,000 miles (41,800 kilometers (km)) in 31 U.S. states, five Canadian provinces and offshore in the Gulf of Mexico, and provide major North American population centers with access to critical supply basins and are strategically located to meet growing demand domestically and internationally.
Scenario Analysis
IEA Natural Gas Demand Outlook: New Policies Scenario
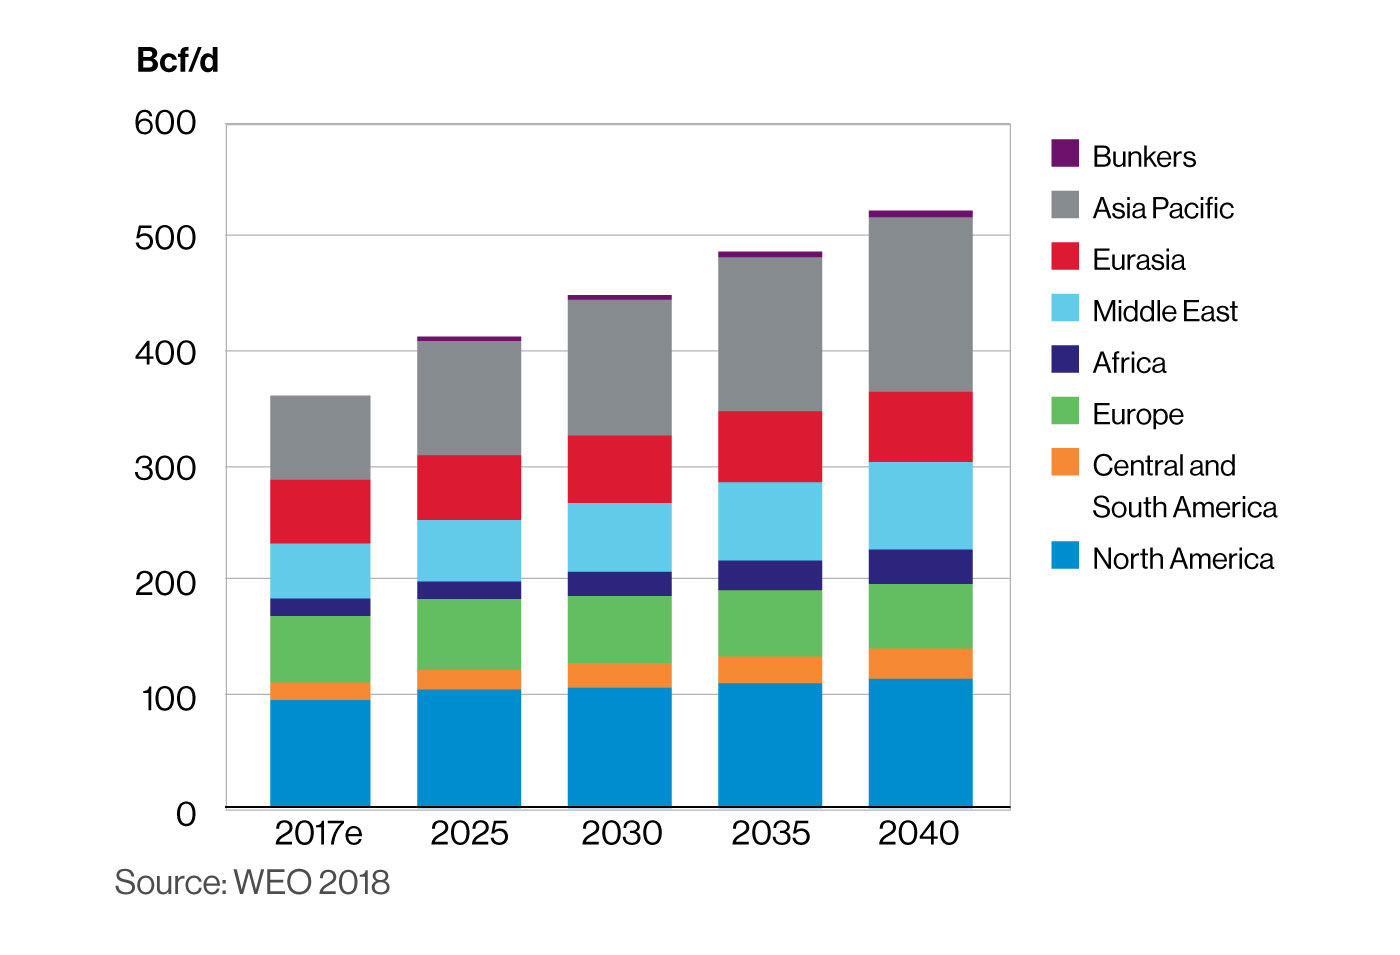
Natural gas currently meets approximately 22% of global energy demand. Both the NPS and the SDS project that global demand for natural gas will increase through 2040.
The NPS predicts an increase in global gas demand of approximately 45% by 2040 as gas demand grows in most parts of the world. Two-thirds of this growth comes from developing economies in Asia (grows by 78 Bcf/d) and the Middle East (grows by 28 Bcf/d). As China seeks to combat air pollution, it alone accounts for nearly 30% of total natural gas demand growth to 2040. Demand also grows in North America—by almost 20 Bcf/d.
In recent years, North America has capitalized on natural gas to replace significant amounts of coal-fired power generation, while expanding petrochemical production. According to the U.S. Energy Information Agency, 30% of power in the U.S. in 2017 was generated from gas-fired power plants, a 10% increase over 2007. During the same period, the proportion of coal-fired power diminished considerably, from 50% in 2007 to 31% in 2017. As this shift occurred, U.S. carbon emissions fell to levels last seen in the 1990s. Our gas infrastructure has played a prominent role in this development.
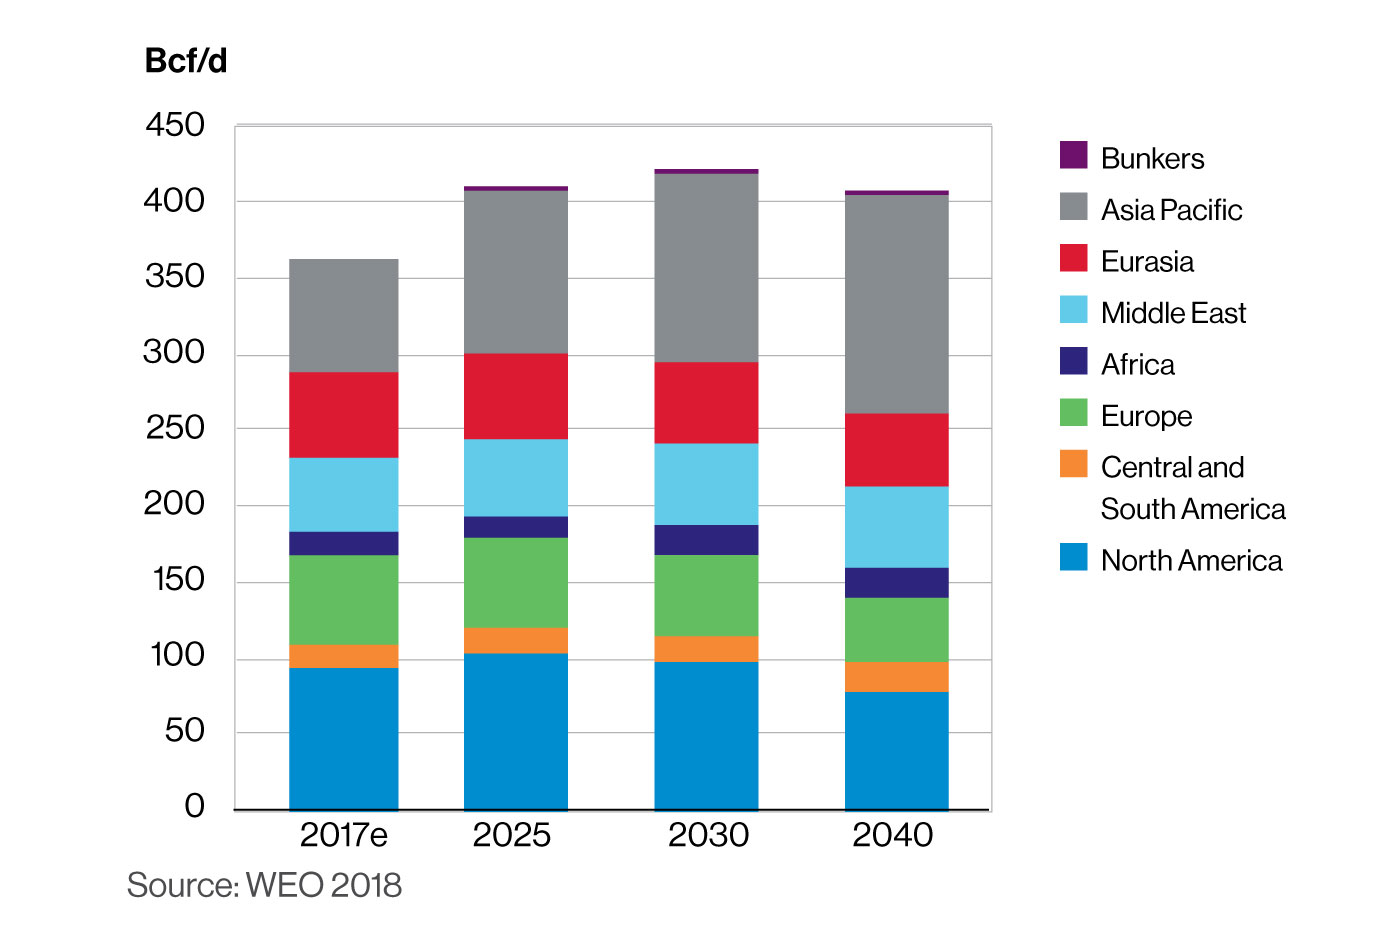
IEA Natural Gas Demand Outlook: Sustainable Development Scenario
Nearly all of our U.S. gas transmission systems were designed to transport natural gas from prolific supply basins in the Gulf Coast to under-served market demand in the U.S. Northeast. Over the past decade, natural gas supply and demand dynamics in North America have changed dramatically. Through a series of expansions and reversals on our core systems, the execution of greenfield projects and strategic acquisitions, we have been able to meet the growing and changing needs of consumers and producers alike. Over that period, we have placed approximately $15 billion of natural gas growth projects into service. In 2018 alone, we approved 11 new gas transmission projects. Our asset base is now strategically placed to transport diverse supply to the Northeast, Southeast, Midwest and Gulf Coast markets on a fully subscribed and highly utilized basis.
Yet, even under a North American growth scenario, North American suppliers are shifting focus to global gas markets. North American exports are expected to play a significant part in meeting global demand, underscoring the ability of our assets to remain highly utilized by shippers.
The SDS underscores the importance of shifting focus to global natural gas markets; it forecasts global gas demand growth of approximately 10% by 2025 and then is essentially flat to 2040 (with strong regional variations). Asia remains a strong source of demand growth through 2040 as natural gas and renewables combine to displace more carbon intensive fuels. In fact, the SDS foresees a larger role for natural gas in some markets than is envisioned under the NPS: The share of the natural gas mix rises to almost 20% in China and 16% in India by 2040 under the SDS, compared with 14% and 8% under the NPS. Under this scenario, many advanced economies—like North America and Europe—see gas demand falling due to energy efficiency policies and the expansion of renewable energy. In North America, natural gas demand increases through 2025 and then drops 15% by 2040.
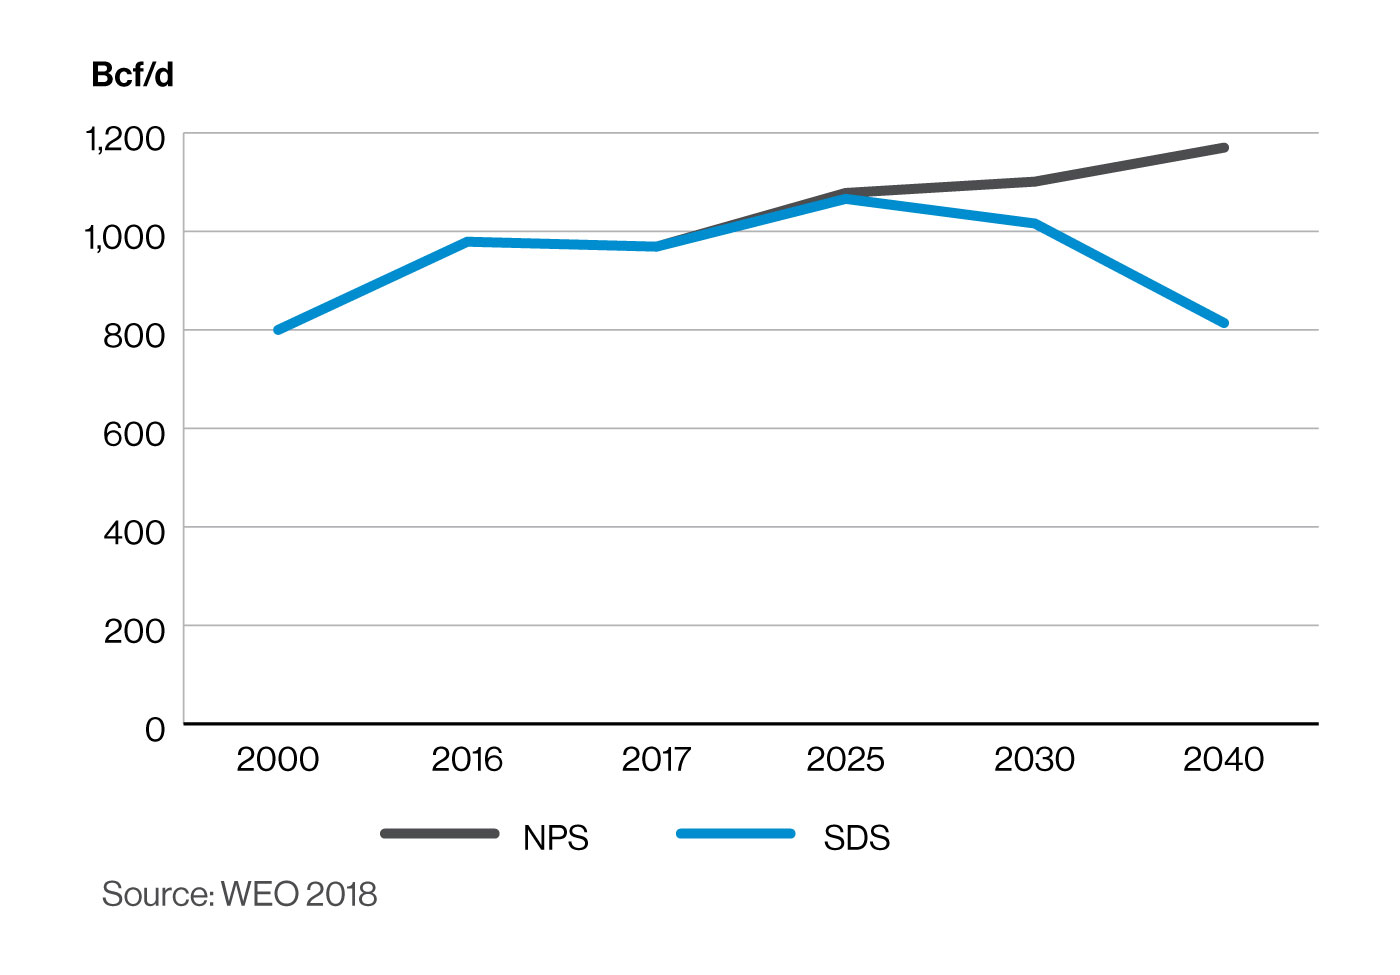
North American Natural Gas Demand
North America is expected to be a major player in supplying global gas markets. New U.S. LNG export plants have already started to change global gas dynamics. Enbridge’s system is very well positioned for both supply push from areas like the Permian, Marcellus and Western Canada, and demand pull from growing markets in the U.S. Northeast, Southeast and Gulf Coast.
The North American center of growth is in the USGC, where petrochemical facilities, power generation, LNG and exports to Mexico are driving demand. Enbridge is well-positioned to benefit with our Valley Crossing Pipeline and our Texas Eastern Transmission system, which follows the coast from South Texas to Louisiana. These pipelines draw from multiple basins including the Permian, East Texas, and the Marcellus—through our bidirectional Texas Eastern system. We supply gas to Sabine LNG today and we are interconnected to Cameron LNG and Freeport LNG, which are expected to start up this year. Additionally, our network is well situated to serve multiple new projects currently under development in the USGC.
We also see opportunity on Canada’s West Coast. The October 2018 decision to move forward with LNG Canada, Royal Dutch Shell’s large-scale project on Canada’s West Coast, means Canada will become a large-scale exporter in what could be the first of several new LNG projects in British Columbia (BC).
LNG export from BC is anticipated to create uplift in natural gas supply prices within the WCSB. In recent years, WCSB prices have been very low—or even negative—due to local supply exceeding local demand, and competitive supply alternatives available to other demand centers in North America. Enbridge is well-positioned to deliver growing WCSB supply for new LNG projects on Canada's West Coast.
BC LNG also has the potential to have the lowest carbon intensity globally. BC is the only jurisdiction in the world to mandate a LNG emissions benchmark. This means all BC facilities must meet or beat a standard of 0.16 tonnes of carbon dioxide equivalent (tCO2e) per tonne of LNG—a mark that is lower than recent plants coming online in other jurisdictions. Canada’s commitment to reduce methane emissions from gas production (40 to 45% below 2012 levels by 2025) puts Canada in a strong leadership position on LNG emissions.
Mexican energy reforms have opened new opportunities to supply natural gas via newly built pipelines from the U.S. to Mexico. Enbridge’s Valley Crossing Pipeline—a 168-mile pipeline delivering 2.6 Bcf/day—provides market access for Haynesville, Permian and other supply sources to Mexican utilities which serve approximately 37 million customers. Valley Crossing will have a meaningful impact on GHG emissions in Mexico, largely due to the displacement of fuel oil in Mexico’s electricity generation.
Japan is expected to be the largest LNG importer, but it is China and other developing Asian markets that are expected to be the primary drivers of LNG demand growth—Asian markets reach 80% of global LNG imports by 2040. The IEA makes it clear that without new investment, growing offshore demand for LNG could result in a tight market as early as 2023. Because projects have long lead times, investment decisions need to be made soon to ensure adequate supply through the 2020s. Enbridge is well-positioned in multiple regions to support this incremental growth.
Given Enbridge’s strategic location between highly competitive supply basins and demand-pull markets—both domestic and offshore—we are confident that our assets will remain used and useful under both the NPS and the SDS.
Mitigating Risk from Methane Emissions
Both IEA scenarios rely heavily on replacing coal with natural gas and renewables. But the IEA has warned that the climate benefits of natural gas will not be fully realized unless methane emissions are tackled.
Methane emissions are regulated in Canada and the U.S. The Canadian federal government has set a target of reducing methane emissions by 40 to 45% below 2012 levels by 2025 and some provinces are establishing their own plans to align with the federal approach. In the U.S., some states are establishing their own frameworks for methane reduction. All of our natural gas transmission assets in the U.S. participate in voluntary programs to promote best management practices on methane reduction. These include the Interstate Natural Gas Association of America’s Methane Emissions Commitments andthe Environmental Protection Agency’s Natural Gas STAR Program. In 2018, Enbridge’s U.S.-based GTM business reported methane savings of 3.1 million cubic feet as a result of operational and maintenance measures that improved efficiency.
Methane Reduction Strategies and Protocols
We are reducing methane emissions and conserving marketable methane while improving the safety, reliability and efficiency of our operations. Our programs, protocols and initiatives for integrity management, damage avoidance, maintenance of system fitness and leak detection are central to methane reduction. Processes to detect methane leaks include the use of Optical Gas Imaging (OGI) cameras, handheld “sniffer” gas detectors, infrared cameras, Audio Visual and Olfactory (AVO) inspections, right-of-way surveillance and air patrols on transmission pipelines. We conduct frequent leak detection surveys in accordance with leading industry best practices. Our GDS business has developed a leak management program that uses new technology for optical imaging, and portable flow sampling and data collection, for improved tracking and management.
Our GTM business has a comprehensive set of standard operating procedures that address methane leakage and venting within its transmission pipeline systems. Specific to GTM’s compressor stations and metering and regulator stations, these protocols are designed to locate and prioritize repairs of methane leaks. Facility methane leakage surveys are conducted inside and outside buildings on all piping and components within the station fence lines that contain natural gas. Inspections are routinely performed as part of operator rounds and technician inspections to identify any leaks or other issues. This operating practice provides timely detection of fugitive emissions and ensures appropriate action is taken.
Gas Distribution and Storage (GDS)
Enbridge also has a significant presence in natural gas distribution and storage in North America. We operate the largest natural gas distribution franchise in Canada, serving 3.7 million customers. Our Dawn Storage Hub assets in southern Ontario connect multiple supply basins with strategic markets and are positioned to serve both growing supply basins and growing end use markets.
As discussed previously, the NPS shows North American natural gas consumption growing by nearly 20% through 2040. By contrast, the SDS shows North American gas demand increasing through 2025 before dropping by approximately 15% by 2040. What really matters for our GDS business is where demand growth is expected to occur.
Enbridge GDS Profile
Under the NPS, North American natural gas demand growth is expected to continue to see low annual growth over the long term with continued growth in peak day demand. In Ontario, natural gas enjoys a price advantage over electricity. This will continue to drive significant growth with specific interest coming from communities that are not currently served by natural gas.
In Eastern Canada, we are adding 50,000 customers each year and deploying capital in excess of $1 billion annually to maintain and grow our GDS assets and services. We see continued growth over the medium term given the growing energy needs of Ontario, the cost competitiveness of natural gas and growing supply partially enabled by our Dawn Storage Hub and Parkway transmission assets. Yet, due to the current grid makeup in Ontario (which has already transitioned from coal-fired power), this rapid pace of natural gas generation growth is not expected to be sustained over the long term.
Under the SDS, Enbridge’s GDS business may see a slowing rate of natural gas growth. This is driven by changes to building codes requiring new homes to be net-zero emissions, increased fuel switching to geothermal and heat pumps, and increased energy conservation that will offset the increases in population growth.
Enbridge recognizes that consumers want more affordable, reliable and lower emissions energy and we are working to mitigate risk associated with certain scenarios that have natural gas demand diminishing in some regions. We also see significant opportunity in diversifying the products and services offered by our GDS business to respond to evolving customer preferences.
Enbridge’s natural gas utility is a recognized leader with significant experience in Demand Side Management in North America. Since 1995, our DSM programs have reduced energy consumption by 30%—this is the equivalent of removing 7 million cars from the road. Customers trust Enbridge to provide them with information and programs to help better manage their energy consumption. For our residential customers, that includes incentives to weatherize homes. For commercial and industrial customers, it may include advice on how their business optimizes use of natural gas in heating and process loads, coupled with rebates for doing so.
In addition to investing in the businesses and infrastructure that are key to a low-carbon economy, Enbridge’s natural gas distribution business is investing in specific technologies that can help accelerate that economy. Examples of these investments include technology that could see existing pipeline infrastructure used to store renewable energy to help address intermittency issues; technology for storage of CO2 in a deep saline aquifer; and next-generation solar power technology that is less costly and has a lower environmental footprint.
Similarly, while increased electrification of energy systems and building new renewable power generation is expected to advance the transition to lower-emission energy, improved management of traditional energy sources and optimization of existing infrastructure will provide significant carbon reductions while also supporting energy affordability. Enbridge’s natural gas distribution business is transitioning customers from higher-emission fuels onto natural gas and pursuing opportunities to reduce emissions through “greening” natural gas supply.
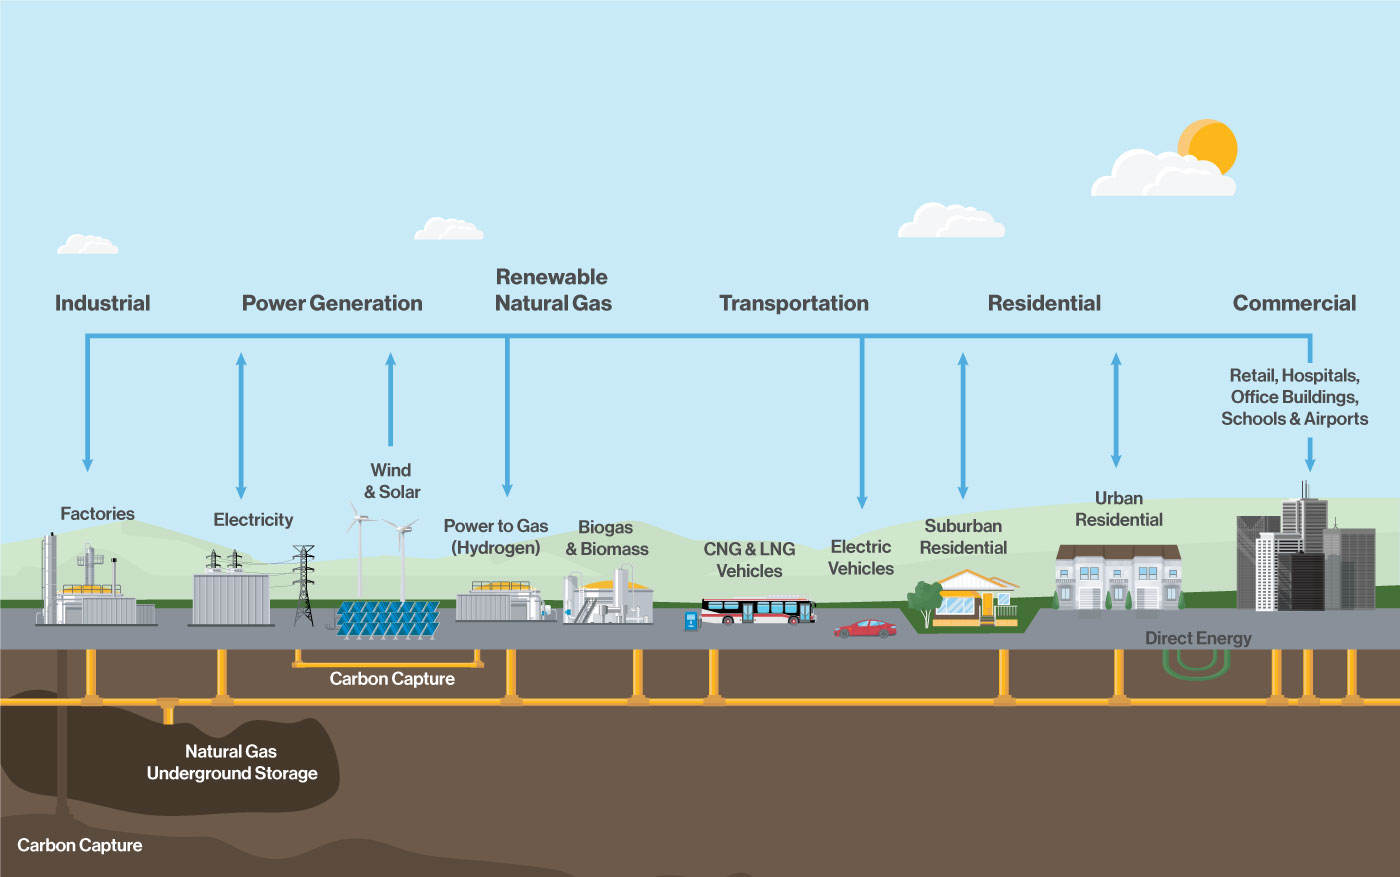
Enbridge is acting on the following opportunities:
- Delivering natural gas to customers who previously didn’t have access, allowing them to switch from higher-emission fuels, while saving money on their energy costs.
- Renewable natural gas is methane produced from the decomposition of organic waste, which can be used in place of traditional natural gas for heat and transportation; it costs less than electricity and reduces the overall carbon intensity of natural gas. RNG can also become a clean source of energy that complements wind and solar. We’ve successfully secured RNG development projects, including the Dufferin project with the City of Toronto, and there are approximately 20 potential projects currently under review.
- Hydrogen, a carbon-free form of energy, has the potential to make a meaningful contribution toward achieving climate goals. Enbridge successfully commissioned the first largescale power-to-gas fuel cell in North America in 2018, a 2.5-MW unit in Markham, Ontario which uses surplus renewable electricity and stores it by converting it to hydrogen. In the future, hydrogen could be used to store energy, refuel vehicles and be injected into the natural gas grid. This would further offset the carbon content of fuel that heats and powers homes and businesses.
- Converting transportation fleets to compressed natural gas (CNG), which has immediate environmental and affordability benefits in the near term, while setting the stage for the transition to carbon-neutral renewable natural gas as a fuel source for fleets such as buses and waste removal trucks as well as heavy haul transportation.
- Investigating solutions and implementing pilot initiatives to assist customers in using less energy. Examples include combined heat and power generation, heat pumps and geothermal systems.
Diversification Toward Lower-Carbon Energy
Total Net Assets, Segmented
(Millions of Dollars at Year End)
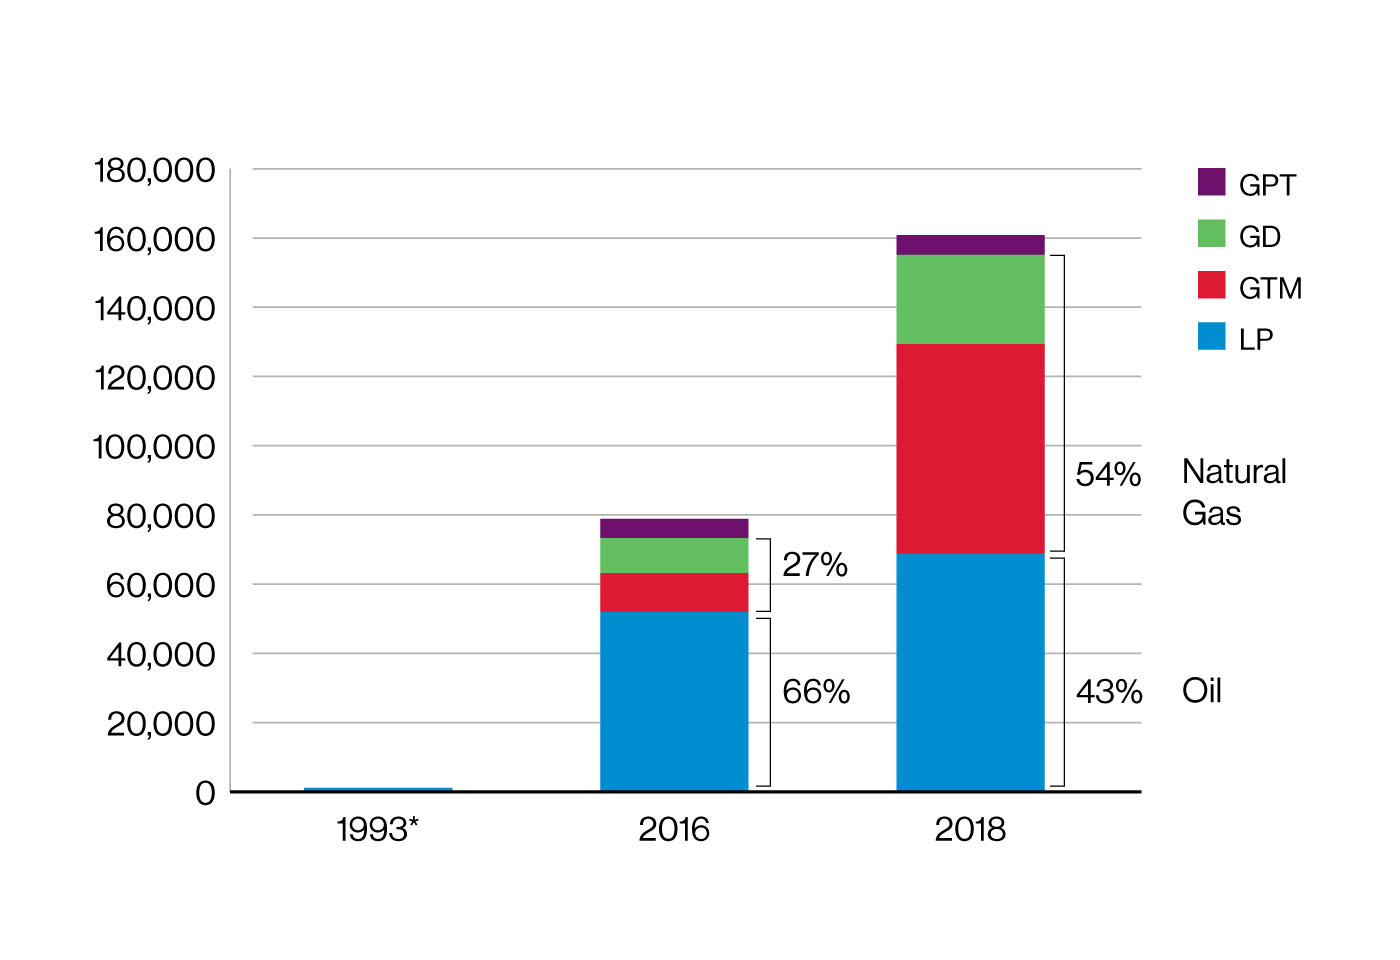
Enbridge’s strategic planning process has consistently revealed opportunity in energy systems change. Over the past two decades, we have diversified our business to reflect shifting market fundamentals while staying ahead of the changing needs and expectations of our customers and stakeholders. Twenty-five years ago, at a time of major oil supply growth, we were a pure oil pipeline business. As we saw the future energy mix changing, we began to successfully diversify our business to natural gas and renewables.
In 2017, we accelerated growth of our gas transmission and gas distribution and storage businesses with the $37-billion acquisition of Spectra Energy. This acquisition grew our asset base significantly and brought relative balance to our portfolio of oil and natural gas assets.
Power and Renewables
Enbridge has invested more than $7.8 billion in renewable energy projects. Our Green Power and Transmission (GPT) business unit includes renewable power generation assets consisting of wind, solar, geothermal and waste heat recovery facilities. Our net interests in renewable power facilities— either operating or under construction—have the capacity to generate more than 1,700 MW of zero-emission energy in North America and Europe. Of this amount, approximately 477 MW are generated by wind facilities in Canada, approximately 912 MW are generated by wind facilities in the U.S. and approximately 100 MW are derived from a 24.9% interest in the 400-MW Rampion Offshore Wind Project in the U.K. Additionally, 155 MW are derived from a 25.5% interest in the Hohe See Offshore wind power project in Germany. Enbridge is also a 50% owner of Éolien Maritime France (EMF) SAS. EMF is in the late stages of developing 1,428 MW of offshore wind farms in France. Power produced from these facilities is sold under long-term power purchase agreements. GPT also includes three solar facilities located in Ontario and a solar facility in Nevada with 51 MW and 27 MW (our net interest) of power generating capacity respectively.
We also have interests in electricity transmission assets— including the Montana-Alberta Tie-Line (a 300-MW transmission line from Great Falls, Montana to Lethbridge, Alberta) and the East-West Tie Transmission Project (a 230-kilovolt transmission line in Ontario currently under development).
Both the NPS and the SDS have global demand for both electricity and renewable energy growing rapidly between now and 2040. The NPS projects global power demand nearly doubling between 2017 (6,961 GW) and 2040 (12,466 GW), while the SDS has global power demand reaching 14,655 GW by 2040. The NPS predicts that the percentage of global energy supply derived from renewables will more than double between 2017 and 2040, while the SDS suggests renewables will need to triple if we are to meet the UN’s SDGs.
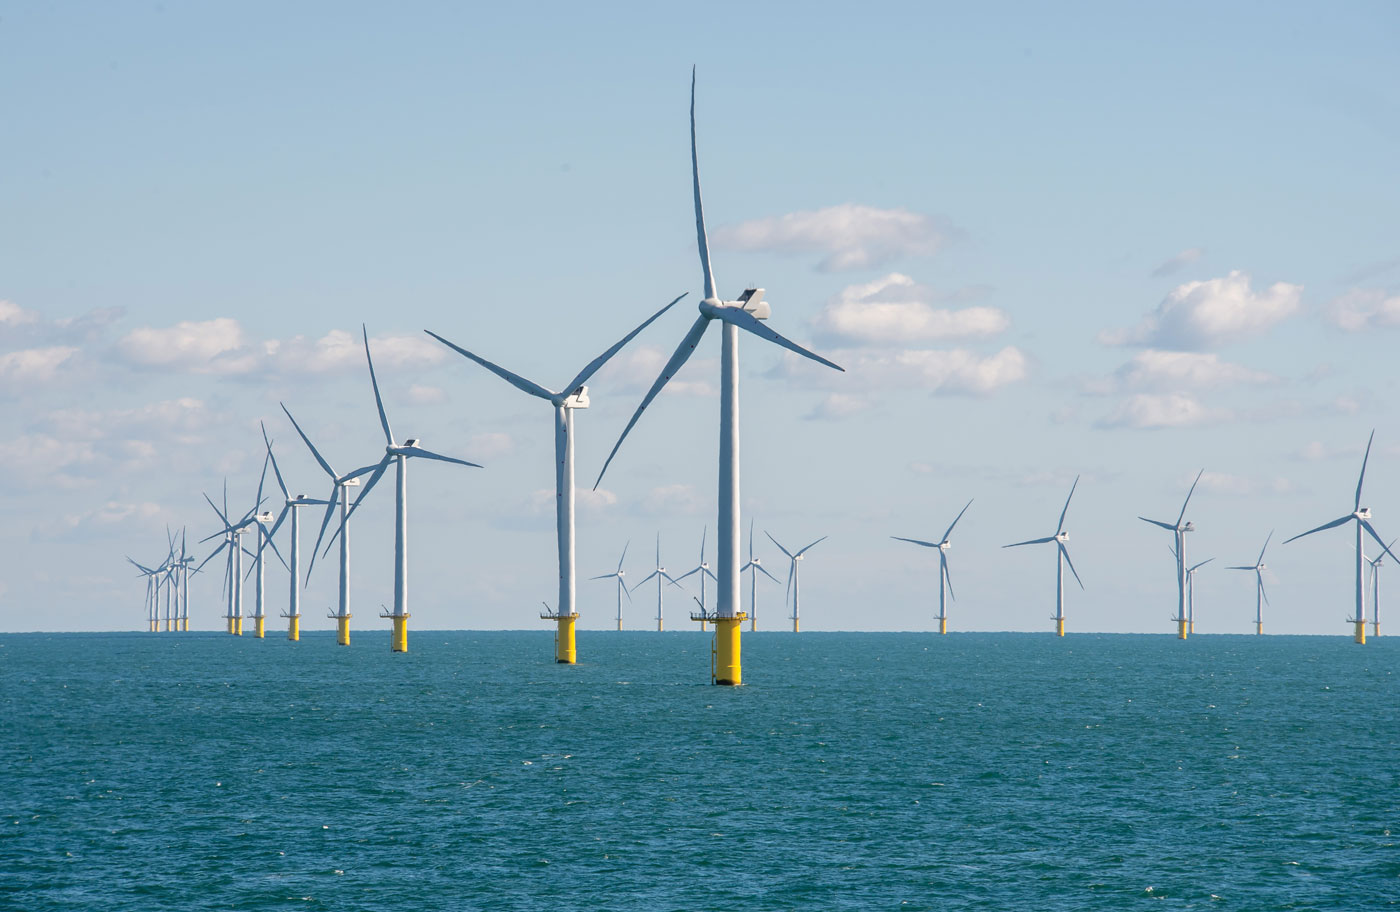
After one year in service, Enbridge’s Rampion Offshore Wind Project's 116 wind turbines have generated about 1,130 gigawatt hours of electricity. The 400-MW site, 13 km off the Sussex coast in the U.K., has the capacity to power 350,000 homes or around half the homes in Sussex, reducing carbon emissions by around 600,000 tCO2e a year.
Enbridge believes that diversification and innovation by incumbent energy companies have a significant role to play in the transition to a lower carbon future. Our investments in power and renewables provide Enbridge with experience in the development, construction and operation of onshore and offshore wind farms, solar generation, geothermal and electricity transmission projects.
In early 2018, we formed a joint venture with the CPPIB. By bringing them in as a minority interest partner in a sub-set of our renewable power projects in North America and as a development partner in the European offshore, we gained a very strong financial partner with whom we continue to pursue strategic renewable power investments. We are taking a deliberate, prudent approach to prepare for a world in which electricity, and renewable power generation in particular, become an even more important part of the global energy mix.
Our primary renewable development effort in the near term is directed at offshore wind projects in Europe, where we are able to obtain low risk commercial structures to support growth. This preference is based on a few key factors including: a firm belief that offshore wind can play a disproportionately strong role in the transition to a low carbon economy; decreasing levelized cost of offshore wind power; higher capacity factors relative to other renewable technologies; the reduction of overlapping and potentially conflicting land use objectives, both with respect to the physical footprint required for generation and high-voltage transmission to customers; and the increased power system efficiency that results from locating generation close to consumption centers, many of which are located along coastlines.
Enbridge will continue to develop our power and renewables business where we have a competitive advantage and where we find opportunities with strong commercial underpinnings. As opportunities emerge, we will be looking to manage financial, regulatory and construction risk while securing long-term power purchase agreements (PPAs). Our asset mix will continue to be informed by the global energy mix—as renewable demand increases, our investments in renewable energy are also likely to increase.