


Climate Change, Emissions Reduction & Energy Efficiency
Overview
We are taking measurable steps toward a low-carbon future.
We recognize that climate change is a global issue and that we all have a role to play in addressing it.
We believe that a low-carbon future can support a sustainable, competitive business environment while creating new opportunities for companies like Enbridge. The ability to diversify our business mix – and to substantially increase our natural gas business – was a key driver in our combination with Spectra Energy. We believe natural gas has and will continue to play a critical role in meeting society’s demand for energy and – because it is a less carbon-intensive fuel than other hydrocarbons – supporting global greenhouse gas (GHG) emission reduction goals. More broadly, our diversification enables us to leverage all of our company’s assets—liquids pipelines; renewable energy; and natural gas transmission, distribution and storage infrastructure—to support the transition to a low-carbon economy, while keeping pace with the world’s growing energy needs.
For more information on our renewable energy portfolio, please see our Renewable & Low Carbon Energy section of the Sustainability Report.
Our strategy to address the climate impacts resulting from our business and to support the global transition to a low-carbon economy includes: publicly tracking and reporting our efforts to reduce our energy use and GHG emissions; integrating climate considerations into key business decision making; taking an active and constructive role on new climate change policy solutions with governments, industry associations, environmental organizations and communities; exploring new lower carbon business opportunities, including our work to “green” the natural gas we distribute; and enhancing demand-side management (DSM) programs for customers of our natural gas utilities.
In this section of our Sustainability Report, we discuss our annual GHG emissions performance and management strategies but we recognize that there is growing interest from investors and other stakeholders in enhanced corporate disclosure on climate change. In 2017, the G20 Financial Stability Board’s Task Force on Climate-Related Financial Disclosure (TCFD) released its final recommendations regarding the inclusion of voluntary climate-related disclosures in mainstream corporate financial filings. In alignment with the key themes identified in the TCFD recommendations, this year we will also be releasing a separate report in which we discuss how we are addressing climate change-related risks and opportunities and the transition to a low-carbon future from a broader perspective.
5 performance objectives:
- Reducing our GHG emissions
- Improving our energy efficiency
- Helping customers of our natural gas utilities reduce natural gas consumption and lower their bills
- Responsibly managing our air emissions
- Integrating climate considerations into key business decision-making processes
2017 Highlights
Management Approach
Governance
The Corporate Social Responsibility (CSR) Committee of our Board of Directors has oversight at a governance level for all of our guidelines, policies, procedures, performance and risk management related to our CSR and sustainability performance, including climate change, energy use and carbon management.
Climate Policy
We share our stakeholders’ concerns regarding the impact of global climate change, and our corporate Climate Policy outlines the steps we are taking to manage climate risks and respond to opportunities associated with the transition to low-carbon sources of energy. This Policy is designed to ensure that our strategy and action on climate change-related issues are aligned with new and emerging market and regulatory trends, and also support ongoing corporate goals for current and future business development and growth.
Managing Climate Change Risk
Climate change and shifting business fundamentals pose several challenges and risks for us as a diversified energy delivery company that primarily transports liquid hydrocarbons and natural gas. These include: emerging climate-related policies and regulations such as carbon pricing, methane reduction and clean fuel standards; severe weather events; and changing investor expectations on climate risk management and disclosure. To manage these risks, we have a dedicated risk management function at the corporate level. For more information, please see the Risk Management section of our Sustainability Report. Further information on steps we are taking to manage climate risk will be provided in our 2018 Climate Report.
External Assurance and Third-party Verification
Integration of the operations and assets of Spectra Energy requires the combination of reporting processes for key performance indicators (KPIs) associated with our GHG emissions and energy consumption. In 2017, we initiated a review of how the two companies’ data systems, controls and performance metrics align with or complement each other. This work continued in 2018 and included a third party led data assurance readiness exercise to enable us to work towards achieving third party limited assurance of our GHG and energy consumption data in 2019.
2017 Performance
Reducing Our GHG Emissions
Developing Carbon & Energy Efficiency Plans
We recognize that for us to play a key role in the transition to a low-carbon future and support the achievement of national and global emission reduction goals, we must take a proactive approach to reducing our own carbon footprint. That approach includes a focus on reducing the carbon intensity of our operations through enhanced energy efficiency and a commitment to continuously improve the way we manage methane emissions from our facilities.
Targets: In prior years, Enbridge has set and achieved Scope 1 GHG reduction targets in our Canadian operations. We are currently in the process of setting second-generation, long-term targets for GHG emission reductions and energy efficiency through our development of Carbon & Energy Efficiency (CEE) plans for each of our major business segments that will encompass our combined asset base and operations.
Carbon Capture and Storage Technology
Advances in technology are enhancing our ability to significantly reduce emissions. Carbon capture and storage (CCS) technology - which involves capturing carbon dioxide (CO2) at source and injecting it deeply underground into geological formations for permanent storage – is an important step in mitigating the effects of carbon fuels. Enbridge’s Western Canadian operations have proven experience in small-scale CCS technology that is recognized by the United Nations (UN) Intergovernmental Panel on Climate Change as a critical emerging technology for reducing climate impacts. Several of our existing facilities are equipped with technology and equipment to separate CO2 and inject and permanently store it underground. We continue to advance feasibility analyses that may result in additional CCS opportunities.
Enbridge’s Scope 1 GHG Emissions, by Business Segment
The following tables show our Scope 1 GHG emissions between 2015 and 2017 for our Liquids Pipelines (LP), Gas Transmission and Midstream (GTM), Utilities and Power operations (UPO) and Corporate Services business segments:
| Scope 1 (tonnes of CO2e) | 2015 | 2016 | 2017 | |
|---|---|---|---|---|
| Liquids Pipelines | 44,000 | 22,000 | 20,000 | |
| Gas Transportation and Midstream | 1,822,000 | 2,080,000 | 9,392,000 | |
| Utilities and Power Operations | Enbridge Gas Distribution | 339,000 | 351,000 | 303,000 |
| Union Gas | See data table | See data table | 493,000 | |
| Power Operations | 200 | 100 | 200 | |
| Corporate Services | 1,300 | 1,600 | 4,4001 | |
| Total | 2,206,000 | 2,445,000 | 10,212,000 | |
* Column amounts may not equal totals due to rounding.
1 2017 Corporate Services data include the addition of legacy-spectra facilities (offices and aircraft)
Enbridge’s Scope 2 GHG Emissions, by Business Segment
The following table shows our Scope 2 GHG emissions between 2015 and 2017 for our LP, GTM, UPO and Corporate Services business segments:
| Scope 2 (tonnes of CO2e) | 2015 | 2016 | 2017 | |
|---|---|---|---|---|
| Liquids Pipelines | 4,546,000 | 4,988,000 | 5,395,000 | |
| Gas Transportation and Midstream | 207,000 | 233,000 | 1,032,0001 | |
| Utilities and Power Operations | Enbridge Gas Distribution | 1,600 | 1,300 | 900 |
| Union Gas | See data table | See data table | 1,700 | |
| Power Operations | 800 | 800 | 600 | |
| Corporate Services | 1,900 | 1,700 | 6,1003 | |
| Total | 4,757,000 | 5,225,000 | 6,436,000 | |
*Column amounts may not equal totals due to rounding.
1 There were no legacy-Enbridge assets in operation in Canada (BC operations) in 2015 and no Scope 2 data was collected for these operations in 2016 and 2017.
2 2017 electricity consumption data for legacy Enbridge’s U.S. based GTM assets has been assumed equal to 2016.
3 2017 Corporate Services include the addition of legacy-Spectra facilities (offices and aircraft).
Enbridge’s Scope 1 and Scope 2 GHG Emissions Combined
The table below presents our combined Scope 1 and Scope 2 GHG emissions totals for our LP, GTM, UPO and Corporate Services business segments:
| Scope 1 & 2 (t CO2e) | 2015 | 2016 | 2017 | |
|---|---|---|---|---|
| Liquids Pipelines | 4,590,000 | 5,010,000 | 5,415,000 | |
| Gas Transportation and Midstream | 2,029,000 | 2,313,000 | 10,424,0001 | |
| Utilities and Power Operations | Enbridge Gas Distribution | 340,000 | 352,000 | 303,000 |
| Union Gas | See data table | See data table | 495,000 | |
| Power Operations | 1,000 | 900 | 1,200 | |
| Corporate Services | 3,300 | 3,300 | 10,5002 | |
| Total | 6,964,000 | 7,680,000 | 16,648,000 | |
* Column amounts may not equal totals due to rounding.
1 2017 electricity consumption data for legacy Enbridge's U.S. based GTM assets has been assumed equal to 2016.
2 2017 Corporate Services include the addition of legacy-Spectra facilities (offices and aircraft).
Enbridge’s Scope 3 Emissions
To date, Enbridge has not measured the indirect emissions (Scope 3 GHG emissions) that result from our activities, nor have we set targets for them. However, we do track the Scope 3 GHG emissions that result from our natural gas utility customers’ natural gas use, from our employees’ air travel for business and for electricity grid loss.
The table below presents our Scope 3 GHG emissions totals from Grid Loss (t CO2e)1,2:
| Region | 2015 | 2016 | 2017 |
|---|---|---|---|
| Canada | 162,000 | 172,000 | 197,000 |
| U.S. | 112,000 | 126,000 | 165,000 |
| Total | 274,000 | 298,000 | 362,000 |
1 GHG Emissions that Result from Grid Loss: We provide a high-level estimate of the Scope 3 GHG emissions resulting from the loss of electricity during its transmission and distribution (grid loss).
2 The estimate assumes the 2016 national-level percentage grid losses apply for all years. Sources: ECCC NIR (2018) and EPA eGRID (2018).
The table below presents our Scope 3 GHG emissions totals from our customers’ natural gas consumption (t CO2e):
| 2015 | 2016 | 2017 | |
|---|---|---|---|
| Enbridge Gas Distribution | 22,700,000 | 20,700,000 | 20,800,000 |
| Union Gas | See data table | See data table | 24,100,000 |
| Total | 22,700,000 | 20,700,000 | 44,900,000 |
The table below presents our Scope 3 GHG emissions totals from employee air travel for business (t CO2e):
| 2015 | 2016 | 2017 | |
|---|---|---|---|
| Total | 5,600 | 4,300 | 7,1001 |
1The 2017 emissions for employee air travel are for the combined company operations.
Enbridge’s Methane Emissions
Methane emissions and, to a lesser extent, carbon dioxide emissions, result from natural gas that has either been vented to the atmosphere as part of normal operating procedures or from fugitive emissions, which are small leaks or releases of gases or vapors from pressurized equipment or components. We are committed to reducing these emissions. In some jurisdictions cast iron is a major source of fugitive methane emissions, whereas in Canada, all cast iron pipe has been completely replaced. Enbridge Gas Distribution finished removing all the cast iron piping from its natural gas delivery system in 2012 and continues to manage its system to reduce methane leaks and damages. We continue to be committed to reducing these emissions and are monitoring and responding to incoming Methane Regulations at the Federal level. Further information on steps we are taking to address methane emissions will be provided in our 2018 Climate Report.
Union Gas’s Approach to Facility GHG Emission Reductions
Following the completion of the Methane Emission Reduction and GHG Facility Abatement projects in 2016 and 2017 respectively, Union Gas established the Facility GHG Emission Reduction Program in September 2017. The purpose of this program is to ensure Union Gas meets its annual compliance plan obligations under Ontario’s cap-and-trade program and prepares effectively for federal methane reduction regulations that are anticipated to be implemented by 2020. Specifically, Union Gas’s program will:
- provide a forum to annually identify, review and evaluate new emission reduction opportunities;
- track progress on existing and in-flight opportunities;
- quantify and report actual reductions at Union Gas’s facilities; and
- assess costs and impacts associated with the implementation of new federal methane regulations.
Union Gas will annually review identified GHG emission reduction opportunities using criteria that effectively balance compliance obligations, anticipated future regulations, customer preferences and other noteworthy benefits such as safety and operational reliability.
Actions We Are Taking to Decrease Our GHG Emissions
Improving Our Energy Efficiency
In 2017, Enbridge continued to work towards reducing energy consumption from our operations through implementation of efficiency improvements and conservation efforts. For example:
- In June 2017, office employees in Edmonton were relocated to the new LEED Gold Certified Enbridge Centre building.
- Union Gas owns and operates LEED Gold certified buildings in three Ontario communities that achieve 40 percent savings relative to conventional buildings of the same size. For more information, please see Union Gas’s EnerSmart brochure.
- Enbridge Gas Distribution (EGD) has developed a five- year plan to reduce GHG emissions within Enbridge’s Ontario property holdings. In early 2017, EGD’s Victoria Park Centre Annex office and Meter Shop in Toronto, which have received LEED Gold certification, went into service.
- In 2017, our Houston office achieved an approximate 5% reduction in energy consumption over the previous year as a result of ongoing energy efficiency improvements.
- In February 2018, our Washington, D.C. office received LEED EB-O+M Gold certification.
Enbridge’s Energy Use
Our Energy Use, Enterprise-wide and by Business Segment
The following table shows our energy consumption within our operations between 2015 and 2017 for our LP, GTM, UPO and Corporate Services business segments.
| Company Energy Use (gigajoules) | 2015 | 2016 | 2017 | ||
|---|---|---|---|---|---|
| Liquids Pipelines | Fuel | 447,000 | 315,000 | 294,000 | |
| Electricity | 25,502,000 | 29,655,000 | 34,032,000 | ||
| Total Energy | 25,949,000 | 29,970,000 | 34,327,000 | ||
| Gas Transmission & Midstream | Fuel | 31,491,000 | 29,605,000 | 121,833,000 | |
| Electricity | 1,340,000 | 1,668,000 | 7,526,000 | ||
| Total Energy | 32,831,000 | 31,274,000 | 129,359,0001,2 | ||
| Utilities and Power Operations | Fuel | Enbridge Gas Distribution | 1,003,000 | 790,000 | 942,000 |
| Union Gas | See data table | See data table | 4,777,000 | ||
| Power Operations | 2,000 | 2,000 | 3,000 | ||
| Electricity | Enbridge Gas Distribution | 63,000 | 62,000 | 60,000 | |
| Union Gas | See data table | See data table | 149,000 | ||
| Power Operations | 6,000 | 6,000 | 9,000 | ||
| Total Energy | 1,075,000 | 860,000 | 5,941,000 | ||
| Corporate Services | Fuel | Company Offices & Aircraft | 38,000 | 24,000 | 73,000 |
| Electricity | 9,000 | 7,000 | 44,000 | ||
| Total Energy | 47,000 | 31,000 | 117,000 | ||
| Company-wide | Fuel | 32,981,000 | 30,736,000 | 127,923,000 | |
| Electricity | 26,921,000 | 31,399,000 | 41,820,000 | ||
| Total Energy | 59,902,000 | 62,135,000 | 169,743,000 | ||
* Column amounts may not equal totals due to rounding.
1 There were no legacy-Enbridge assets in operation in Canada (BC operations) in 2015 and no electricity data was collected for these operations in 2016 and 2017
2 2017 electricity consumption data for legacy Enbridge's U.S. based GTM assets has been assumed equal to 2016.
Liquids Pipelines’ Approach to Energy Efficiency
Enbridge’s Liquids Pipelines business segment implements a variety of techniques to optimize its’ operations and reduce power consumption across our network of oil pipelines. In 2017, these techniques included:
- Allocating larger volumes of crude oil to our more energy efficient pipelines and ensures that oil is balanced across both heavy and light crude lines holistically. This provides system-wide power savings and reduced electricity consumption.
- Similar to fuel efficiency for an automobile, operating a pipeline at consistent flow rate (“speed”) will lead to more energy efficient operation and less overall power (or “fuel”) consumption. With this analogy then, we work to both reduce instances of spikes in flow rate whenever practical (i.e. reduce “revving the engine”), as well as minimize shutdowns of the pipeline or pipeline segments (i.e. reduce “pumping the brakes”).
- The use of Drag Reducing Agent (DRA), a product that is injected into crude oil to reduce pipeline fluid friction, allowing oil to flow more efficiently, thus reducing total energy consumption.
Helping Customers of Our Natural Gas Utilities Improve Their Energy Efficiency
Through a wide range of Demand Side Management (DSM) programs, we encourage our natural gas customers—from homeowners to industrial facilities—to adopt energy-saving equipment and operating practices to reduce their natural gas consumption.
The DSM programs offered by our natural gas utilities consist of such energy-savings equipment and operating practices as: energy-efficiency audits of residential homes, commercial and industrial facilities; financial rebates; sharing of technical expertise; support to industry and trade associations in various sectors—schools, hotels and motels, construction, automotive, food and beverage, pulp and paper, etc.—to promote DSM programs and enhance industry standards and best practices; design charrettes (planning sessions) that support and educate builders on higher efficiency building options before construction begins; and partnerships with governments, suppliers and equipment manufacturers on investments in new energy-efficient technologies that benefit ratepayers.
In addition to its DSM programs, Enbridge Gas Distribution's Savings by Design and Union Gas’s Commercial Savings by Design green-building program helps builders construct energy efficient, healthy and sustainable homes that exceed the 2017 Ontario Building Code requirements by at least 15%. The programs bring together a range of subject-matter experts and financial incentives during the design, construction and commissioning stages of building and housing projects. In 2017, the energy efficiency programs offered by our natural gas utilities were recognized with awards from the Ontario Energy Association, the Ontario Sustainable Energy Association, and EnerQuality, which recognizes energy-efficient home building.
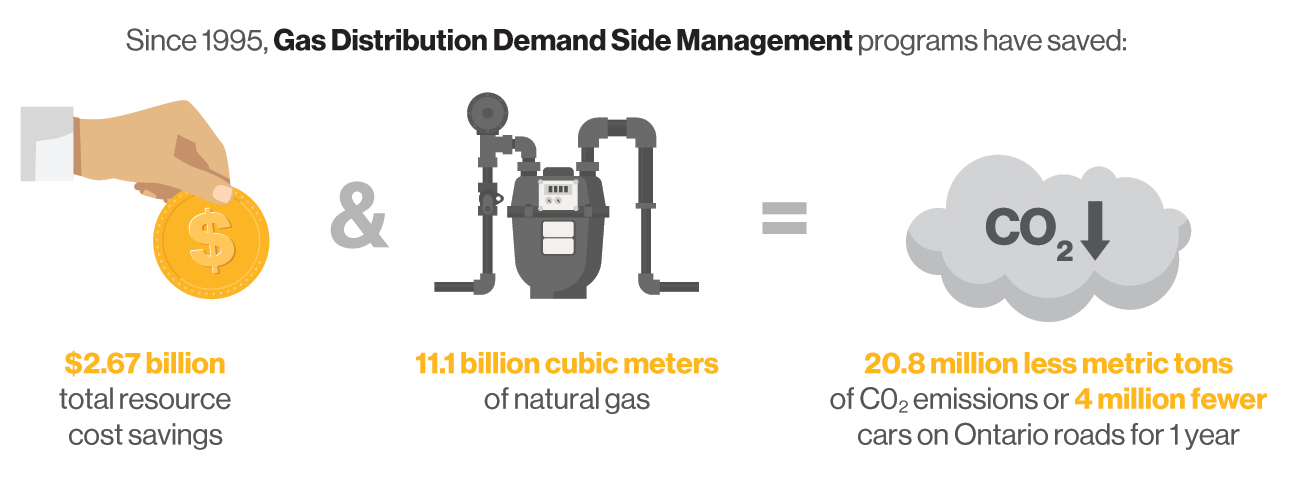
Cumulatively, between 1995 and 2016, Enbridge’s Gas Distribution energy efficiency programs reduced customer consumption by 11.1 billion cubic meters of natural gas, which is enough natural gas savings to serve nearly 4.6 million homes for one year. These gas savings have resulted in a reduction of 20.8 million tonnes of greenhouse gas emissions, which is roughly equal to removing 4 million cars from the road for one year. The total economic benefit of the programs since 1999 is $2.67 billion.
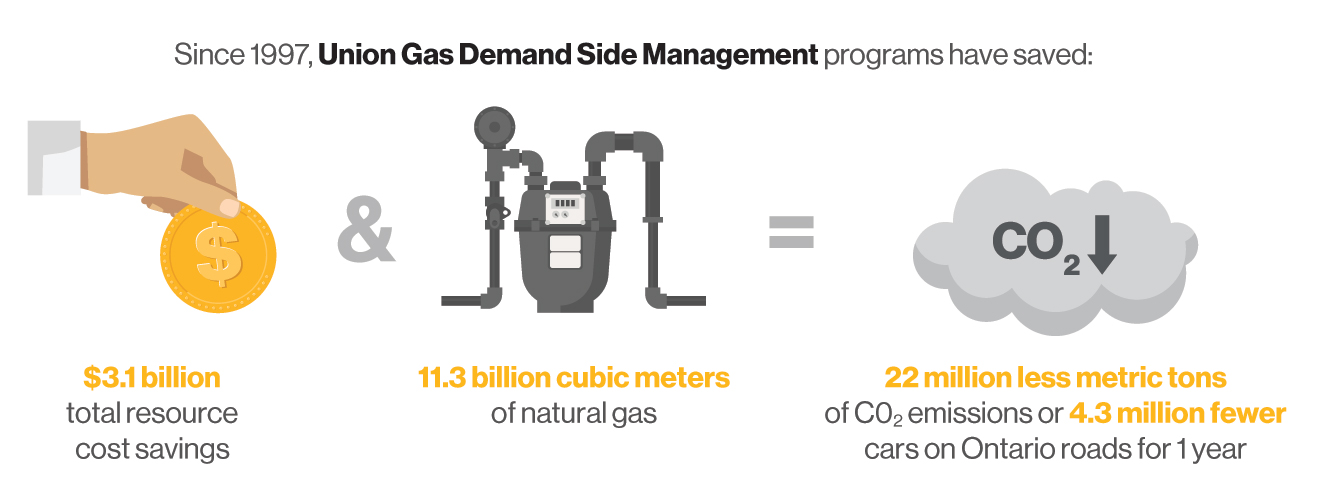
From 1997 through 2016, Union Gas’ DSM programs have saved an estimated $3.1 billion in total resource costs and 11.3 billion cubic meters of natural gas, which is enough natural gas savings to serve nearly 4.9 million homes for one year. These gas savings translate to a reduction of 22 million tonnes of CO2 emissions or the equivalent of removing 4.3 million cars from Ontario’s roads for a year. 1,2,3,4
1 2015 and 2016 spending and results are unaudited and subject to change.
2 Natural gas savings figures assume a residential customer using 2,400 m3 per year to heat their home and water
3 Greenhouse gas emission reduction estimates assume 1.875kg of CO2e are emitted for each m3 gas that is consumed
4 Vehicle estimates assume the average automobile produces 5.1 tonnes of CO₂ per year
Enbridge Gas Distribution’s Approach to Greening Natural Gas
As part of our strategy to support the transition to a low carbon future, Enbridge is working to vertically integrate its platforms for renewable energy and natural gas. We are engaging with the expansion of renewable natural gas (RNG) – energy produced from the decomposition of organic waste – as well as the introduction of power-to-gas (P2G) technology that produces hydrogen by developing the first utility scale P2G pilot facility in North America, in partnership with the Canadian tech firm Hydrogenics. The integration of renewable fuel supplies like RNG and hydrogen into existing pipeline distribution systems for natural gas could make a significant contribution to meeting emission reduction targets by reducing the carbon content of energy used to heat homes and buildings and to fuel transportation.
Power’s Approach to Optimizing Wind Power Performance
Enbridge, a Canadian leader in green energy investment, is using big data, machine learning and predictive analytics to help optimize our wind power performance across North America. Enbridge’s one-of-a-kind Performance Analytics and Situational Awareness (PASA) solution could be a game changer in a sector grappling with increasing maintenance costs. PASA helps optimize turbine servicing, avoid downtime, and predict mechanical issues—and could one day help ensure the viability of the wind energy industry as a whole.
To create the PASA solution, which has been fully operational since early 2017, Enbridge’s advanced analytics team developed machine-learning models to identify wind turbine blade defects, and estimate time-to-failure and remaining useful life for any given turbine blade. To date, this solution has:
- Allowed us to predict, identify and act on wind turbine defects in a timely fashion, with 50 percent projected annual savings on inspection costs;
- Reduced blade inspection process time from three months to three weeks, a change that trims costs, boosts productivity and enhances safety; and
- Reduced maintenance budget errors by more than 20 percent.
Enbridge researchers have been sharing their findings with industry and academic peers to help the industry improve the commercial viability of green energy projects.
Responsibly Managing Our Air Emissions
The major air emissions that our facilities release include carbon monoxide, nitrogen oxides and volatile organic compounds (VOCs). Other contaminants that they release, but in much smaller quantities, include sulfur dioxide, hydrogen sulfide, particulate matter and hazardous air pollutants such as n-hexane. Our facilities are designed to ensure that air emissions from our operations are kept below regulated limits.
These emissions are classified as criteria air contaminants (CACs) and are released through incineration, industrial processes and fuel combustion. We have established management programs that define our roles, responsibilities and timelines for reporting our CAC emissions to various government agencies in both Canada and the U.S.
Enbridge’s Criteria Air Contaminants (tonnes)
| Business Unit | ||||||
|---|---|---|---|---|---|---|
| Liquids Pipelines Canada | Liquids Pipelines U.S. | |||||
| 2015 | 2016 | 2017 | 2015 | 2016 | 2017 | |
| NOx (as NO2) | 117 | 91 | 33 | 24. | 5.9 | 4.5 |
| SO2 | N/R3 | N/R | N/R | N/R | 0.3 | 0.2 |
| VOCs | 2,676 | 2,382 | 2,756 | 699 | 700 | 676 |
| PM2.5 | 61 | 54 | 54 | 1.1 | 0.4 | 0.2 |
| PM10 | 564 | 509 | 509 | 1.1 | 0.2 | 0.3 |
| TPM | 2,179 | 1,967 | 1,967 | 1.1 | 0.2 | 0.3 |
| CO | N/R | N/R | N/R | 69. | 9.0 | 1.8 |
| Business Unit | |||
|---|---|---|---|
| Gas Transmission and Midstream (U.S. & Canada) | |||
| 2015 | 2016 | 2017 | |
| NOx (as NO2) | 2,110 | 2,087 | 16,391 |
| SO2 | 398 | 518 | 8,828 |
| VOCs | 1,377 | 1,377 | 2,353 |
| PM2.5 | N/R | 1.5 | 206 |
| PM10 | N/R | 1.5 | 200 |
| TPM | N/R | N/R | 282 |
| CO | 1,273 | 1,404 | 7,370 |
| Business Unit | ||||||
|---|---|---|---|---|---|---|
| Union Gas | Enbridge Gas Distribution | |||||
| 2015 | 2016 | 2017 | 2015 | 2016 | 2017 | |
| NOx (as NO2) | See data table | 541 | 148 | 83 | 72 | |
| SO2 | See data table | 0.3 | N/R | N/R | N/R | |
| VOCs | See data table | 6.8 | 30.0 | 20.1 | 29 | |
| PM2.5 | See data table | 1.3 | 1.8 | N/R | 0.7 | |
| PM10 | See data table | 1.3 | 1.8 | N/R | 0.7 | |
| TPM | See data table | 1.3 | 1.8 | N/R | N/R | |
| CO | See data table | 202 | 130 | 76 | 77 | |
*Column amounts may not equal totals due to rounding.
1 Data are for Criteria Air Contaminant emissions reported to environmental agencies (ECCC's National Pollutant Release Inventory in Canada and EPA in the U.S.)
2 "N/R" references in this table indicate that emissions were below regulatory reporting thresholds.
Integrating Climate Considerations into Key Business Decision-making Processes
A significant advantage of Enbridge’s combination with Spectra Energy is the alignment of our respective approaches to addressing climate change and supporting the transition to a low-carbon future, which includes a shared commitment to reduce operational GHG emissions, expand access to natural gas and provide enhanced energy services that generate savings and GHG reductions for our natural gas customers. Following the close of the merger in February 2017, we initiated a detailed review of the two companies’ climate change and GHG emissions management policies, systems and practices. We are continuing this process through 2018 to ensure a consistent approach for integrating climate considerations into key business decision-making processes across the combined company and alignment with Enbridge’s corporate Climate Policy.
In 2017, we also continued to advance work on the adoption of a carbon shadow pricing methodology that we could apply in our corporate planning and investment decision-making processes to ensure that they incorporate climate sensitivities and evaluate investment opportunities in relation to their impact on emissions and energy efficiency. Further information on the methodology will be provided in our 2018 Climate Report.
Conversations
A Conversation with Jamie Bonham, NEI Investments

1) What are some of the benefits of NEI’s approach of directly engaging with companies like Enbridge on sustainability issues such as climate change?
There are three aspects to this question.
The first aspect relates to the underlying aim of building a more sustainable and just society, with the low-carbon energy transition being a key pillar in that future. As a shareholder, we believe strongly that we are best able to achieve these outcomes through meaningful engagement with companies like Enbridge to: a) show that investors not only support proactive sustainability efforts, but that those efforts are critical to bottom-line performance; and b) where possible, provide input to help guide company strategy in this area. In our opinion, meaningful engagement creates better outcomes than simply avoiding a company or sector. Fundamentally, it is hard to change a company you don’t own.
Second, emerging responsible investing standards often highlight the importance of using investor engagement to address material environmental, social and governance (ESG) risks in their portfolio. There is a growing recognition that being a responsible investor demands some form of engagement.
And third, the low-carbon energy transition is massively complex and fraught with uncertainty. Engagement is a two-way street. While NEI aims to bring our insights and experience to bear, we learn as much from the company, if not more, about its challenges and opportunities, which opens up avenues to finding real solutions collaboratively. We need more, not less, genuine engagement on topics such as climate change.
2) NEI has been engaging with Enbridge on our climate disclosure for some time. How has that dialogue informed NEI’s understanding of Enbridge’s approach to addressing climate change and the transition to a low-carbon future?
Our ongoing dialogue with Enbridge on its approach to the low-carbon energy transition is a good example of why we see such value in engaging with companies. It allows us to ascertain how engaged senior management is on the issue of climate change, and as important, to gain a broader understanding of the company’s strategy for low-carbon resilience. Specifically, the engagement provides us with a window into the mechanics of how the company is actively trying to adapt its strategy—from setting emissions reduction targets, to building the climate expertise of the board, through to engaging operation-level staff. As a result, we have been able to contribute investor-related insights that have adjusted the company’s internal strategy and approach to long-term planning.
While we may not always agree with the final strategy decisions or policy outcomes, we do walk away with assurance that the company is treating the low-carbon energy transition as a material risk—and opportunity—that requires a substantive response. For an investor who is concerned about performance beyond the next quarter, this is a necessary level of comfort to have.
3) As an investor, what are your thoughts on the recommendations of the Task Force on Climate-Related Financial Disclosures (TCFD) as a framework for reporting on the management of climate-related risks and opportunities?
We have been following the development of the TCFD framework (the Framework) closely and have been an active participant in the consultations that led to the final recommendations. We are very supportive of the final outcome and believe that the recommendations mark a very important milestone in the area of climate-related disclosure. In our opinion, the Framework will only continue to grow in importance for the investor community and may eventually become a de facto standard, despite its voluntary nature. While it is still early days, the Framework will continue to adapt and improve as companies and investors start implementation.
What is truly game-changing about the Framework is not necessarily the recommended disclosures, rather, the identification of climate change as a systemic risk to the financial system; and the explicit focus of the Framework on investors and financial institutions themselves is a monumental shift. It is a significant development that the body tasked with ensuring the stability of the global financial system is asking the financial community to assess and disclose its exposure to climate-related risks and opportunities. Investors will in turn be demanding climate-related disclosure from companies in order to be able to properly assess these risks, and the demand for enhanced corporate disclosure and low-carbon resilient strategies will increase. This marks a step-change in investor focus on corporate climate-related disclosure, which in the end will be a net positive for everyone.Don't lose your comments!
Make sure you bookmark or email this unique key to yourself so that you can always access your comments. Your comments will remain completely anonymous and will not be shared with any third party organizations or individuals. Read more about Enbridge's privacy policy.
Copy to clipboard
Email
Submit